
Abstract
The paper investigated the effect of localized friction on sheet thinning under lubricated conditions in the deep-drawing process. The Finite Element Analysis (FEA) was used to evaluate the sheet thinning of the AISI 304 sheet under six segmented blank-sheet interfaces. Different values of variable coefficient of friction (VCOF) in each segmented area were investigated, and the sheet thickness values at the considered areas were measured. The regression analysis models (Linear Regression, Response Surface Method, and Polynomial Regression) was used to determine the relationships between VCOF and sheet thinning. The results showed that the Linear Regression showed the best fit. The significant factor analysis was also carried out to determine how the localized friction affected the sheet thinning. The contributions of VCOF from at least two segmented areas affected the sheet thinning at any particular location. The obtained relationships of the VCOF and sheet thinning could be beneficial for the localized friction control for highly complex shapes.
Keywords
Introduction
Modern deep-drawn products are highly complex and require high formability parts. Several closed-loop control techniques (such as blank holder force control and multi-step forming with annealing) can be applied to increase the formability in the deep-drawing process.1–4 In deep drawing, the influential factors were tool radius, friction coefficient, material flows, and blank holder force. 5 Spring back has been one of the major problems commonly found in sheet metal forming. 6 The material flow must be well controlled to prevent common defects (wrinkling and tearing), which can be observed in the forming limit curves (FLC). 7 There have also been many research investigations on how to test the sheet formability.8–10
Another critical factor that can affect the formability in the deep-drawing process is friction. Sniekers investigated frictional phenomena in deep-drawing and observed the subsurface deformations affecting the accuracy of the coefficient of friction (COF) calculation. 11 The effects of the blank holder force on friction in deep drawing were observed by Aleksandrović et al. 12 Hassan et al. performed the segmentation of blank holders under different friction conditions and found out that the local wrinkling problems could be reduced by friction. 13 Olguner and Bozdana investigated friction effects on the punch load and thickness reduction in deep drawing. 14 Gil et al. used the pressure-dependent friction coefficient in predicting the springback of automotive parts and observed that the prediction was improved by considering the changes in friction under different pressures. 15 The influences of friction on the formability of steel sheets were examined by Tekaut.16,17 According to the aforementioned studies, different areas in deep-drawing should be under different friction conditions or having a variable coefficient of friction (VCOF) to obtain the highest formability results.
Nevertheless, one of the main challenges in deep-drawing is to integrate VCOF in the process because the effect of variable friction conditions depends on many factors such as materials, geometries, and loading conditions. As a result, the effects of VCOF in deep-drawing to the formability should be understood. One of the commonly used tools is Finite Element Analysis (FEA) that can simulate and analyze the forming behaviors under different conditions.18–23 In addition, the optimization methods have also been applied to predict forming behaviors in the deep-drawing process.24–25 This paper integrated FEA and optimization methods to predict the effects of VCOF on formability in deep-drawing. Since the primary concern here was tearing, sheet thinning was used as an indicator for the formability. The predicted results would be helpful to prevent tearing, but the optimized VCOF values would also be essential for the closed-loop control in deep-drawing for highly complex shapes.
Methods and materials
Deep-drawing experiment
The sheet material investigated in this study was AISI 304. This type of material was the austenitic chromium-nickel stainless steel, providing excellent corrosion resistance. 26 The length of the blank was parallel to the rolling direction. The planar anisotropy of AISI 304, especially in the annealed condition, was neglected in this study. The tensile tests of the material were conducted to obtain the material flow curve (power-law), as shown in equation (1).

where
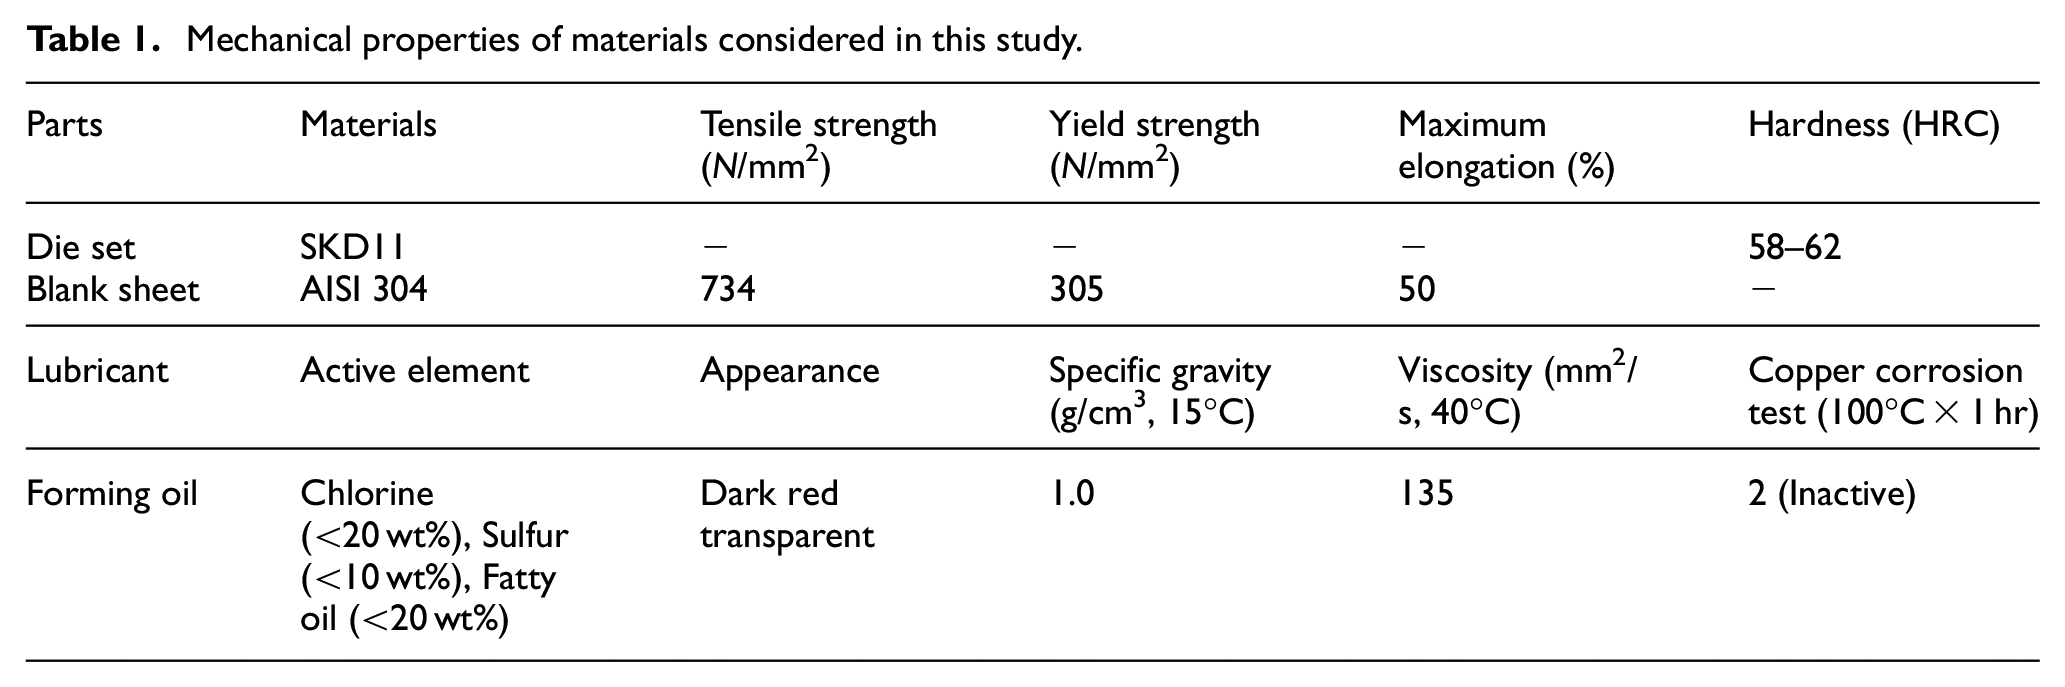
Each blank had a dimension of 337.5 × 237.0 × 0.4 mm3 (Length × Width × Thickness). The punch dimensions were 112.06 × 99.56 × 45.0 mm3 (Length × Width × Height). The die opening area was 113.02 × 100.52 mm2 (Length × Width), and the die radius was 1.0 mm. The blank holder plate was 440.0 × 347.5 × 30.0 mm3 (Length × Width × Height). The material of the die set (punch, die, and blank holder) was SKD11. This type of material was the high-carbon and high-chromium alloy tool steel and had excellent wear resistance. 27 Figure 1 illustrates the deep-drawing setup, and Table 1 shows the mechanical properties of materials considered in this study.

Deep-drawing setup.
Mechanical properties of materials considered in this study.
The strip-drawing experiment was conducted to determine the coefficient of friction between the tool-sheet interface under the considered lubricant.28–29 The strip-drawing results showed that the COF was 0.125 for the entire tool-sheet interfaces. In this study, the deep drawing setup was located in the stamping press. The blank holder forces were set by using the nitrogen gas springs. Each nitrogen-gas spring could provide a maximum blank holder force (BHF) of 2.43 tons, and was set to various BHF levels by regulating the pressure inside the gas spring using a control valve, as shown in Figure 2. Note that the blank holder forces were set by changing pressure in each gas spring group. The punch speed was 10 mm/min, and the depth of the deep-drawn parts cup was 30 mm.

The blank holder setup.
After each test, the percentage of thinning of sheet thickness after being deep-drawn was used as the formability indicator. The sheet thickness at three directions (0°, 45°, and 90°) was measured at 10 locations and repeated three times at the position by using a micrometer, as shown in Figure 3. The percentage of thinning was calculated by equation (2).

where T% is the percentage of thinning, Tinitial is the initial blank sheet thickness (0.4 mm), and Tfinal is the final sheet thickness.
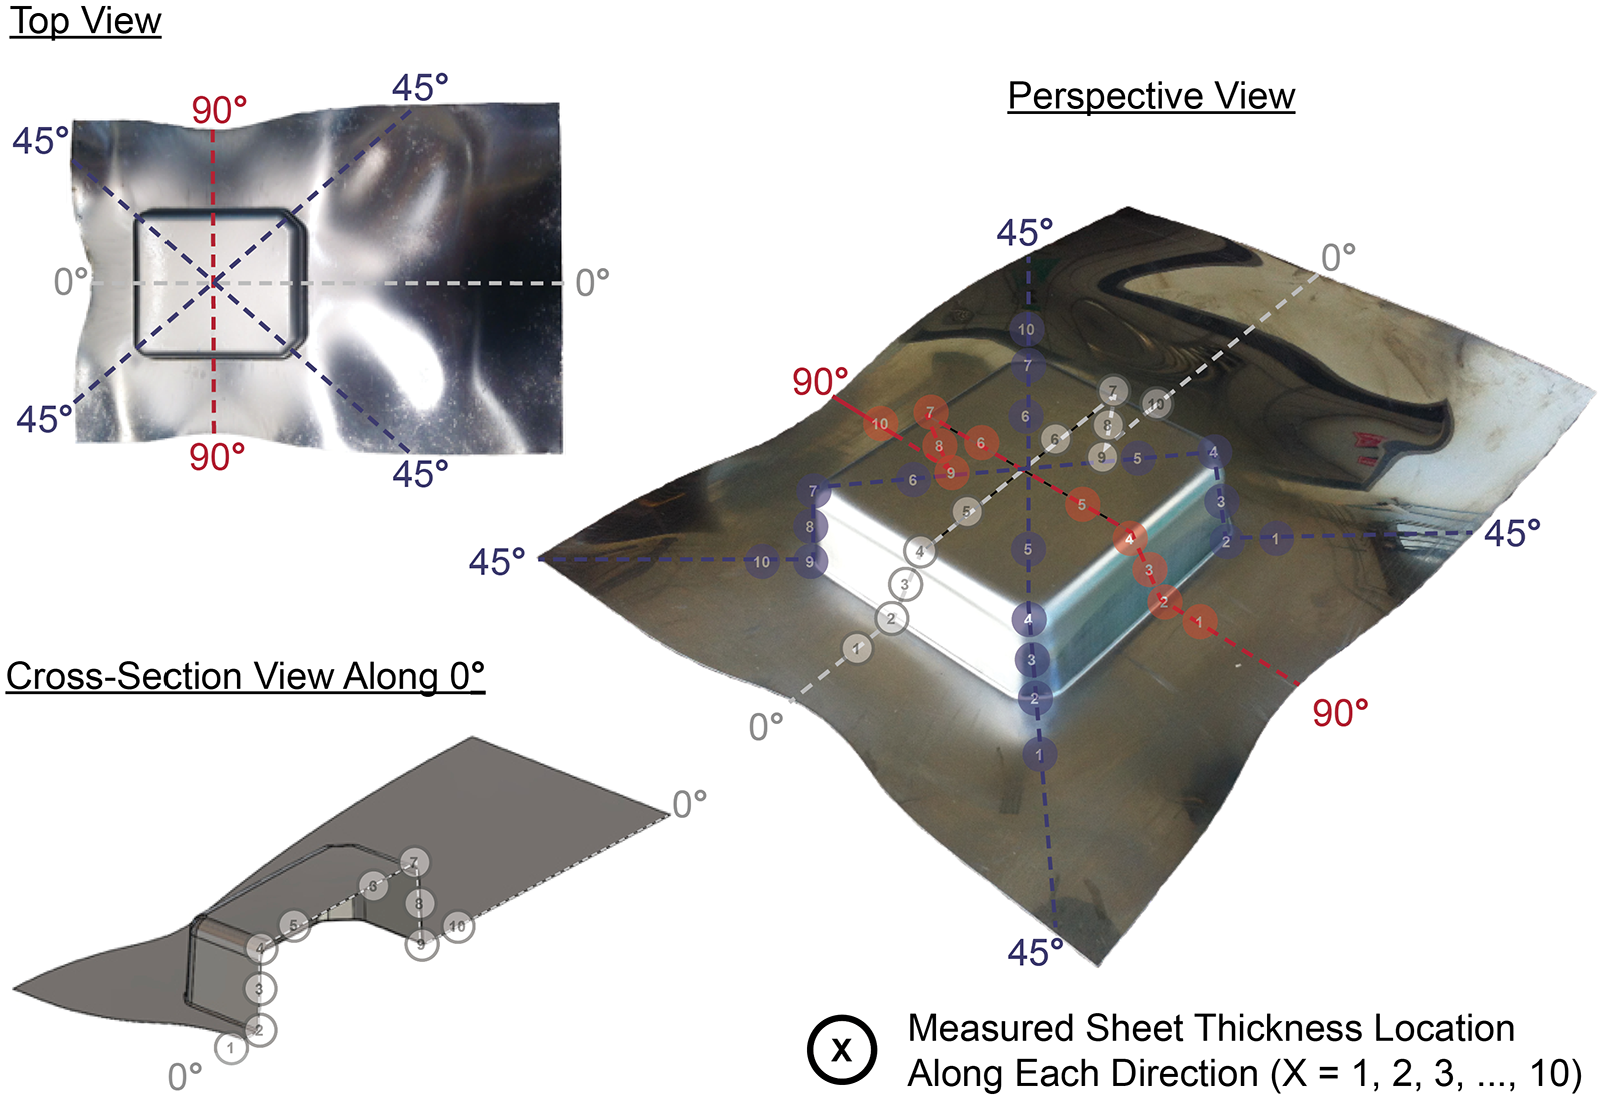
Sheet thickness measurement locations.
Numerical methods
Finite Element Analysis (FEA) was utilized to observe the forming behaviors under different friction conditions in deep-drawing. The deep-drawing process was modeled using commercial FE software MSC Patran 2015 and MSC Marc Mentat 2015. The MSC Patran 2015 was used for modeling rigid element surfaces of the die, punch, and gas spring cushion pins. MSC Marc Mentat 2015 was used as a model solver. The material flow curve of the AISI 304 sheet was obtained from the tensile test, and its material model could be represented by a power-law according to equation (1). The blank holder and die were set as a 2D solid surface (rigid bodies). The blank holder-sheet interface was segmented into six areas, as shown in Figure 4. Note that only half of the deep-drawing setup was modeled due to its symmetry. The blank sheet was modeled as deformable bodies. The sheet had 9971 elements of eight nodes, solid shell, brick topology element with an initial thickness of 0.4 mm.

Segmented areas in the FEA model.
The initial COF values of all the segmented blank-sheet areas were set to be 0.125, according to the strip-drawing test. The selected friction model for the FEA setup was Coulomb Arctangent (Velocity). During the FEA simulation, the punch was set to be stationary at the bottom, while the die was moved downward until it reached the depth of 30 mm. The clamping force from each gas spring was transmitted to the blank holder plate, which was modeled as a deformable body. The overall numerical methods used in this study are shown in Figure 5. The FEA setup was verified by comparing the sheet thickness values at different locations with those of the experiments. If the FEA results had errors within 15%, there were considered acceptable. Then, the same FEA model was used to vary localized friction or VCOF through the Design of Experiment (DOE). Within the DOE, the best (fittest) regression model was evaluated. The prepared regression model was then used to predict sheet thinning under different VCOF values.

Flow chart of the methods used in this study to investigate the effects of VCOF to sheet thinning in deep-drawing.
Table 2 shows the DOE of the considered VCOF values in the segmented blank-sheet interfaces. The range of VCOF values was from 0.050 to 0.425 (77 cases) and set in the FEA model. The minimum VCOF value (0.050) was based on the study of Bernoulli et al., 30 and the maximum VCOF value (0.425) was obtained from the report of Buckley. 31 The set VCOF values were used as the input parameters, and the sheet thickness values obtained from the FEA results were then used as the response parameters in the optimization model. Note that the response values were not shown in Table 2.
DOE of the considered VCOF values in the segmented blank-sheet interfaces.

Three regression models were selected to determine the best (fittest) model. 32 The first model was the Linear Regression, which could be written, as shown in equation (3):

where r is the responding factor, x and y are the input factors, βi is the coefficient of the fit-model term, and i is the number of fit-model terms. The second regression model was the Response Surface Method (RSM), as shown in equation (4).

The last regression model was the Polynomial Regression, as written in equation (5).

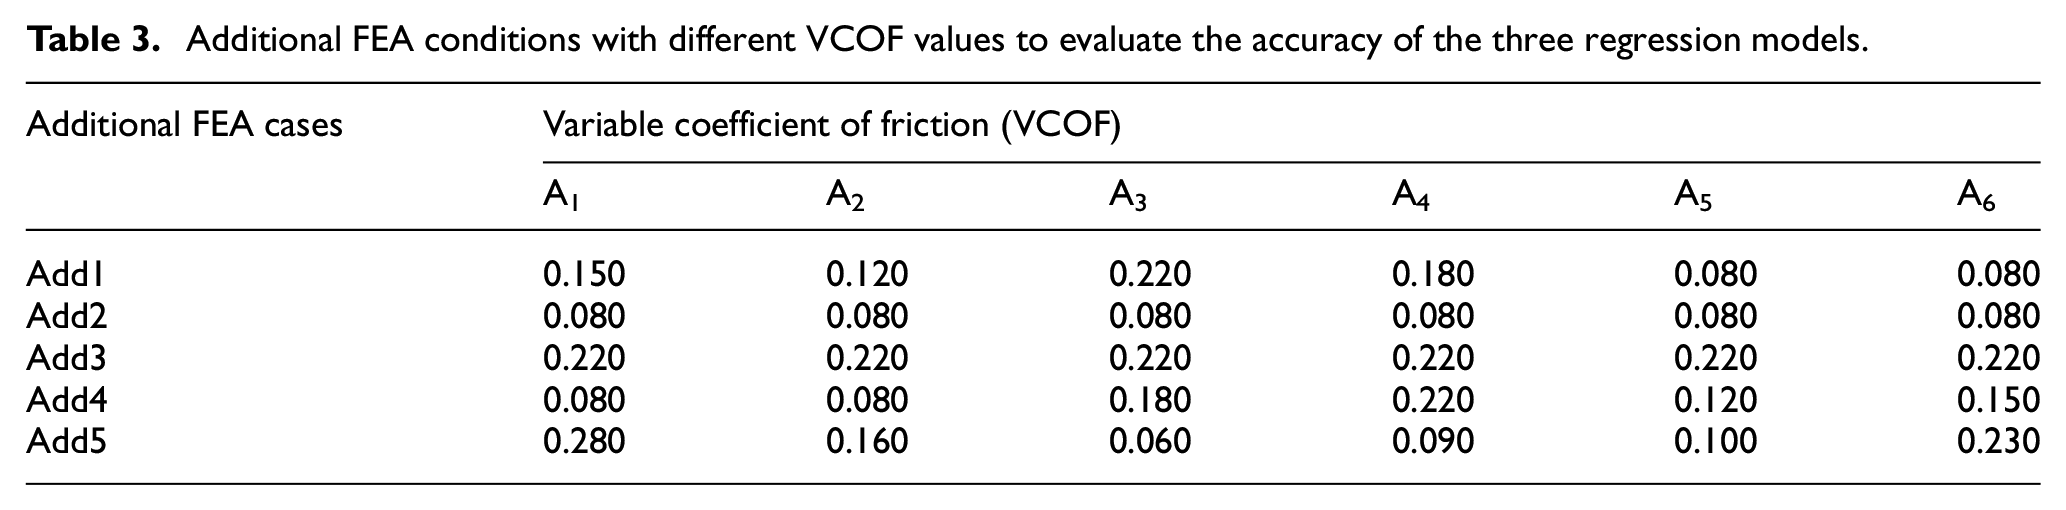
The input values (VCOF) from Table 2 and the response values (sheet thickness values) obtained from the FEA results were used to calculate the βi values of all three regression models. Then, the accuracy of these models was determined by using the additional FEA conditions shown in Table 3.
Additional FEA conditions with different VCOF values to evaluate the accuracy of the three regression models.
The optimization method of the coefficients of each regression method was determined by using MATLAB. The predicted sheet thickness values of each regression model were compared with those of the FEA results. The prediction error (%Error) values were calculated by using equation (6).

where tr is the predicted sheet thickness value, and tFEA is the sheet thickness value from the FEA results. Note that the %Error values were calculated at the three measurement directions (0°, 45°, and 90°) and ten measurement points, as displayed in Figure 3. Afterward, the significant analysis of the βi values in the best (fittest) regression model was carried out to observe the influences of VCOF on the sheet thinning values.
In summary, the response surface method from the DOF having two-level full factorial analysis with six continuous factors was used extract the thinning value at each simulation.
Results and discussions
FEA model verification
An example sheet thickness results comparison between those of experiment and FEA is shown in Figure 6.

Comparison of the sheet thinning values between the FEA and experimental results (VCOF = 0.125 for all blank-sheet interfaces).
It could be clearly observed that the results of both the experiment and FEA were in agreement according to the calculated percentage of thinning values. Note that the locations number eight were prone to thinning because the nearby areas (locations number seven and locations number nine) were the cup corners, restricting the material flow and causing the sheet to elongate with reduced thickness. Location numbers 1 and 10 provided the lowest percentage of thinning values because these areas were tightly compressed between the die and blank holder, prohibiting the sheet from moving and deforming. According to the FEA results, the error between FEA and experimental results was below 15%, which was considered acceptable for this study.
Results of the investigated regression models
The three regression models were developed by using the data from Table 2 to determine their βi values, and the additional conditions shown in Table 3 were used to determine the %Error values. Table 4 shows the %Error values of the investigated regression models.
The %Error values of the investigated regression models.
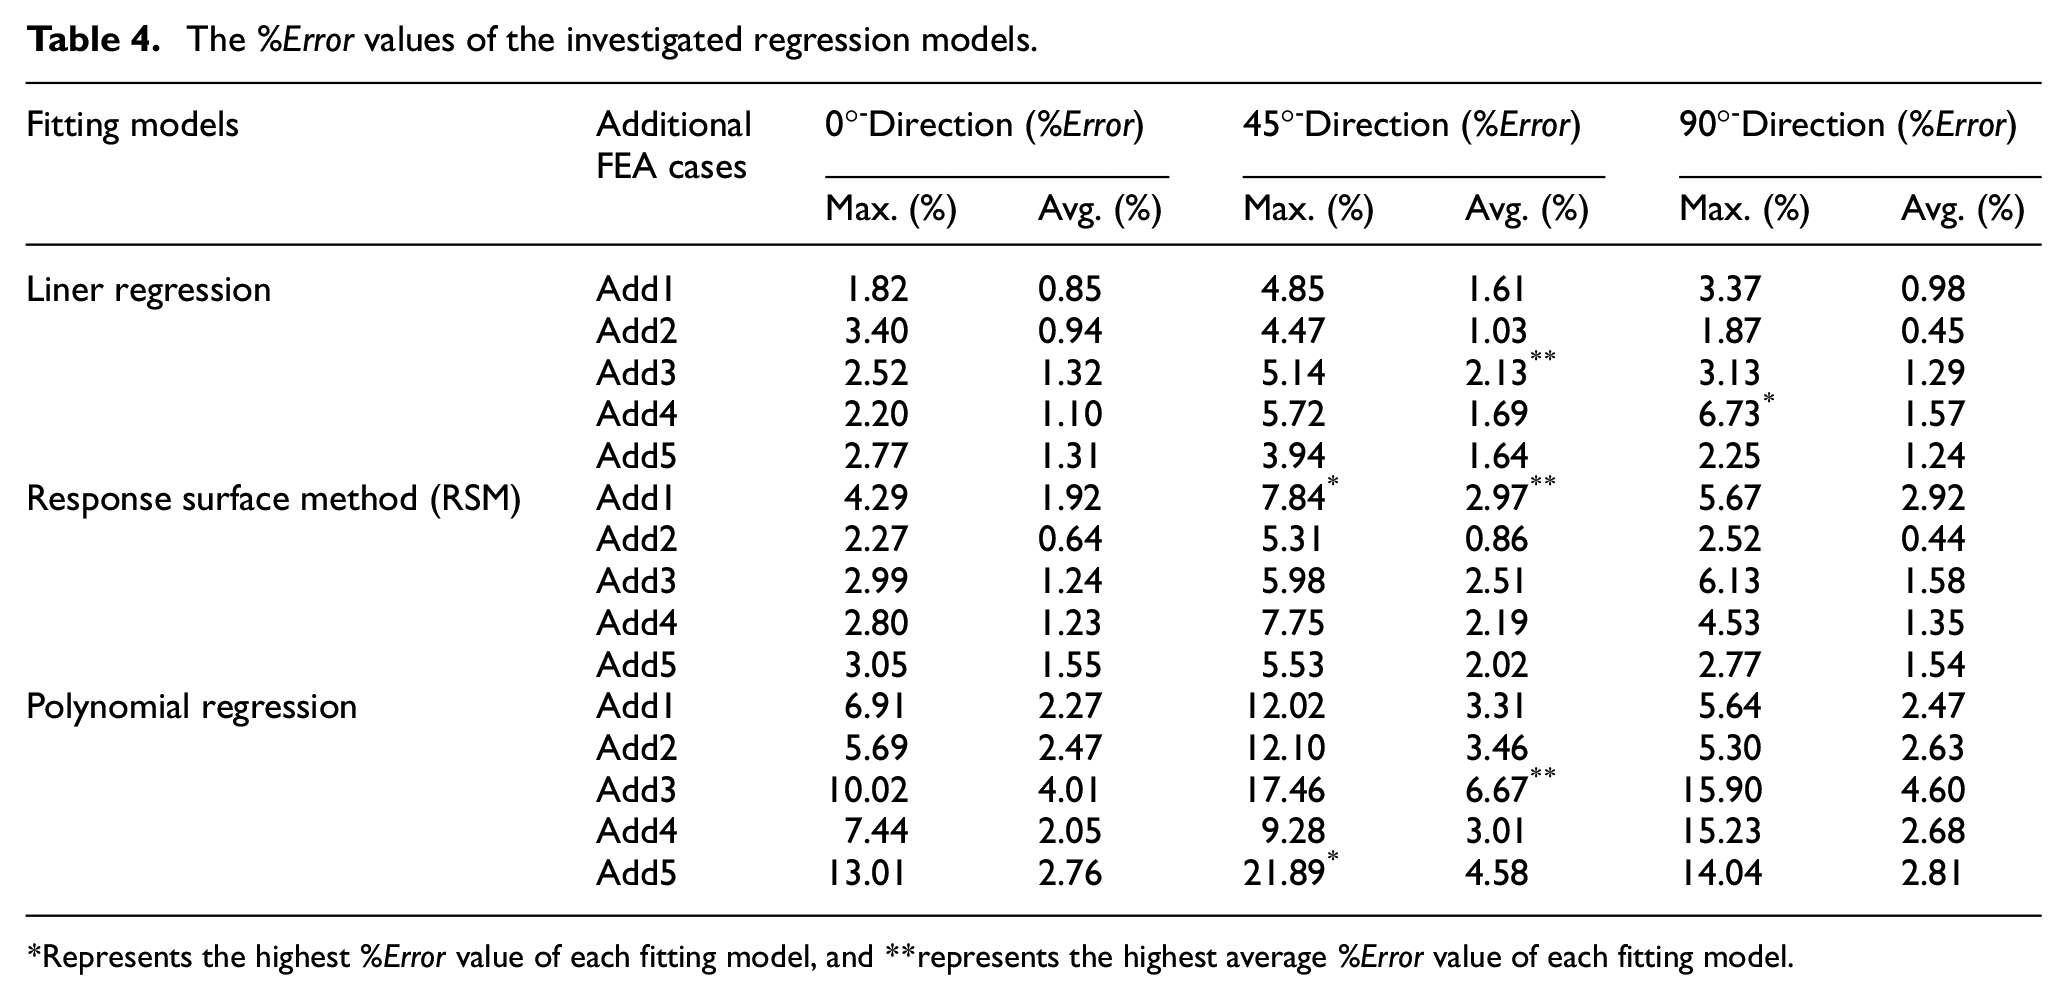
Represents the highest %Error value of each fitting model, and **represents the highest average %Error value of each fitting model.
The results showed that the Linear Regression model provided the best fitting model to predict the sheet thickness values (1.28% Average, and 6.73% Maximum). The RSM model provided the higher %Error values of (2.97% Average, and 7.84% Maximum). The Polynomial Regression model provided the highest %Error values (3.39% Average, and 21.89% Maximum). The results demonstrated that the increasing high order fitting term led to increasing %Error values. As a result, sheet thinning could simply be modeled by the Linear Regression model. In other words, the sheet thinning value had a linear relationship with the VCOF values.
The following equation showed the linear regression model obtained from this study.

where tn is the predicted sheet thickness at a measured location, n is the measured location, f1–f6 are VCOF values of the segmented areas (A1–A6), C and βi are the constants. The predictions by using the Linear Regression model were also mapped with the results of the deep-drawing experiment, as illustrated in Figure 7. The deep-drawing experiment result showed that tearing occurred in the bottom corners of the part. The two locations shown in the figure were locations four and seven, respectively, of the 45°-direction. The Linear Regression models of locations four and seven are shown in equations (8) and (9), respectively.


where t4 is the predicted sheet thickness at location four, and t7 is the predicted sheet thickness at location seven. The sheet thinning behaviors were affected by the different contributions of the VCOF values in different areas. Some segmented areas having higher coefficients would influence more than the others did. For instance, areas A3 and A4 had higher coefficients in both locations. Thus, friction reductions should be focused at these locations.

The tearing locations in the deep-drawing experiment and linear regression model predictions.
The significant factor analysis of the Linear Regression model was carried out by using the two-sample test (t-test) method. 32 Since the output response with 95% (α = 0.05) confidence level was set, and the experiment degree of freedom (DOF) was 2n − 2 = 152, the significant t-value, t, of variable factor equal to 1.645. If a t-value of the observed term was large enough (|t| ≥ 1.645), it was concluded that the observed term was significant. The significant factor analysis results of the Linear Regression model are shown in Table 5. Nodes 1–10 represented the measuring locations in Figure 3.
Significant factor analysis results of the linear regression model.

High-significant factor (|t-value| > 2.326, α < 0.01 or Confident level > 99%).
The values of nodes two and nine (die radii) were note shown here because the significant variable values were lower than 1.645. The results obtained from Table 5 show how sheet thinning at different locations were affected by the contributions of different VCOF in different areas. The results showed that sheet thinning at any location was affected by the contributions of at least two segmented areas. However, sheet thinning was not affected by all of the considered areas. As a result, localized and variable frictions affect the formability in deep-drawing. Based on the results, the VCOF values in different areas could be controlled (optimized) to prevent tearing at different locations. Ultimately, the more precise or complex shape parts in deep-drawing could be obtained by localized friction control.
Conclusion
This study experimentally and numerically investigated the effect of the localized friction on the sheet thinning of AISI 304 in the deep-drawing process. Six segmented areas of the blank-sheet interfaces were investigated by varying the coefficient of friction values from 0.050 to 0.425. The integration of the Finite Element Analysis (FEA) and the regression analysis was used to predict sheet thinning along the 0°, 45°, and 90° directions. Three regression models (Linear Regression, Response Surface Model (RSM), and Polynomial Regression) were evaluated. The results showed that the Linear regression model was the best (fittest) model to predict sheet thinning affected by localized friction. The significant factor analysis of the Linear Regression model was carried out. The results showed that sheet thinning at any location was affected by the contributions of at least two segmented areas. The variable coefficient of friction (VCOF) values in different areas could be controlled (optimized) to prevent tearing at different locations.
Footnotes
Handling Editor: James Baldwin
Declaration of conflicting interests
The author(s) declared no potential conflicts of interest with respect to the research, authorship, and/or publication of this article.
Funding
The author(s) disclosed receipt of the following financial support for the research, authorship, and/or publication of this article: This study was supported by the NSTDA University-Industry Research Collaboration (NUI-RC) [grant number NUI-RC-M33-12-56-002D], LPN Metallurgical Research Center Co., Ltd., Diamond Brand Co., Ltd., National Metal and Materials Technology Center (MTEC), and Department of Mechanical Engineering, Faculty of Engineering, Khon Kaen University.