
Abstract
The strengthening effect and uniformity of residual stress and strain of 7075-T6 aviation aluminum after laser shock peening were investigated. The finite element simulation model of laser shot peening on 7075-T6 aviation aluminum alloy was established and verified. On this basis and combined with experiment, the microstructure, residual stress distribution and equivalent strain distribution of 7075-T6 aviation aluminum alloy after laser shock peening were studied. An index U for evaluating the strain uniformity in the peened area was proposed based on the statistical processing of the equivalent strain distribution in the peened area. The results show that the average grain size on the peened surface of the specimen was refined to 20–30 μm after LSP, and a residual compressive stress layer with thickness of about 0.5 mm was induced on the surface. Grain refinement and residual compressive stress can promote the strength and fatigue properties of 7075-T6 aviation aluminum alloy. The minimum value of U is obtained in the 6 × 6 spot array (the corresponding overlap ratio is 58%), which suggest that the most uniform deformation peened area can be obtained by using 58% overlap ratio in the laser shot peening process, which can avoid stress concentration and improve fatigue life.
Keywords
Introduction
7xxx aluminum alloy has high specific strength, good ductility, and toughness, so it widely used in the manufacture of upper wing skins, stringers, and horizontal/vertical stabilizers.1,2 7075-T6 aluminum alloy is one of the maximum strength aluminum alloys and is a classic material in the fabrication of wings and cargo panel parts. 3 Fatigue fracture and corrosion damage is a non-negligible problem for the components in aging aircraft. Surface treatment technology is often used during manufacturing and repairing to ensure the components have good fatigue and corrosion resistance. In recent years, laser shock peening (LSP) has been gradually applied to the aircraft industry due to its precise and efficient surface strengthening.
Laser shock peening (LSP) uses high power density (>109 w/cm2), short pulse width (tens of ns) laser to irradiate the ablative layer (black tape, black paint or aluminum foil), which is covered by the transparent confinement layer (water, K9 glass or resin). The ablative layer vaporizes and produces a large amount of plasma after absorbing the laser energy. Then, high-intensity shock waves (>109 Pa) generates and propagates toward the target material. The target material plastically deforms when the pressure of shock waves is larger than its Hugoniot elastic limit. Compared with shot peening, LSP has the advantages of deeper strengthening layer, 4 better strengthening effect and smaller target surface roughness. 5
Laser shock peening is widely used in surface treatment of aluminum alloy. Studies focus on the laser shock peening process on aluminum alloy have been reported recent years. In the study of residual stress induced by laser shock peening, Salimianrizi et al. 6 investigated the surface residual stress of 6061-T6 aluminum alloy after laser shock peening. The results shows that the residual stress improved from −5.9 MPa to −327 MPa after laser shock peening. Hfaiedh et al. 7 established three-dimensional numerical model of laser shock peening and studied the residual stress distribution of 2050-T8 aluminum alloy after laser shock peening. The results show that there is a residual stress gradient on the peened surface, and the residual stress gradient is about 0.25–0.7 MPa/μm. Luo et al. 8 studied the residual stress uniformity of LY2 aluminum alloy after laser shock peening with the overlap ratio of 30%, 50%, 70% and 90%. The results show that, for large area laser shot peening, the residual compressive stress with good uniformity and deep depth can be obtained by using the overlap ratio larger than 50%. In the study of microstructure after laser shock peening, Ding et al. 9 studied the effect of shock times on the grain refinement of LY2 aluminum alloy. The results show that the grain size refinement rate decreases with the increase of shock times. When the number of shock times is more than four times, the grain size of the severely plastic deformation layer is almost no longer reduced. The study of Lu et al. 10 and Wang et al. 11 also show that laser shock peening can refine grains effectively. In the study of deformation uniformity after laser shock peening, Luo et al. 8 studied the surface morphology of LY2 aluminum alloy after laser shock peening. The results show that 50% to 70% overlap ratio is a good choice to obtain uniform surface morphology. In the study of surface microhardness after laser shock peening, Mostafa et al. 12 studied the surface microhardness of 7075 aluminum alloy after laser shock peening. The results show that the hardness of 7075 aluminum alloy increased to more than 80% by increasing the number of laser shots irradiated per unit area.
Compared with the experiment, the accurate finite element model can be used to analyze the stress and strain more efficiently and dynamically. In this study, a LSP three-dimensional nonlinear FE model for LSP was established based on ABAQUS software and verified by comparing the simulation and test results. The strengthening effect and uniformity of residual stress and strain after large-area LSP was studied, and an indicator to evaluate the degree of strain uniformity was proposed.
Establishment of LSP FE model
LSP is a process of high pressure shock wave generation and dynamic response of materials to shock wave. Therefore, the establishment of LSP FE model consists of two parts: The establishment of the shock wave pressure model; and the establishment of the dynamic response model of the target material, as shown in Figure 1.
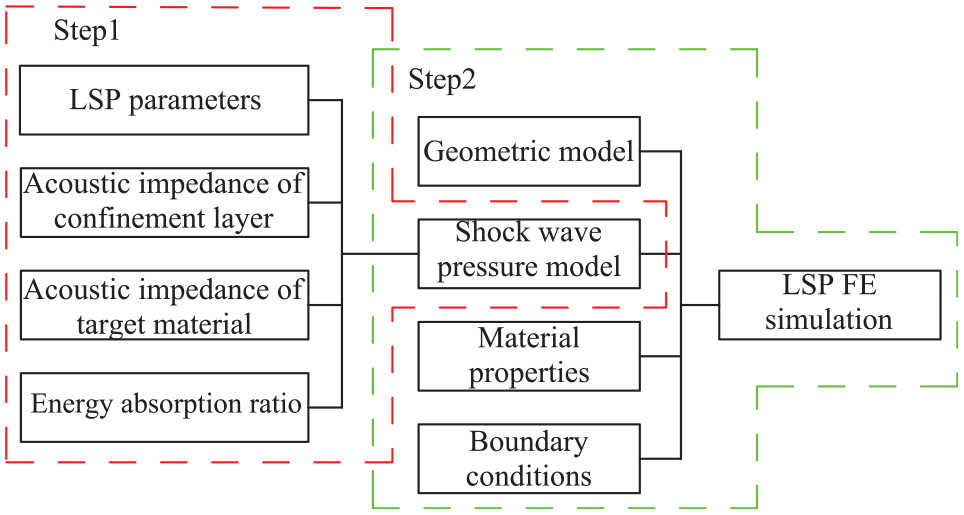
Establishment of LSP FE model.
Spatial and temporal distribution models of shock wave pressure
Zhang et al.
13
found that the laser-induced shock wave pressure is uniformly Gaussian in space, and the radius of the light intensity falling to I0/e2 is equivalent to
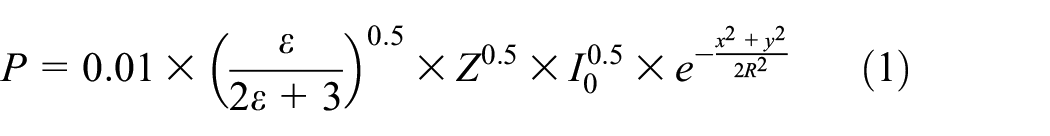
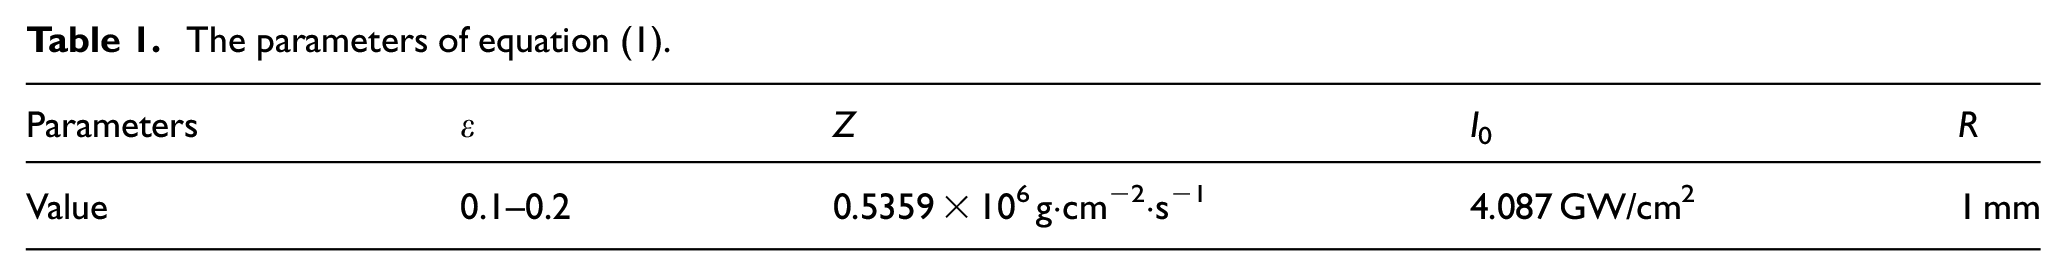
where ε is the energy conversion coefficient (ε = 0.1–0.2); Z is the folded acoustic impedance of the target material and the confinement layer, I0 is the laser power density, and R is the spot radius. According to the LSP system and specimen used in this study, the parameters of equation (1) are shown in Table 1.
The parameters of equation (1).
Based on Berthe’s
15
measurement results of the peak pressure-time curve during aluminum alloy LSP. The shock wave pressure-time curve is divided into two parts, boost and buck (i.e. zone I and zone II), as shown in Figure 2. The two-part curve was fitted by using the Origin curve fitting function. The boosting phase is fitted by a cubic polynomial. The standard form is P = A + Bt + Ct2 + Dt3. By fitting the Origin curve, P(t) = 0.00316 + 0.39576t – 0.02492t2 – 0.00303t3 was obtained. The depressurization phase is fitted by a Gaussian curve. The standard form is

LSP shock waveform.
Material model
The deformation of the target material during the LSP is cold deformation due to the insulating effect of the ablative layer. Besides, the strain rate of the shocked material may higher than 106s−1, which causes the inertial force of the material to be non-negligible. The mechanical properties only related to the strain rate for cold deformation. The ideal elastoplastic model was used in this paper. When the shock wave pressure is greater than the Hugoniot elastic limit (σHEL) of the material, plastic strain occurs. The dynamic yield strength of the materials is given as 16 :
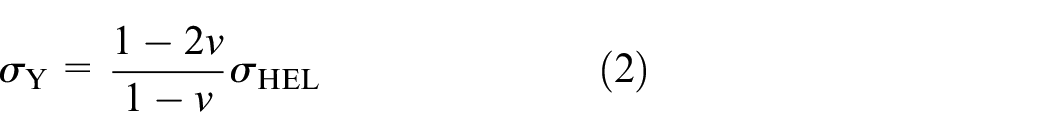
where v is the Poisson’s ratio of the 7075-T6 aluminum alloy.
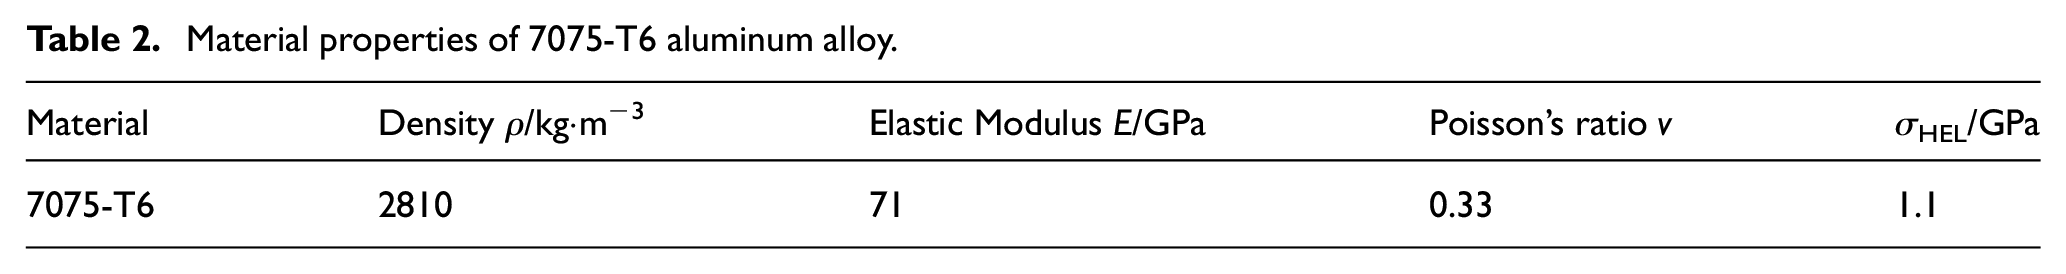
The properties of 7075-T6 aluminum alloy are shown in Table 2.
Material properties of 7075-T6 aluminum alloy.
Finite element model dimensions, meshing and boundary conditions
The thickness of 7075-T6 aluminum alloy sheets is 3 mm, and the size of the model established in the finite element analysis was 9.2 mm × 9.2 mm × 3 mm. The fixed constraint was set on the bottom surface during LSP. The elements type was C3D8R. In order to obtain accurate FE simulation results, the mesh of the shocked region was refined. Since the depth of the LSP strengthened layer could reach 1 mm, the refined meshing (the meshes size is 0.06 mm) was carried out in the portion that is less than 2 mm from the upper surface. The sparse mesh (the range of meshes size is from 0.06 mm to 0.3 mm) was used for the non-critical portion. The gradient mesh was used between the LSP area and the edge of the model. The mesh size gradually increases from the LSP area to the edge of the model, as shown in Figure 3.

The (a) geometric model, (b) meshing model, and (c) the enlarged view of the red area of the meshing model.
Experimental and simulation conditions
The experiments were conducted on the LSP system consisting of Q-switched Nd: YAG laser, laser guide arm, AR6520 four-axis robot and optical platform, as shown in Figure 4. The Q-switched Nd: YAG laser outputs a pulse laser with a wavelength of 1064 nm. The maximum energy of the pulsed laser is 1.6 J, the spot diameter is 2 mm, and the spot positioning accuracy is ±0.025 mm.

The (a) LSP system and (b) the component device of LSP system.
The minimum shock pressure is located at the edge of the spot during LSP. To ensure that the material in the spot area is plastic deformed, the shock wave pressure at the edge should be larger than the material’s Hugoniot elastic limit. According to Table 2 and equation (1), the laser energy E range of the test and simulation is 0.77J≤E≤1.6J.
The laser spots were arranged in a square array and shocked successively, as shown in Figure 5. The spots overlap each other, which could be evaluated by the overlap ratio. The calculation formula of the overlap ratio was given in equation (3).

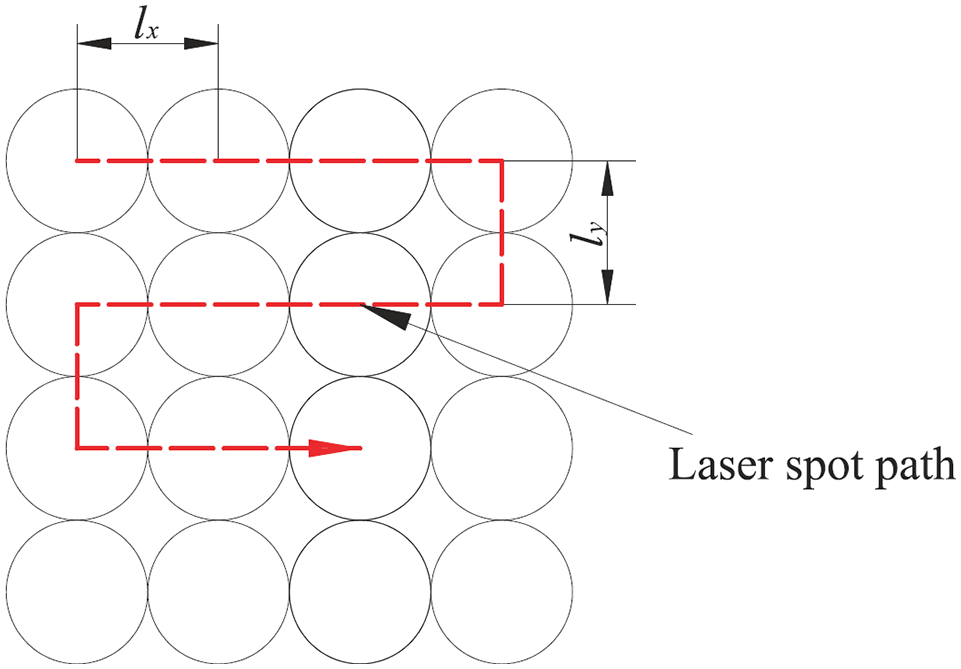
Diagram of spot array and shock path.
Verification of LSP FE model
The specimen shown in Figure 6 was used to verify the reliability of the finite element analysis model. The upper surface of the specimen is a complex surface composed of two planes, a convex arc surface, a concave arc surface, a sloped surface, etc. For models with complex surface shapes, the meshes were more complex, so the verification results are more convincing.

The (a) specimen and (b) geometric model used to verify the reliability of the model.
The parameters used in the simulation and test were as follows: the shock wave peak pressure p = 2.62 GPa, the spot diameter d = 2 mm, the laser pulse width τ = 10 ns, the shock times for every spot t = 1, and the overlap ratio η = 50%.
The stress introduced by LSP was analyzed by X-ray diffraction. This method is a non-destructive testing method, and it was carried out on a Proto-LXRD X-ray stress analyzer (as shown in Figure 7).

Proto-LXRD X-ray stress analyzer.
The stress obtained by the test is the average value in a small area. Keller et al. 17 proposed that when comparing the experimental stress value with the simulated stress value, the simulated value should also be the average value of a certain range and propose a residual stress averaging method. In this paper, the stress in the range of 1 mm near the model point was averaged. And the average stress values were compared with the experimental value.
Figure 8 shows positions of the measurement points, which are on the symmetry line of the upper surface. The residual stress at points B to J was analyzed, and the experimental and simulation results are shown in Figure 9.

Schematic of measuring points.

Comparison of simulation results with experimental results.
Figure 9 shows that the maximum relative error between the simulation results without stress averaging and the experimental result was 9.55%, and the average relative error was 5.65%. The maximum relative error between the simulation results with stress averaging and the experimental result was 10.76%, and the average relative error was 5.32%. The simulation results are in good agreement with the experimental results. Therefore, the FE simulation results of residual stress distribution have high reliability.
The deformation of the FE model is another aspect that needs to be verified. The Z-direction deformation after LSP was measured. The experimental and simulation results are shown in Figure 10. According to Figure 10, the FE model can accurately reflect the deformation after LSP.

Z-direction deformation comparison of simulation and measured results.
Results and discussion
Severe local deformation occurred under the impact of shock wave induced by LSP. The microstructure of 7075 aluminum alloy specimen changed during the dynamic response of the material to the shock wave. A residual compressive stress layer was also formed in the surface of the 7075 aluminum alloy specimen. The evolution of microstructure, the state of residual stress and the uniformity of deformation all reflect the strengthening effect of LSP on the aviation material 7075 aluminum alloy.
OM observation of microstructure after LSP
Figure 11 shows the microstructure of the specimen without LSP. Figure 12 shows the microstructure of the specimen after LSP. The black particles in the metallographic are the crystalline phase which is the product of the corrosion of the second phase. 18 The microstructure of the surface layer on the original specimen (without LSP) was mainly long strip grain, which was a common grain shape of rolled blank. The average grain size in both directions was about 100 μm and 33 μm. The grains in the deformation region of the specimen were refined after laser shot peening, and the sizes are similar in both directions. The average grain size is about 27 μm. Because of the stacking fault energy (SFC) of 7075-T6 aluminum alloy, the dislocation cross slips easily. 19 Under high strain rate deformation induced by LSP, dislocation accumulates to form subgrain boundaries, thus refining grains.

Microstructure of the specimen without LSP.
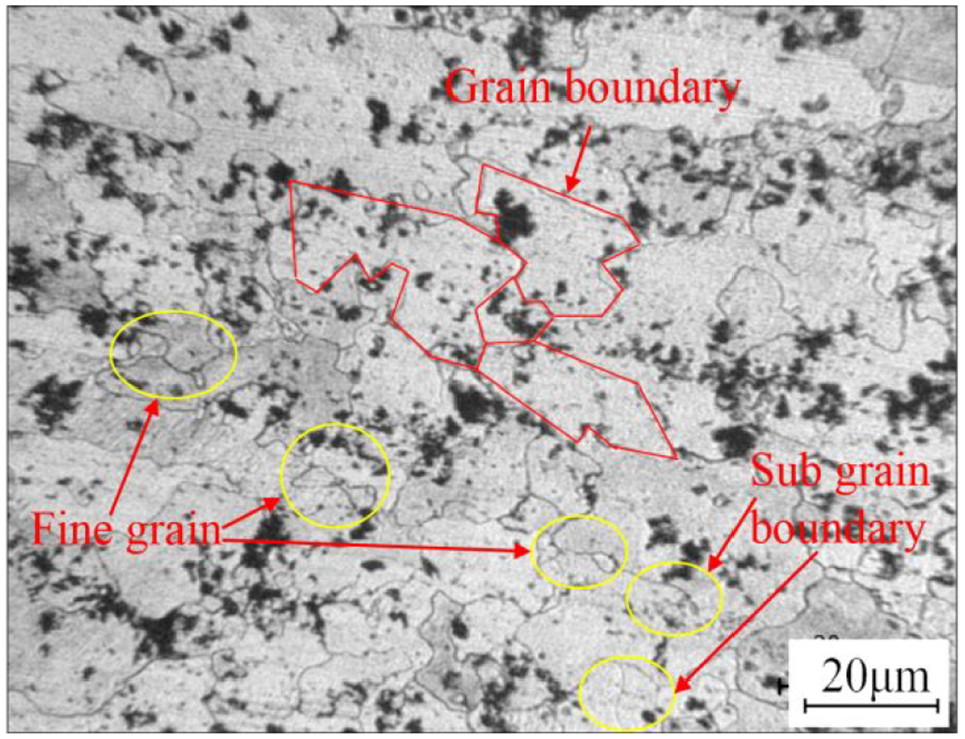
Microstructure of the specimen after LSP.
According to the Hall-Petch relation, 20 grain refinement was one of the main method to improve the mechanical performance, especially strength. 21 Figure 13 shows the relationship between the shock times and the average grain size. It can be seen from Figure 13 that the grain size decreases with the increase of shock times. This is because multi times LSP make dislocations accumulate further, which promotes the formation of grain boundaries. With the increase of shock times, the microhardness of the material surface increases, as show in Figure 14. After five times shocking, the microhardness was 205.4 HV. Compared with the original material, the microhardness increased by 19.9%. In addition, a large number of literatures show that grain refinement can also improve the material fatigue.22–24
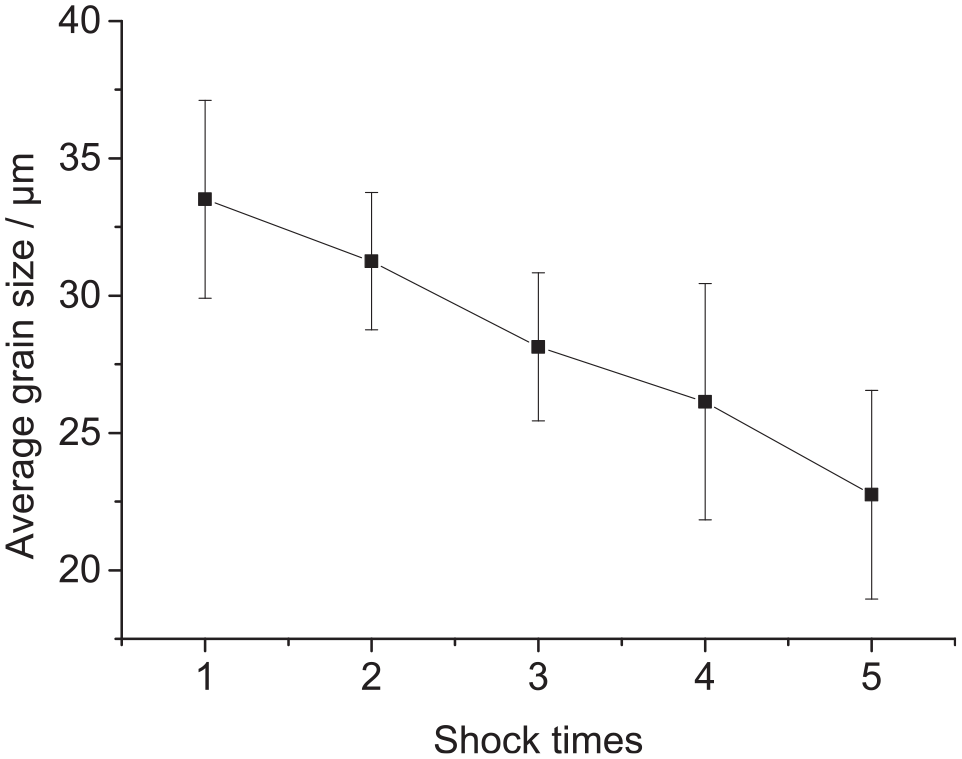
Average grain size after LSP.

Relationship between the shock times and the microhardness.
Simulation study of stress distribution after LSP
Figure 15 shows the five kinds of spot arrays and the corresponding distribution of residual stress σx after LSP were shown in Figure 16). For the array with lower overlap ratio such as 4 × 4 array and 5 × 5 array, there is a large stress at the position where the spot was overlapped. For the array with higher overlap ratio such as 6 × 6 array, 7 × 7 array and 8 × 8 array, the positions in the peened zone are subjected to multiple shocks, so the stress distribution does not show a grid shape. According to Figure 16, the stress distribution of A-A cross section is relatively similar. As the overlap ratio increases, the thickness of the residual compressive stress layer increases.
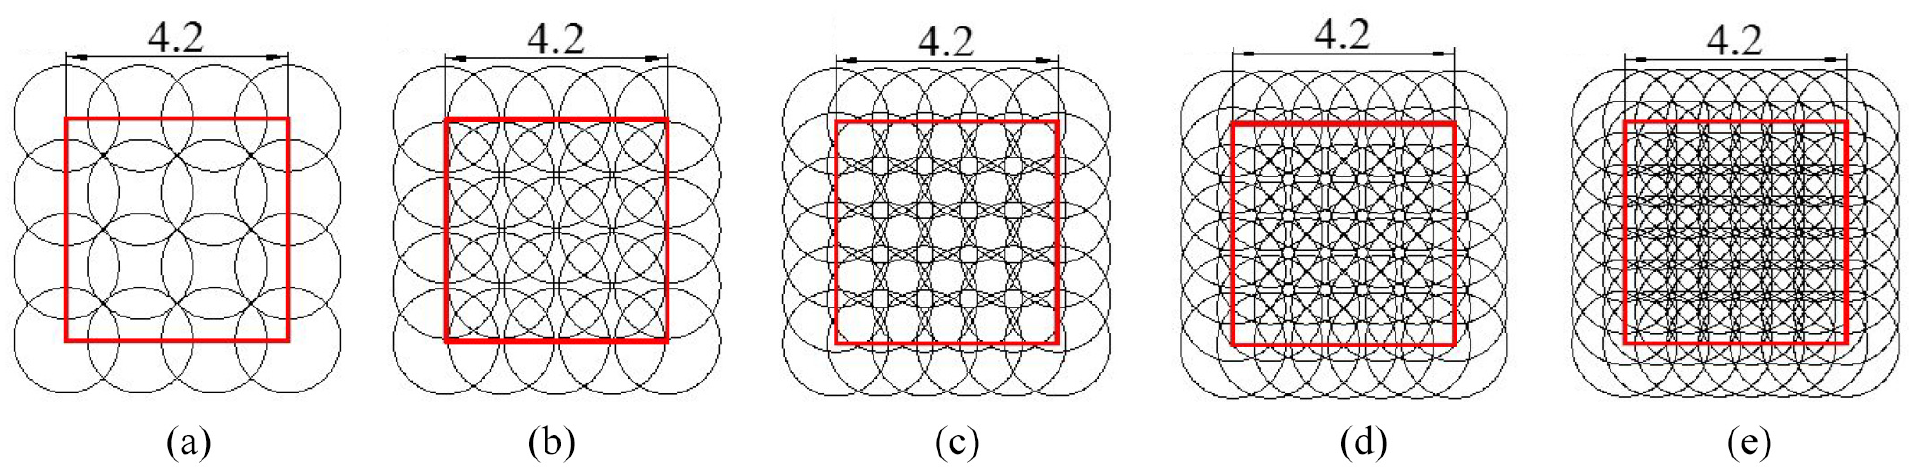
Diagram of spot array (a) 4 × 4, (b) 5 × 5, (c) 6 × 6, (d) 7 × 7 and (e) 8 × 8.

Stress distribution of (a) 4 × 4 spot array, (b) 5 × 5 spot array, (c) 6 × 6 spot array, (d) 7 × 7 spot array, and (e) 8 × 8 spot array.
Figure 17 shows the location of Path 1 and Path 2. Figure 18 shows the residual stress curves along Path 1 and Path 2. Path 1 crosses the laser spot lap region, and Path 2 crosses the center of a row of laser spots. The residual stress σx of the lapped area was greater than that of the un-lapped area. Path 1 passes through points A, B, and C, which are located at the edges of the four adjacent spots. The shock wave pressure at the edge of the spot is smaller than that at the center of the spot, so the stress decreases at points A, B, and C. Path 2 passes through three areas where the spots overlap, and the stress values in these areas are relatively large. Figure 19 shows the residual stress σx along the depth after LSP with 4 × 4 spot array. The surface layer of the specimen is dominated by residual compressive stress, and the thickness of the residual compressive stress layer is about 0.5 mm. The maximum residual tensile stress inside the specimen is about 27.9 MPa.

Location of Path 1 and Path 2.
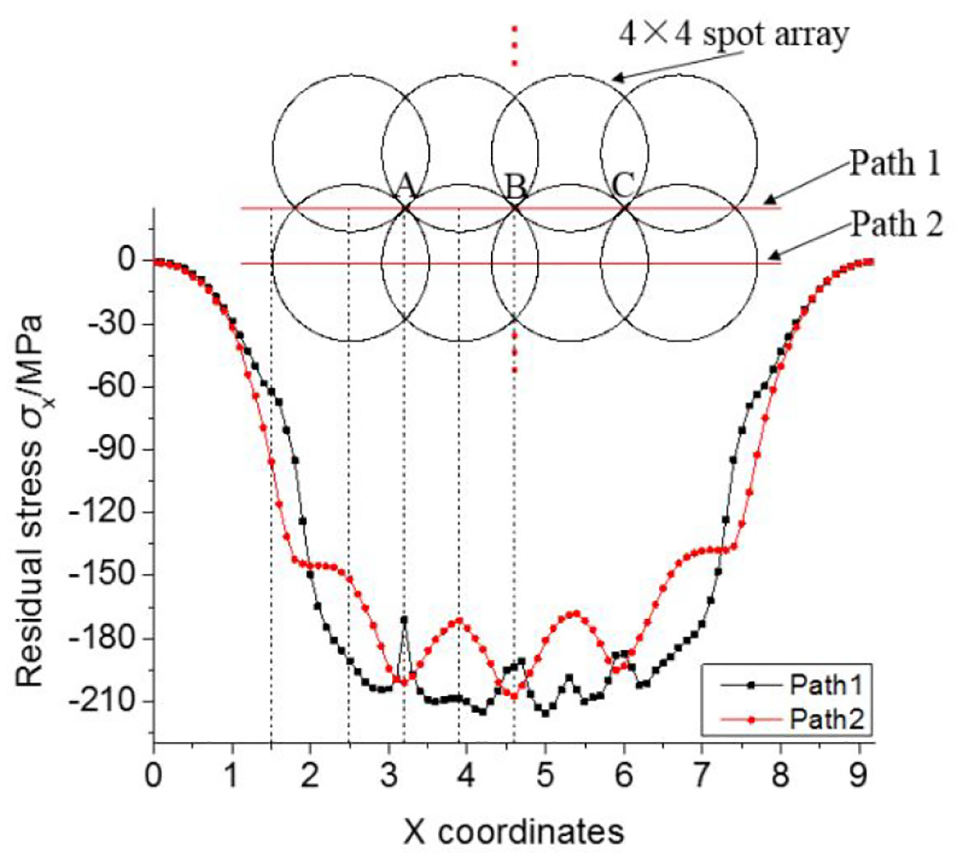
Stress distribution along Path.

Stress distribution along depth.
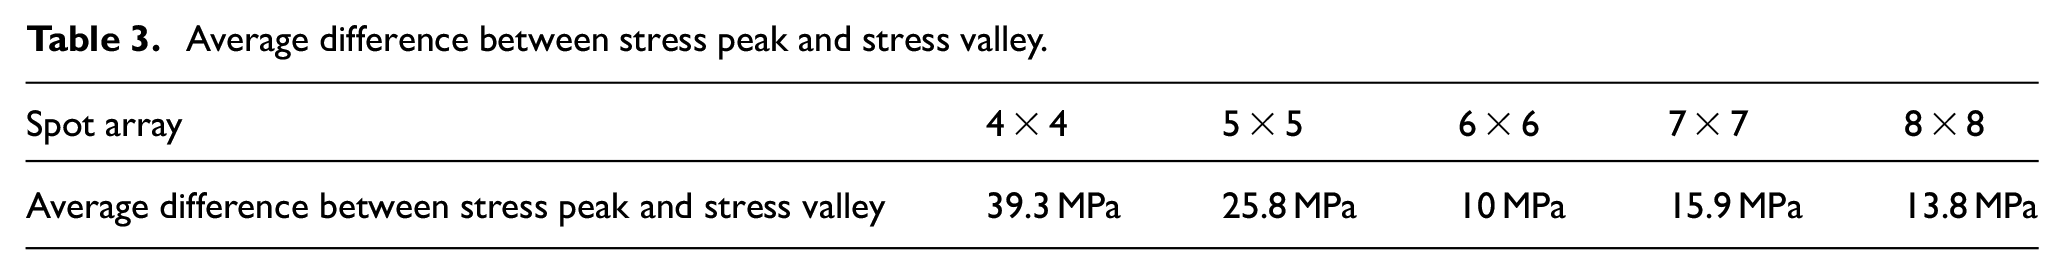
It can be seen from Figure 18 that the distribution of residual stress on the upper surface is uneven. There are obvious stress peaks and valleys in the distribution curve of residual stress. This is similar to the stress gradient mentioned in the study of Hfaiedh et al. 7 Reference surface roughness concept, the difference between each stress peak and stress valley was counted and the average difference was obtained to reflect the uniformity of residual stress distribution, as shown in Table 3. It can be seen from the Table 3 that the average difference of 6 × 6 spot array is the smallest, which indicates that the residual stress is most uniform among those spot array.
Average difference between stress peak and stress valley.
Equivalent strain distribution after LSP
The equivalent strain simulation results were given in Figure 20. For the 4 × 4 spot array, there are nine positions inside the shocked region with large equivalent strain values, which were shown as nine fine peaks on the 3D nephogram. The equivalent strain nephogram was a boss with protrusions for a 5 × 5 spot array. For 6 × 6, 7 × 7 and 8 × 8 spot arrays, the equivalent strain nephogram is that a boss with a large number of small protrusions.

Equivalent strain distribution of (a) 4 × 4 spot array, (b) 5 × 5 spot array, (c) 6 × 6 spot array, (d) 7 × 7 spot array, and (e) 8 × 8 spot array.
Taking the average equivalent strain as the data point, the maximum equivalent strain as the upper limit of error and the minimum equivalent strain as the lower limit of error, the average equivalent strain curve was obtained, as shown in Figure 21.

Average strain curve under different spot arrays.
The average equivalent strain increases with the increase of overlap ratio. For the cases of 4 × 4, 7 × 7 and 8 × 8 spot arrays, the error range was large, while the error range of 5 × 5 and 6 × 6 spot array were relatively small, which shows that the equivalence uniformity of 5 × 5 and 6 × 6 spot array is better.
The equivalent strain nephogram was divided into pixels (as shown in Figure 22, a partial enlarged of the nephogram, and the small cells were pixels). Counting the area of each color of the nephogram. And since the different colors of the nephogram correspond to different equivalent strains, the area ratio of the equivalent strain can be obtained by counting the area ratio of each color. The statistical results are shown in Figure 23.

Nephogram and the partial enlarged of the nephogram.

Equivalent strain statistical results of (a) 4 × 4 spot array, (b) 5 × 5 spot array, (c) 6 × 6 spot array, (d) 7 × 7 spot array, and (e) 8 × 8 spot array.
The deformation of the surface has an effect on fatigue life. In general, a large surface roughness (corresponding to uneven deformation) tends to cause stress concentration. Therefore, it is expected that the deformation of the shocked region after LSP is as uniform as possible. The U was proposed in this paper to evaluate the equivalent strain uniformity of the shocked region:

where,
When the overall deformation tends to be uniform, the equivalent strain in the deformation area is more concentrated in the average equivalent strain. In this case, the U value would be small. If the equivalent strains of all positions are equal, then the U takes the minimum value of zero. Therefore, the value of U can be used to evaluate the uniformity of the equivalent strain. The smaller the U value, the more uniform the equivalent strain.
The U values of five kinds of spot array were calculated based on Figure 23 and equation (4), and as shown in Table 4.
U values corresponding to different spot arrays.

It can be seen from Table 4 that the U value is the smallest for 6 × 6 spot array. This indicates that the deformation is the most uniform for 6 × 6 spot array. In the case of 4 × 4 and 7 × 7 spot array, the U value is larger, mainly because there was a position between the spots that was shocked multiple times and had a large equivalent strain (as the red region shown in Figure 24). This causes a fine peak in the equivalent strain distribution nephogram.
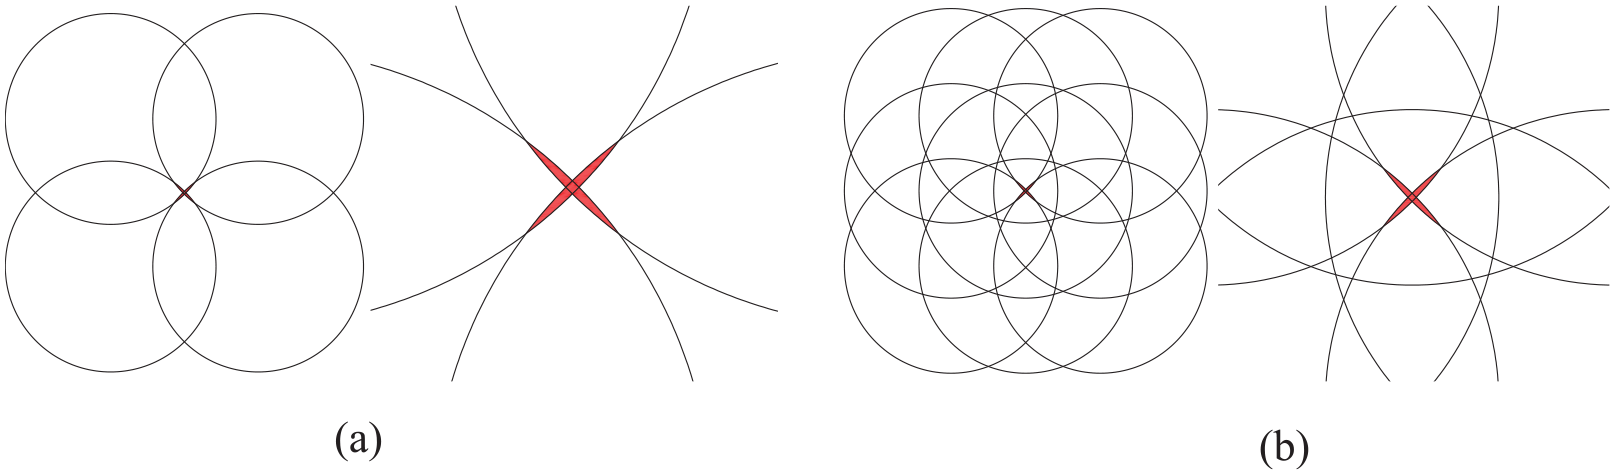
(a) 4 × 4 and (b) 7 × 7 spot array and its partial enlargement.
Conclusions
In the present work, the strengthening indexes such as average grain size, residual stress distribution and deformation uniformity of 7075-T6 aviation aluminum alloy after laser shock peening were investigated by experiment and simulation. The main conclusions can be obtained as follows.
After laser shock peening with energy of 1.6 J and spot diameter of 2 mm, the average grain size of 7075 aluminum alloy specimen decreased from 100 μm to 33 μm. With the increase of shock times, the average grain size will be further refined to 23 μm. Under the effect of work hardening and grain refinement, the microhardness of the surface material is improved. After five times of laser shock peening, the microhardness of the specimen surface reached 205.4, which increased by 19.9% compared with the original material.
A residual compressive stress layer with a thickness of about 0.5 mm on the surface of 7075 aviation aluminum alloy formed after laser shock peening. The distribution of residual stress on the surface is not uniform. The maximum average difference between the residual stress peak and the residual stress valley is 39.3 MPa. With the increase of overlap ratio, the average stress difference decreases first and then increases. When the laser spot array is 6 × 6 (the corresponding overlap ratio is 58%), the average stress difference decreases to 10 MPa.
An strain uniformity index U was proposed, and the minimum value as obtained under laser shock peening with 6 × 6 spot array of which the corresponding overlap ratio was 58%. This means that in laser shock peening, overlap ratio of 58% was an optional parameters to obtain the uniform deformation.
Footnotes
Handling Editor: James Baldwin
Declaration of conflicting interests
The author(s) declared no potential conflicts of interest with respect to the research, authorship, and/or publication of this article.
Funding
The author(s) disclosed receipt of the following financial support for the research, authorship, and/or publication of this article: The authors are grateful for the financial support provided by the National Natural Science Foundation of China (NSFC) (No. 51575117 and 61179051).