
Abstract
Over the last decades, the deployment of large solar-based photovoltaic power plants has grown tremendously. The undesirable impact of high integration level of photovoltaic systems has led energy stakeholders to regulate such penetration to avoid this negative impact. One major concern with regard to photovoltaic penetration is the issue of power quality. Poor power quality can be a source of system disturbance and major economic losses. However, the power quality analysis is not widely discussed in the literature, with most of the studies focusing on the harmonic issues as potential power quality problem, but this study shows that there are a number of power quality issues, such as undervoltage, overvoltage, power fluctuation, and power factor. This study presents practical approaches to a grid-connected solar photovoltaic plant with associated control circuits developed in the time-domain. The power quality of a grid-connected solar photovoltaic plant is investigated by an analysis of the inverter output voltage and nominal current for different photovoltaic plant sizes. Also, the effect of different conditions of solar irradiance and ambient temperature on the power quality is analyzed. To identify power quality issues, a photovoltaic plant time-domain model is developed using Power Systems Computer Aided Design software. Various solar photovoltaic plant controls such as maximum power point tracking and modulation signals sinusoidal pulse width modulation and pulse width modulation for direct current-to-direct current boost converter are developed and integrated into the simulation environment. Several case studies are performed taking into account different photovoltaic plant ratings such as 250 kW–3 MW, where the point of common coupling is monitored.
Introduction
The recent decade has seen a significant increase in the number of solar photovoltaic (PV) installations worldwide. 1 Power quality is currently a major concern in the integration of full converter-based renewable energy resources. A weak connection of large solar PV-based generation in a power system may cause power quality issues that could lead to disturbances and economic losses. The Saudi Arabia National Renewable Energy Program is currently setting out a targeted road map to quickly branch out the national power generation, stimulate economic growth, and support long-term growth in line with the 2030 vision of an innovative renewable industry. 2 Studies have been carried out to discuss power quality issues related to grid-tied PV plants. Extensive studies have been presented to address PV-tied grid. David G Infield et al. 3 reported on a study of a number of inverters linked to the grid from a comprehensive power quality perspective. The measurements were generated into low-voltage (LV) network by taking individual single-phase inverters under a specific limit of effective conditions and for several converters similarity tied at the same point on the grid. The result was centered around characterized current harmonics, power factor (pf), and injection of direct current. Therefore, due to the similar phases, it has been shown that lower order harmonics reduces cancelation. Here, we propose a method for calculating the acceptable penetration level of residential grid-connected PV inverter system installations based on voltage total harmonic distortion (VTHD) and individual harmonic voltage limits recommended in the relevant Australian harmonic standards published by AA Latheef et al., 4 and also show the possibilities of having a reduced inverter current harmonic magnitude. The impact of using common distributor types was studied to understand the variation of acceptable penetration levels for grid-connected PV inverter systems. A typical LV distribution system consisting of a medium voltage (MV)/LV distribution transformer and two LV distribution feeders has been investigated. The results are based on the inclusion of significant contributions from background distortion from both upstream and LV distributor distorting loads. MC Benhabib et al. 5 focused on the impact related to the output of the current harmonic from the LV PV systems network. The simulation modeling was for a neighborhood capacity of 96 houses in the Netherlands. The simulation result was used to discuss the consequences of currents harmonic generated by the PV network. From the results, there was increase in current THD with the non-linear loads, and this was in the extreme with resistor–capacitor (RC) loads found mostly in electronics. Ahmed S Khalifa and Ehab F El-Saadany 6 proposed a control open loop of maximum power point tracking (MPPT) technique to quickly reach the maximum power point (MPP) of the PV array under varying temperature and irradiation. The results proved the leverage of the proposed control methodology for PV-tied grid. Junbiao Han et al., 7 studied the power quality by focusing on harmonics, voltage drop, and transient voltage for the PV three-phase system. Therefore, the study proposed a control method using STATCOM. The simulation results show the success of the proposed methods tested using PSCAD/EMTDC software. Xiangyang Zhao and Shiyang Liu 8 conducted a research on the effect of current harmonics–connected inverter of the PV-tied single-grid system. Their research focused on the following factors, including temperature, irradiance, inverter’s control technique, the three-phase imbalance on-grid and voltage harmonics. From the result, the irradiance is the most effective factor on the output harmonic, the inverter control technique, space vector pulse width modulation (SVPWM), has more effect on harmonics than the inverter control technique, sinusoidal pulse width modulation (SPWM). Abdulrahman Kalbat 9 justified with graphs, the effect of varying temperature and irradiation on the PV system. The study compared and analyzed THD on the output from the inverter at standard test condition with Institute of Electrical and Electronics Engineers (IEEE) standard. Annapoorna Chidurala et al., 10 analyzed varying irradiance with the harmonic generated from PV inverters. The simulation results in low generations of PV system for a fundamental current showed significant increase in the current THD values. On the contrary, these PV inverters harmonic output can adversely affect the distribution network. Various authors proposed a control method to minimize the harmonic level from PV inverter. The results show that the THD when effectively compensated with acceptable levels, measure up to the standards. Rinchin W Mosobi et al., 11 characterized power quality by STATCOM compensation to improve and maintain the voltage and current. From the results, under load conditions, the system voltage was well regulated and critically reduced the harmonic effect of the system currents and voltages. Ken Weng Kow et al. 12 found that the PV system has many power quality issues, such as power fluctuation, inrush current, harmonic distortion, frequency fluctuation, and low pf. SA Lakshmanan et al. 13 proved that the capacitor split current-controlled on proportional–integral (PI) regulator improved the bandwidth, reduced the steady-state error, and phase margin. Otherwise, based on the fundamental frequency on proportional resonant (PR) controller, there is good loop gain, feedback control, improved bandwidth, and reduced THD. P Akash Pattanaik et al., 14 addressed the incremental conductance algorithm and used it to lock the inverter phase and frequency with the grid. Consequently, the line-to-line power matches the inverter output with the grid in all cases. Annapoorna Chidurala et al. 15 analyzed the harmonic characteristics output from PV grid-connected system with irradiance; they highlighted the individual output harmonic distortion and their relationship with PV inverters in two case studies. From the results, the current THD increased with decreasing power levels, and the harmonic levels were minimized in case of several PV integrations due to harmonic superimposition harmonic. Chao Xiong et al. 16 demonstrated the reduction in power quality due to net current distortion injected into the grid. The output current inverter waveform control is therefore hazardous. The results show that the proposed control method achieved amazing results and the proposed strategy is proved, which can effectively overcome the effect on current harmonic tied grid. The simulation studies published by Ganesh Baliram Ingale et al. 17 showed the output characteristics of the module and array concerning an uncertain change in weather conditions. The system includes a direct current-to-direct current (DC–DC) converter to adjust the output voltage of the system. AL Amoo et al., 18 investigated the harmonic distortions in both current and voltage, that may have been initiated in the distributed PV-embedded generations in a Nigerian 200-kW power system. The purpose of the study is to show the impact of harmonic’s series reactor justifying technique. The result of this study reduces the harmonic by 5% (Figure 1).

Solar PV global capacity. 1
This article investigates the effect of harmonic distortion with the following size variations as case studies (0.25, 0.5, 0.75, 1, 2, and 3 MW), consisting of PV array, DC link capacitor, DC–DC boost converter, direct current-to-alternative current (DC−AC) three-phase inverter, and grid connection with controller techniques by characterizing current harmonics distortion and voltage harmonics distortion conducted according to the boundaries of IEEE Standers 519-1992. To operate the grid-tied PV plants within an acceptable level of power quality, the following two standard approaches are necessary to check for harmonic content:
International Electrotechnical Commission (IEC) Regulation Approach: In this approach, the signal harmonics are limited one by one, and this is for each load. Although this approach is theoretically important, it is not yet realistic.
A more effective IEEE approach described by IEEE Std 929-2000: 19 This is due to the forced restraint on current and voltage harmonics. In addition, this ensures that the operation of solar PV plants is compatible with different voltage levels at (PCC) in line with the limits defined by IEEE Std 519-1992 20 and distortion limits, respectively. At rated inverter output and with 60 Hz, the tolerable maximum percentage of the THD is defined by the limit range of 3%–5%. 21
As defined by IEEE, Table 1 19 presents the voltage distortion limits and Table 2 presents the current distortion, with its harmonic levels recognized depending on the number of pulses. The current THD maximum tolerable percentage of THD is 5% and 3% for any harmonic at the rated inverter output of the fundamental frequency current.
Voltage distortion maximum limit. 13

Limit for current distortions at PCC for three-phase inverters. 13

PCC: point of common coupling.
All the results obtained were under standard test conditions (STC) at the point of common coupling (PCC), which is the point where the PV system relates to the grid. PSCAD/EMTDC software was used because it allows the user to efficiently construct a circuit schematic and control the data in a completely integrated environment. This article investigates the quality of solar PV plant power by analyzing the inverter output voltage and nominal current for different PV plant sizes. In addition, the impact of weather conditions on power quality is investigated. In section “System modeling,” the main blocks of the solar PV system with detail descriptions are presented. The results of the power quality analysis for the solar PV system are presented in section “Simulation results and discussions.”
System modeling
Figure 2 presents the main blocks of the solar PV system model used in this article. Each block is described in the following.

Solar PV main blocks.
Solar PV arrays
One of the major components of any solar PV station are solar arrays. Several solar modules that are electrically connected constitute an array. A solar module consists of several solar PV cells that are connected in parallel or series. If the modules are connected in series, the total array voltage is increased, and the total array current is the same. On the contrary, if they are connected in parallel, the array current is increased while the array voltage is not. Practically, the array voltage is desired to be increased to lower short circuit current. Typical parameters are used to model solar PV module data. Table 3 presents typical values that are used for cell and module configuration parameters.
Solar PV module parameters.
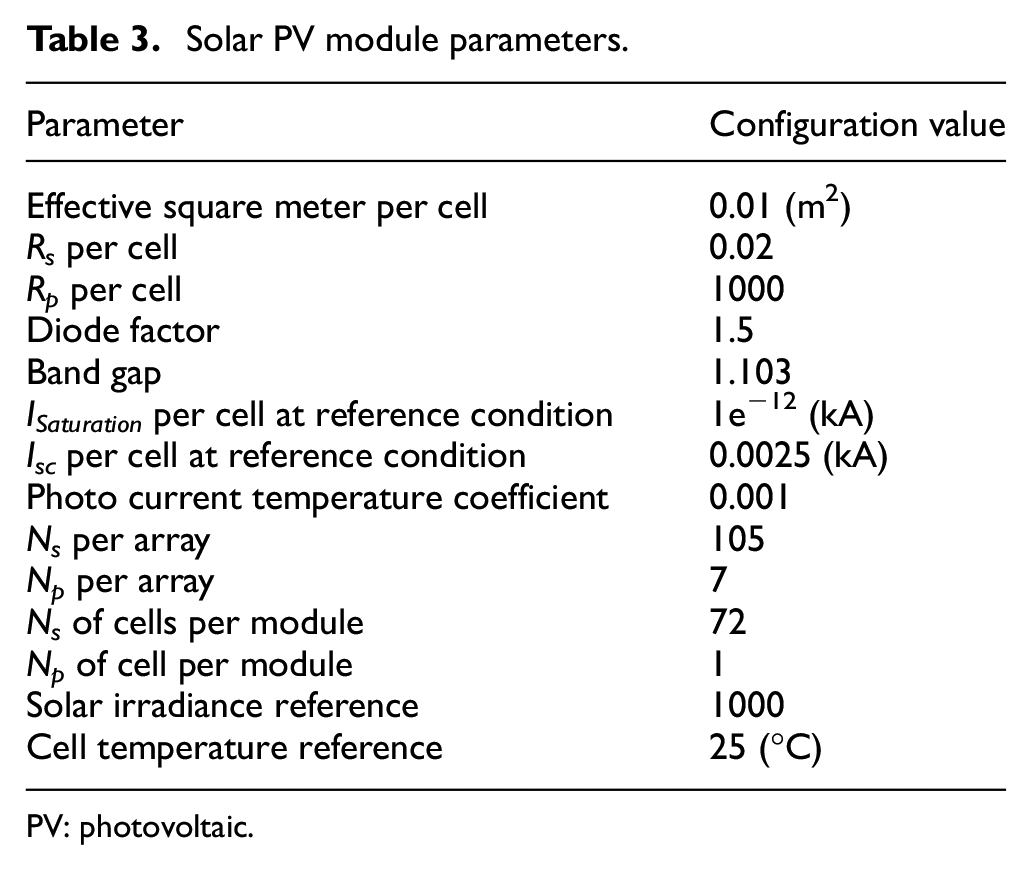
PV: photovoltaic.
DC–DC boost converter and MPPT
The goal of this converter is to provide voltage control at the DC link. This is performed by varying the solar PV output power to achieve the optimum using MPPT control. Particularly, a PI controller is used to derive the solar PV voltage to track a reference voltage. This is performed in the following steps.
MPPT
The goal of the MPPT controller is to find the maximum output power of PV array. MPPT parameters are provided in Table 4. To filter the output voltage (VPV) and current (IPV) of the solar PV from the ripples, a low pass filter is implemented. The gain of this filter is one, with a time constant equal to 0.001 s. Many MPPT algorithms have been proposed in the literature. 22 Due to its simplicity and accuracy, incremental conductance algorithm is implemented. Figure 3 presents the details of the MPPT control flow chart. The MPPT control block as shown in Figure 4 receives the filtered voltage and current signals, and outputs a reference signal (Vref_MPPT). This reference signal is then compared with VPV to produce the duty cycle. Then, this is used in another block for comparison.
MPPT configuration parameters.

MPPT: maximum power point tracking; PV: photovoltaic.

MPPT control block diagrams.

MPPT control block diagrams in PSCAD.
DC–DC converter control
The circuit diagram of a DC–DC boost converter is shown in Figure 5. This type of converter is usually used to increase the input voltage. Depending on a duty cycle, the voltage level will vary to match the PV array maximum power.
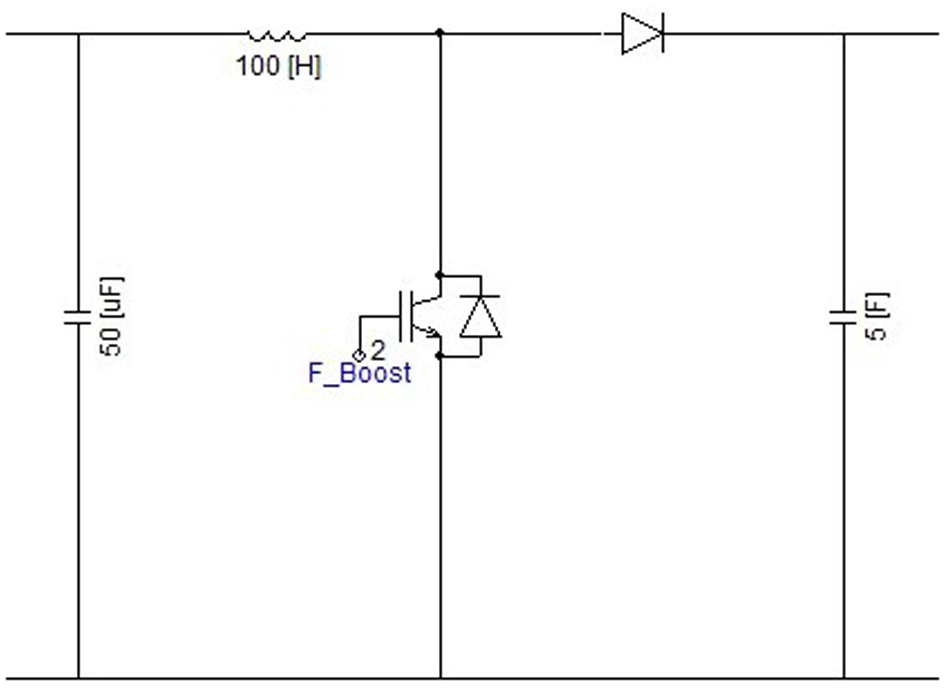
DC–DC boost converter circuit diagram.
The duty cycle (D) is determined by

The inductor is calculated by
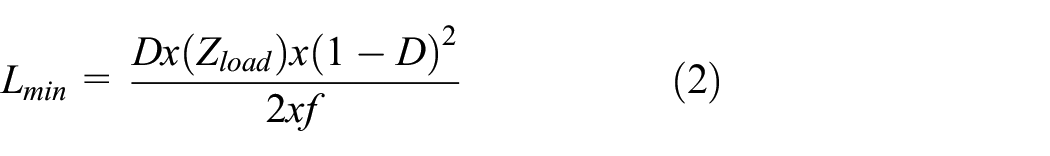
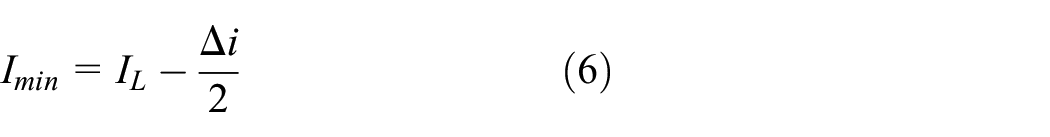
To reduce current ripple, the large value of the inductor is selected. As a result, the output current limit is increased. The equations of minimum current limit (IL), inductor current ripple (Δi), and maximum current limit (Imax) are given below. Note that the current is continuously verified by (Imin > 0)


The capacitor is adjusted by

DC link capacitor
DC link capacitor is an important component of a solar PV system. The DC link is controlled by the boost converter. This capacitor is utilized to smoothen out the ripple in the output power. In McGranaghan, 23 the minimum requirements for a DC link are discussed. If the voltage signal is not smooth, the rate could be increased. Voltage ripple is assumed to be 0.0001% with a capacitance value of 46 µF and DC link capacitor size of 50 mF.
Three-phase six-pulse inverter
The solar PV system is connected to the electrical grid by three-phase inverters. The three-phase six-pulse inverter has switches and diodes for protection purposes. The circuit diagram of the inverter in PSCAD is depicted in Figure 6. Control circuits include active and reactive power and a firing pulse generator.

Three-phase inverter.
Figure 7 shows the SPWM control technique used to generate the six insulated-gate bipolar transistors (IGBTs) switching signals of the inverter. During switching, a sine wave is generated. Then, a firing pulses interpolation approach is implemented to modify the state of signals for three-phase inverters. The firing pulses block is shown in Figure 8. Based on the utility electric signal parameters, inverter generated signal is adopted. This includes frequency, amplitude, and phase angle.

Sinusoidal pulse width modulation.

Inverter firing pulses.
Grid connection
Figure 9 presents the entire simulated system with solar PV plant connection. As shown, the grid is represented by an AC source with 230 kV and 60 Hz. Solar PV arrays, DC–DC boost converter, DC link, and DC−AC grid-tied solar inverter are also shown in Figure 9.

Grid connection.
Simulation results and discussions
The power quality at the PCC of a PV plant is investigated. The investigation is carried out by analyzing the inverter output voltage and nominal current for different PV plant sizes. Figure 10(a) shows the voltage PV array and Figure 10(b) shows the current PV array.

(a) Voltage (VPV) and (b) current (IPV) signals of the PV array.
Figure 11(a) shows the real active power and Figure 11(b) shows the reactive power. Both are measured at the PCC. On the contrary, the root mean square (RMS) voltage at PCC is depicted in Figure 12. At the PCC, the load RMS voltage is increased to 1.2 pu, which is an overvoltage. A controller is used and set to limit the RMS voltage at PCC. This mitigates the overvoltage issue. If electrical appliances operate under this voltage, lighting could be flickered; screens and other sensitive devices could be stopped or damaged.
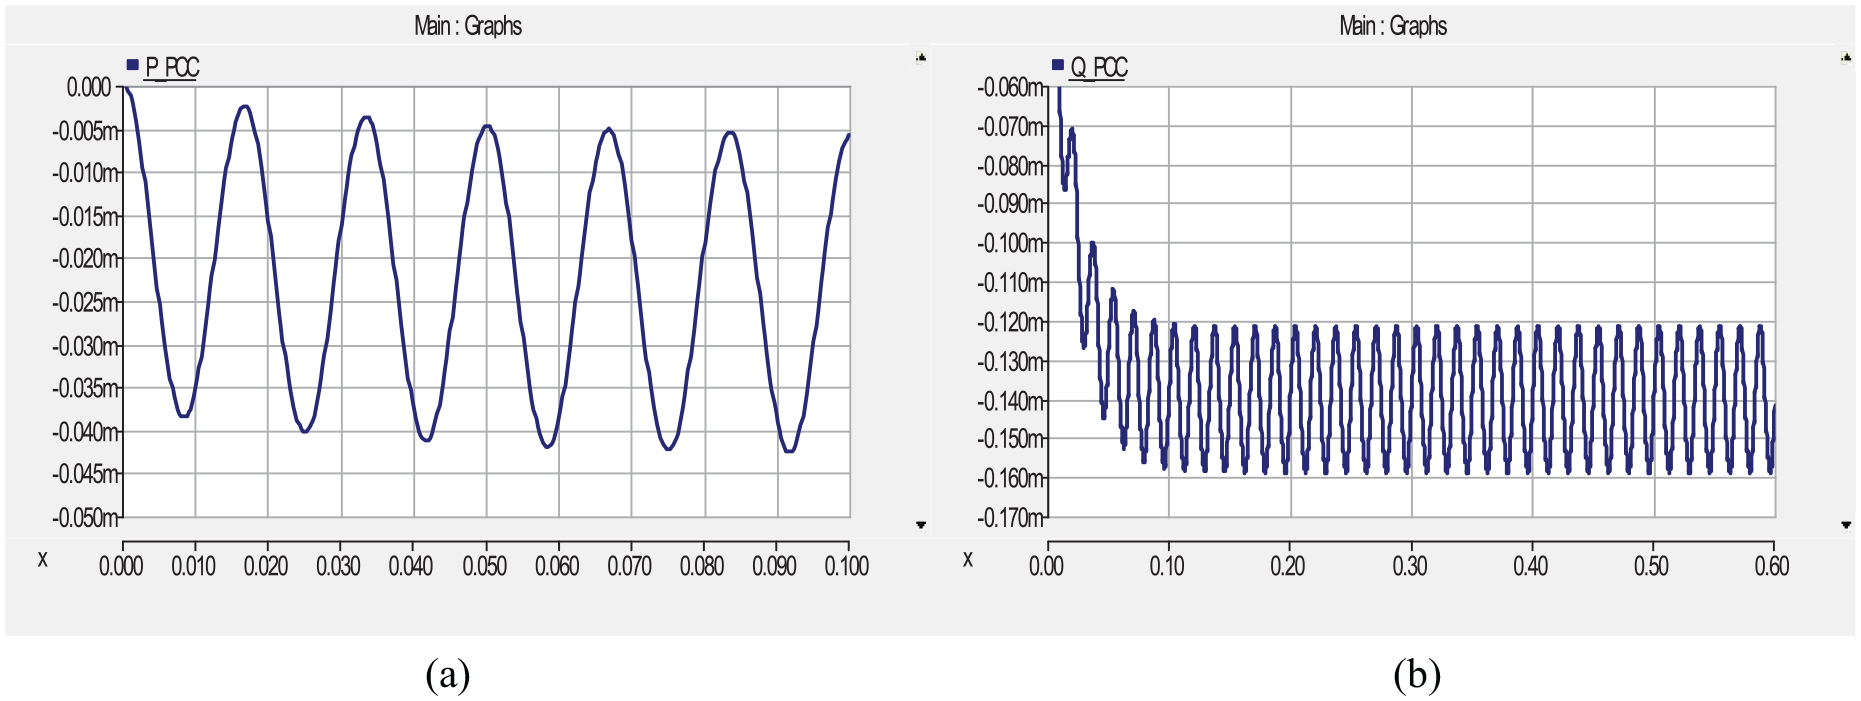
(a) Active real power at PCC and (b) reactive power at PCC.

(a) RMS voltage at PCC and (b) zoomed in RMS voltage.
The solar PV system attempts to supply the load with reactive power when the network is off. However, the load cannot be supplied due to insufficient capacity of generated power. Moreover, when the grid connection is restored, there is fluctuation in the active and reactive powers. This behavior is known as power fluctuating. Consequently, the solar PV becomes incapable of supplying the load when the demand is greater than its capacity.
Figure 13 shows the increased ripple in the DC voltage. Due to the imbalance in the AC voltages, there is a large imbalance in the AC current as shown in Figure 14. The imbalance in current depends on the type of sag. In this case, the type of sag is such that the magnitude of one voltage is much higher than that of the other two voltages. This results in the line currents as shown in Figure 15. One phase current is higher in magnitude than the other two. This is attributed to missing firing pulses in a phase. The DC bus voltage before and during a voltage sag when the inverter is operated at a firing angle of 125.413° is shown in Figure 16. In the phasor diagram, the phasors move away from each other so that the maximum voltage of the inverted voltage is closer. Therefore, the IGBT was fired in time before that time. However, there is a risk for a missing pulse, which would, even more, distort the AC voltage. Due to a small voltage imbalance, the three-phase IGBT inverter experiences a large current imbalance; the largest current in phase with the highest voltage. Therefore, the load has the propensity to alleviate the voltage imbalance. The term “voltage imbalance” is used to describe such a phenomenon as recommended by IEEE. A short circuit with a length of less than 1 ms is formed when there is a commutation from one IGBT and diodes to the other due to a decrease in the output voltage. This is called “voltage notching.” However, notching is produced mainly in the conditions of high-order harmonics. The term “notch” or “line voltage notch” is used by IEEE to generally describe any decrease in voltage that lasts less than half a cycle.

DC bus (a) voltage and (b) current.

(a) Instantaneous voltage at PCC and (b) instantaneous current at PCC.

Measuring current at PCC.
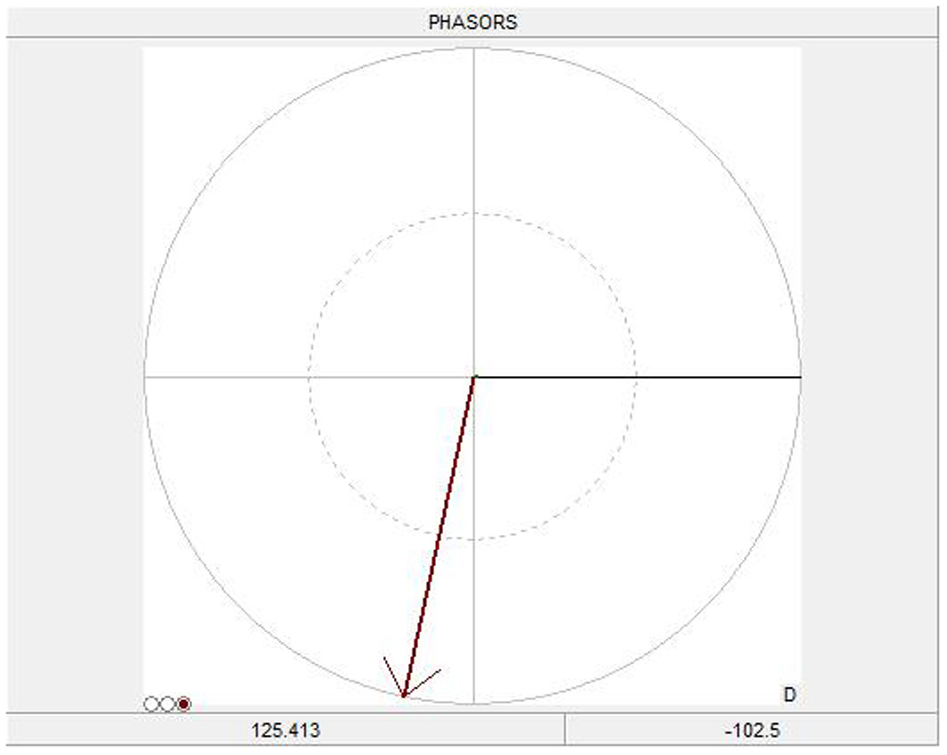
Voltage phasor diagram.
Figure 17 shows the frequency, incremental phase, and phase-locked loop (PLL) at PCC. It shows a stable frequency, which is within the limit. Phase-angle jumps affect the angle at which the IGBT is fired. The firing instant is normally determined from the PLL output, which takes at least several cycles to react to the phase-angle jump. The effect of the phase-angle jump is such that that the voltage shifts compared to the reference. Because of this, the IGBT is fired at a wrong point of the supply-voltage sine wave. This is shown in Figure 16 for a negative phase angle jump. The during-sag voltage lags the pre-sag voltage; thus, the zero-crossing of the actual supply voltage comes later than the zero crossings of the PLL output.
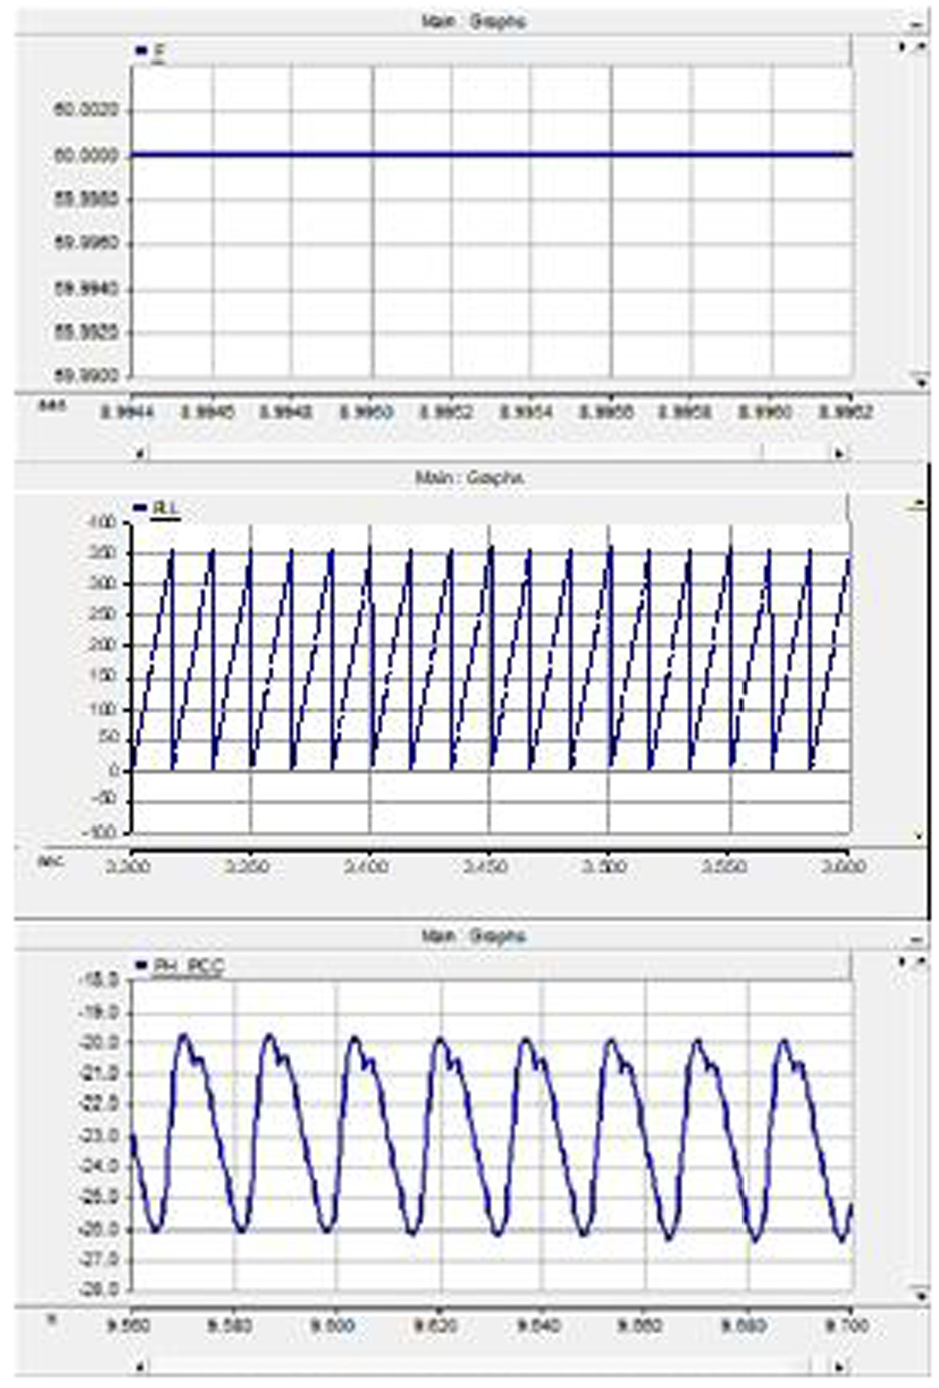
Frequency, incremental phase, and PLL.
Figure 18 shows the apparent power measured at the PCC. The pf at PCC is presented in Figure 19. When a solar PV system is operated with unity pf, it drops to a low value caused by the penetration of the solar PV. As a result, the active power is reduced; but this maintains the grid-supplied reactive power. Although solar PV system can efficiently reduce the demand, the apparent power does not decrease. The pf is maintained as 0.9 after the connection of the PV system and becomes stable. This is attributed to the high level of solar irradiance that occurs during the daytime, which produces more power. On the contrary, the low level of solar irradiance occurs at the beginning and end of the daytime, which produces less power. With the low level of pf, the power utility company must support the network with more power. As a result, this adds more stress on distribution lines.

Appearance power at PCC.

Power factor at PCC.
Fast Fourier Transform is implemented to produce the magnitude of harmonics up to 15th harmonics. These harmonics are generated with the fundamental frequency. It has been observed that the number of harmonics generated is sufficient. According to Table 5, there is no observed direct impact between solar PV plant size and harmonics. This is based on the THD of the data collected at PCC for one phase under standard condition. Also, Table 6 presents the THD values measured at the DC link. Current harmonic decreases with increase in solar PV plant size. As shown in Table 2, current harmonic distortion oscillates less than 5% limit, which is acceptable by the IEEE standard. In addition, voltage THD violates the acceptable harmonic level.
Solar PV module parameters characterization of harmonic distortion at PCC.

PV: photovoltaic; PCC: point of common coupling.
Characterization of harmonic distortion at DC link capacitor.

DC: direct current.
Table 7 shows that the current harmonic in the DC link capacitor increases with increase in the number of PV modules connected in parallel and decreases with decrease in the number of PV module connected in series. The voltage harmonic, however, increases at PCC with increasing number of PV modules connected in parallel and decreases with decreasing number of PV modules connected in series.
Characterization of harmonic distortion of PV array installation at DC link capacitor.

PV: photovoltaic; DC: direct current.
Table 8 shows the impact of the number of modules in series and parallel at PCC by measuring THD in both current and voltage. This is done to determine the most suitable practice to minimize the impact of harmonics at PCC. The result shows that an increasing number of modules in parallel will significantly increase the VTHD at PCC.
Base case characterization of harmonic distortion of PV array installation at PCC.

PV: photovoltaic; PCC: point of common coupling.
Figure 20 shows the voltage harmonic considering different solar irradiance. The analysis is carried out by taking into account the different temperature conditions. It can be observed that there is a high correlation between voltage harmonic and solar irradiance. On the contrary, the relation between current harmonic and solar irradiance at 40 °C is depicted in Figure 21. This figure shows an irregular trend that needs further analysis.
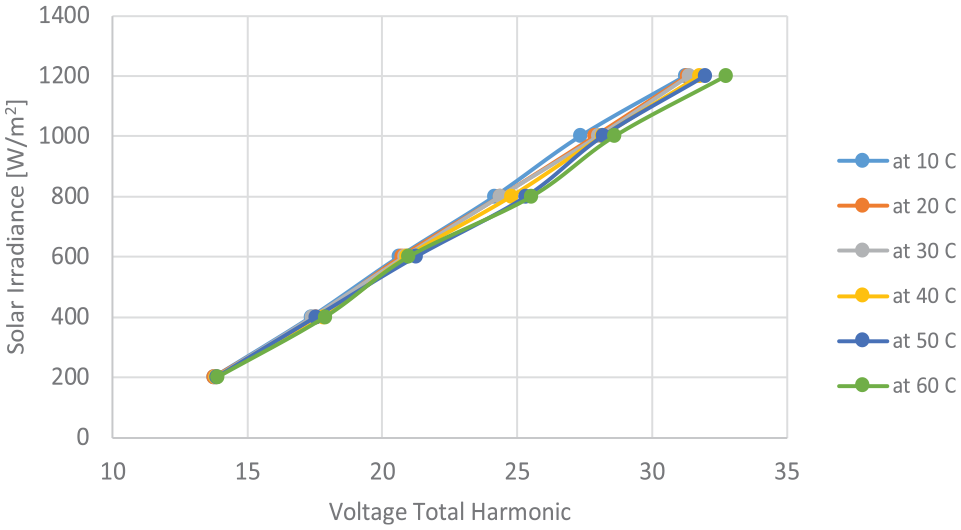
Voltage total harmonic with different temperatures.

Current total harmonic versus solar irradiance at 40 °C.
In Figure 22, ITHD result is shown. It shows that the levels of the harmonics are less than the IEEE standard compared with the data shown in Table 2. Besides, Figure 23 shows that all the voltage harmonic indices do not meet IEEE specified boundaries compared with the data shown in Table 1.

ITHD at phase a for 250 kW solar PV plant.

VTHD at phase a for 250 kW solar PV plant.
However, the power quality analysis is discussed in the literature, with most of the studies focusing on the harmonic issues such as potential power quality problem8–10 but this study shows that there are serious power quality issues different from what is displayed in Han et al. 7 and Kow et al. 12 such as phase angle jump. The side effect of the IGBT is evident by analyzing the power quality from different points such as in PV array, DC–DC converter, DC link capacitor, inverter output, and in the PCC and this is done to investigate the reason behind the phenomenon and its consequences on the PCC. Therefore, we studied the harmonics distortion issues by performing six case studies to determine whether a relationship exist between PV plant rating and the harmonic distortion; we also performed five case studies to determine the impact of the PV array installation at DC link capacitor and on PCC and six case studies to analyze the effect of the voltage harmonics with the solar irradiance under different temperature conditions. The harmonics performed in the dynamics domain were different from Zhao and co-workers8–10 and were the major issue with the current harmonics while in the study the voltage harmonics in dynamics domain showed potential phenomenon.
Conclusion
This work deals with a study on the power quality analysis of a large PV plant, whose effectiveness is evaluated by investigating the inverter output voltage and the nominal current. The study considers different sizes of PV plants, as well as the effect of solar irradiance and ambient temperature conditions. The power quality simulation model was developed using a commercial EMT (Electro-Magnetic Transient) software environment, namely PSCAD. At the PCC, the load RMS voltage increased to 1.2 pu. A controller is used and set to limit the RMS voltage at PCC. This mitigates the overvoltage issue. The solar PV system attempts to supply the load with reactive power when the network is off. However, the load cannot be supplied because the capacity of generated power is insufficient. Moreover, when the grid connection is restored, the active and reactive powers fluctuate. Consequently, the solar PV becomes incapable of supplying the load when the demand is greater than its capacity. Due to the AC voltage imbalances, there is a large imbalance in AC current; the firing of the IGBT has taken place before that moment in time. However, there is a risk for a missing pulse, which would distort the AC voltage more. Because of this, the IGBT is fired at a wrong point of the supply-voltage sine wave when a solar PV system is operated with unity pf, which drops to a low value caused by the penetration of the solar PV. As a result, the active power is reduced; but this maintains the grid-supplied reactive power; although solar PV system can reduce the demand efficiently. The pf is maintained at 0.9 after the connection of the PV system and becomes stable. There is no observed direct impact between the size of solar PV plant and harmonics. Current harmonic decreases when solar PV plant size increases. Current harmonic distortion oscillates less than 5% limit. In addition, voltage THD violates the acceptable harmonic level. The voltage harmonic increases at PCC with increasing number of PV modules that are connected in parallel and decreases with decreasing number of PV modules that are connected in series. An increasing number of modules in parallel will significantly increase VTHD at PCC. There is a high correlation between voltage harmonic and solar irradiance. The relation between current harmonic and solar irradiance shows an irregular trend that needs further analysis. It shows that the levels of the harmonics are less than the compared IEEE standard. The voltage harmonic indices do not meet IEEE specified boundaries.
Footnotes
Handling Editor: James Baldwin
Declaration of conflicting interests
The author(s) declared no potential conflicts of interest with respect to the research, authorship, and/or publication of this article.
Funding
The author(s) received no financial support for the research, authorship, and/or publication of this article.