
Abstract
To develop a comprehensive performance evaluation model of heat transfer tube, the flow condensation heat transfer experiment of R1234yf inside the tube was operated. In this article, the effect of mass flux, condensation temperature, and fin structural parameters on the heat transfer characteristics was studied, and then corrections of heat transfer coefficient and pressure drop predictive effect were checked. Results show that the heat transfer coefficient and pressure drop increase with increasing mass flux and condensation temperature, and the heat transfer enhanced ratio is 2.53∼3.67 while the pressure drop deterioration ratio was 1.95∼2.49 for the micro-fin tube; the Yu and Koyama correlation has a best predictive effect for the heat transfer coefficient with the average and mean deviation of 0.77% and 10.84%, and the Han et al. correction shows the best predictive effect for the pressure drop with the average and mean deviation of 1.82% and 6.23%. Finally, the heat transfer coefficient per unit pressure drop was selected as evaluation index of heat exchanger comprehensive performance, a model was developed based on the Yu and Koyama correlation, and it can predict the heat transfer coefficient per unit pressure drop with a mean absolute prediction error of −1.65%.
Introduction
For the last few years, high efficiency compact heat exchangers are gaining widely popular within industrial sectors, due to it does not create much additional resistance with increasing the heat transfer coefficient. Enhanced tube with various surface structures was developed to improve the heat transfer characteristics. 1 And a particular theoretical analysis and a lot of experiments are designed and implemented for various high efficiency heat exchangers. Especially, many theoretical models of flow patterns, heat transfer coefficient, and pressure drop have been proposed by domestic and foreign scholars based on experimental research for theoretical analysis of existing heat tube.
Based on JG-Xtt diagram which is a flow pattern analysis diagram acquired based on experimental data, flow pattern is divided into stratified, stratified wavy, intermittent, annular, and dispersed bubble by Taitel and Dukler, 2 and then Breber et al. 3 proposed a modified version of Taitel et al. map which divides the flow pattern into four zones of zone I-annular and mist annular, zone II-wavy and stratified, zone III-slug and plug, and zone IV-bubble. Unlike the former, Stephan 4 assumed that the non-dimensional gas velocity JG as a function of void fraction ε and the flow regime was subdivided as spray, annular-semi-annular, wavy, slug, and plug. Five flow regimes were identified in the mass velocity G and vapor quality x map by El Hajal et al., 5 which includes mist flow, intermittent, annular, wavy stratified, and fully stratified. In addition, Cavallini et al. 6 suggested a new simplified model in which the diagram is subdivided in two regions of ΔT-dependent flow regime (wavy and smooth stratified flow regime) and ΔT-independent flow regime (annular flow).
Currently, many heat transfer coefficient and pressure drop correlations based on the study of flow patterns inside the tube are the core of many scholars’ studies, such as the heat transfer coefficient correlations of Shah, 7 Jung et al., 8 Cavallini et al., 9 and Thome et al. 10 and pressure drop correlations of Sun and Mishima, 11 Friedel et al., 12 and Tran et al. 13 for the smooth tube; the heat transfer coefficient correlations of Tang et al., 14 Cavallini et al., 15 and Yu and Koyama 16 and pressure drop correlations of Chio et al., 17 Cavallini et al., 15 and Chandra and Han 18 for the micro-fin tubes and the heat transfer coefficient and pressure drop correlations of Goto et al. 19 and Miyara et al. 20 for the herringbone tube. Of course, more and more new correlations are obtained to respond the expansion of heat exchanger application environment and the renewal of heat exchanger structures. Hossain et al. 21 proposed a two-phase frictional multiplier (Φv) correlation incorporating the effect of mass velocity, tube geometry, and surface tension on the condensation pressure drop inside smooth horizontal tube. While Ding et al. 22 proposed vapor phase frictional multiplier correlation to predict two-phase frictional pressure drop of R410A–oil mixture flow boiling inside the micro-fin tube.
Although the heat transfer coefficient and pressure drop correlations are constantly updated and gradually improved, the increase of heat transfer coefficient is usually accompanied by the increase of flow power consumption; thus, single study of the heat transfer coefficient and pressure drop cannot reasonably evaluate the comprehensive performance of heat exchanger. However, there are not many theoretical models of evaluating the heat exchanger comprehensive performance at present. The longitudinal finned heat exchanger is the core component for low-temperature medium waste heat recovery equipment, Fan et al. 23 applied Nu/f, Nu/f1/2, and Nu/f1/3 as the comprehensive performance index and found that the numerical simulation result is similar to the experimental result with the average relative error of 15% under the same pressure drop and pumping power conditions. Numerical study was performed by Zhao et al. 24 and Wang et al. 25 for different structures of H-type finned tube through realizable k–ε turbulent model, to obtain comprehensive performance with high precision for H-type finned tube. To investigate the influence of nanoparticle concentrations on the heat transfer coefficient and pressure drop, comprehensive evaluation of nanoparticle concentrations on the heat transfer coefficient and pressure drop was made by Zhou et al., 26 and found that the heat transfer coefficient is the best while pressure drop is the minimum when nanofluid particle concentration is 0.2%. In addition, under the condition of maximum convective heat flow for a given heat exchange area, the optimal flow parameter (Re) relative to structure size, heat flux, and physical properties was determined by analyzing the energy (available energy) loss rate of the convective process; Chen and Zhou 27 derived the relationship of economical structure size with the convective heat transfer parameters for fluid flow across the tube by connecting the above-mentioned two relationships. In short, the above models use different criteria to evaluate the comprehensive heat transfer performance and those application ranges are very restrictive.
Due to deepening of energy crisis and aggravation of global warming, alternative refrigerant R1234yf has considerable promise in the refrigeration and air-conditioning field. Therefore, the prediction accuracy of existing correlation was checked first based on the condensation heat transfer coefficient and pressure drop of R1234yf in this article, and then the comprehensive performance of heat exchanger was made using the heat transfer coefficient per unit pressure drop, and finally, a model of calculating the heat transfer coefficient per unit pressure drop was proposed based on the Yu and Koyama correlation.
Experimental facilities
The system schematic of flow condensation heat transfer experimental rig is shown in Figure 1, and it is mainly composed of reservoir, mass flow meter, pre-heater, test section, expansion valve, condenser, and refrigerant pump. Refrigerant pump is used to offer the refrigerant circulation power, and refrigerant flux is controlled by operating frequency of refrigerant pump and can be read by mass flow meter. Refrigerant states at the inlet and outlet of test section are adjusted by electrical heating power in pre-heater and heat absorption capacity of cooling fluid in the test section, respectively.

System schematic of experimental rig.
The test section is a horizontally counter flow double-tube heat exchanger with 2.5 m effective heat transfer length; refrigerant flows inside the tube while cooling fluid flows inside the annular channel, as shown in Figure 2(a). The condensation pressure in the test section is regulated by an expansion valve.

Schematic plot of test section: (a) test section and (b) sectional view of test tube.
In the experiment, one smooth tube with an inner diameter of 3.5 mm and two micro-fin tubes with fin helical angle of 8° and 15° are selected as the test tube, the structural parameters of test tube are shown in Table 1, and the cross-sectional image of micro-fin tube is shown in Figure 3.
Structural parameter of the heat transfer tube.


Cross-sectional image of the micro-fin tube.
PT100 sensor with an accuracy of 0.1°C is used to measure refrigerant and cooling fluid temperatures at the inlet and outlet of test section, and refrigerant pressure is measured using a absolute pressure transmitter with an accuracy of ±0.1% within the range of 0∼35 bar. And measuring tool was specially designed to ensure the accuracy of temperature and pressure parameters, as shown in Figure 4. The wall temperature on the outer surface of test tube is measured by a 0.5-mm diameter T-type thermocouple with an accuracy of ±0.5°C, four thermocouples are arranged in four directions (up, down, left, and right) at each measure point, and thermocouple probe is placed in the temperature slot to avoid the interference of cooling fluid on the measurement accuracy of wall temperature, as shown in Figure 2(b). In addition, a differential pressure transmitter with an accuracy of 0.1% within the range of 0∼2 kPa is used to measure the refrigerant pressure drop across the test section. Refrigerant mass flux is measured by a Mass 3500 Series mass flow meter with an accuracy of 0.1% within the range of 3∼40 kg/h; the mass flux of cooling fluid is measured by a magnetic flow meter with an accuracy of 0.5% within the range of 0∼6 kg/min. In a word, all measuring sensors are suited to all the conditions tested.

Temperature and pressure measurements.
In the experiment, the influence of mass flux, saturation temperature, and vapor quality at the inlet and outlet of test section on the heat transfer characteristics inside the tube is mainly studied. Therefore, the saturation temperatures are set to 40°C, 43°C, and 45°C under mass fluxes of 500∼1000 kg/(m2 s), respectively. Meanwhile, vapor qualities at the inlet and outlet of test section are remained 0.8 ± 0.03 and 0.2 ± 0.03, respectively.
Data reduction
Heat transfer coefficient
When experiment reaches steady state, refrigerant is in the two phase at the inlet and outlet of test section; therefore, T2 and T3 are equal to the saturation temperature, and the heat absorption capacity of cooling fluid is used as the calculation standard of heat transfer capacity in the test section, which can be represented as

where mw is the cooling fluid flow rate, kg/s; Cp is the specific heat at constant pressure, J/(kg K); and Tw,in/Tw,out are the cooling fluid temperatures at the inlet and outlet of test section, respectively, °C.
The local heat transfer coefficient can be expressed as

where Tsat is the saturation temperature which was calculated based on the condensation pressure, °C; Ai is the internal surface area of test tube which was calculated based on inner diameter Di, m2; Twall,in is the wall temperature on the inner surface of test tube, °C, which is calculated based on the wall temperatures on the outer surface of tube, and it is the average value of thermocouple measurements, which was calculated as

where Di/Do are the inner and outer diameters of test tube, m; λ is the thermal conductivity of test tube, W/(m K); and l is the effective heat transfer length, m.
Finally, the calculating uncertainty of local heat transfer coefficient is 0.42% based on Kline’s 28 method, when considering the parameter measurement deviation.
Pressure drop
In the experiment, the pressure drop is measured by the differential pressure transmitter and mainly comprised of three parts, and it was calculated as 29

where ΔPgravitational is the gravitational pressure drop which is equal to zero due to the test tube was horizontally placed; and ΔPacceleration is the acceleration pressure drop, which is caused by the change of vapor–liquid velocities due to vapor quality reduces along the axial direction of test tube, and it can be calculated as 30

where G is the refrigerant mass flux, kg/(m2 s); ρv/ρl are the densities of vapor and liquid, kg/m3; and φ is the void fraction. Therefore, the friction pressure drop can be expressed as

The accuracy of differential pressure transmitter is directly related to the measurement accuracy of total pressure drop, and its measurement deviation is 0.1% within the range of 0∼2 kPa.
Verification of the experimental rig
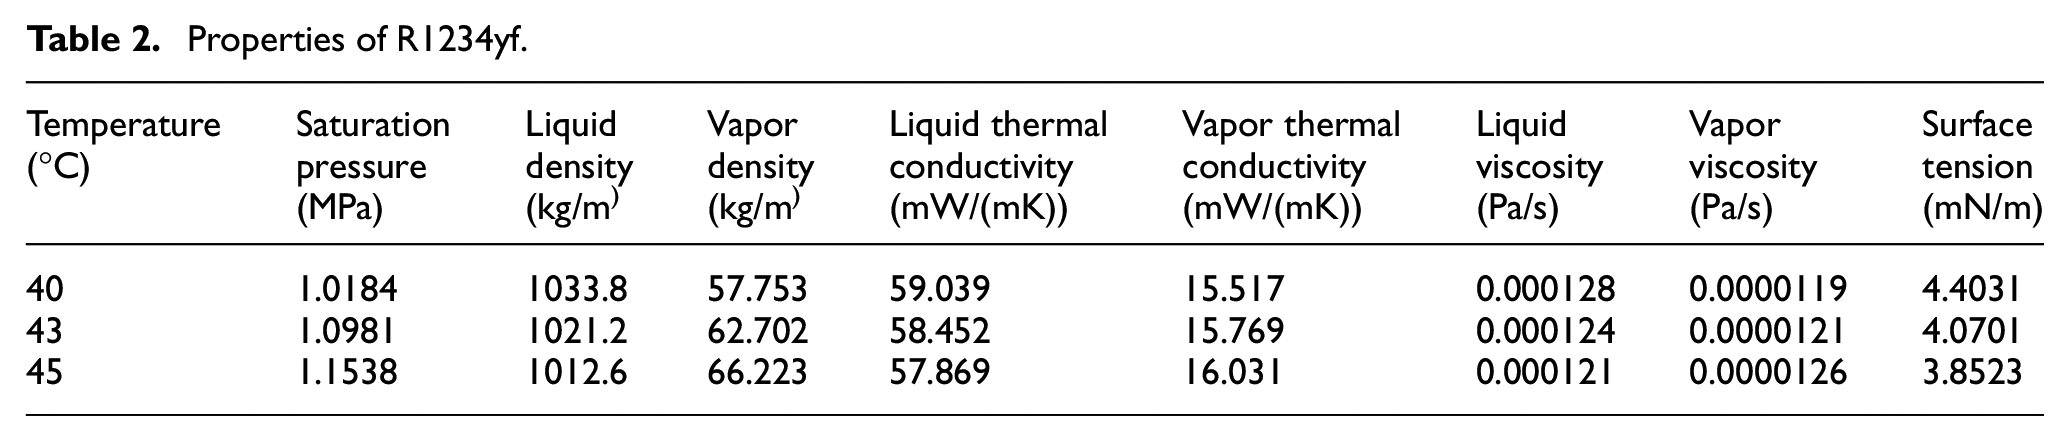
The single-phase heat transfer experiment of R1234yf with the Reynolds number ranging from 10,000 to 22,000 inside the smooth tube with 3.5 mm inner diameter was operated to check the reliability of the experimental rig, before any two-phase heat transfer experiment operation, and the physical properties of R1234yf can be found in Table 2.
Properties of R1234yf.
Comparison between experimental value and predicted value of the Nusselt number is shown in Figure 5, and the results display that experimental value agrees well with calculated value of the Gnielinski 31 correlation with mean relative deviation (MRD) and mean absolute relative deviation (MARD) of 2.53% and 4.29%, respectively. Meanwhile, the calculated value of the Blasius 32 correlation was also used to compare experimental value of friction factor, and experimental result shows that the MRD and MARD between calculated value and experimental value of friction factor f are 1.76% and 4.25%, respectively, as shown in Figure 6.

Comparison between experimental value and calculated value of Nu.

Comparison between experimental value and calculated value of friction factor.
Results and analysis
An analysis was made to contrast the condensation heat transfer coefficient and pressure drop of R1234yf inside the horizontal smooth and micro-fin tube in this section.
Heat transfer coefficient and pressure drop
The condensation heat transfer coefficient of R1234yf inside the smooth tube under different condensation temperatures and mass fluxes is shown in Figure 7(a); the heat transfer coefficient increases with increasing mass flux and reducing condensation temperature. The influencing mechanism of mass flux is the vapor and liquid velocities all become bigger with the increment of mass flux, and the velocity difference between vapor and liquid also becomes bigger due to the difference between vapor and liquid densities; they all can enhance fluid turbulence and then enhance heat transfer effect.

Influence of experimental conditions on heat transfer characteristics: (a) the heat transfer coefficient, (b) the pressure drop, (c) the heat enhancement ratio, and (d) the pressure drop deterioration ratio.
For condensation temperature, not only the velocity difference between vapor and liquid becomes bigger due to vapor density increases and fluid density reduces with increasing condensation temperature but also the liquid thermal conductivity increases with reducing condensation temperature and liquid film is the main heat transfer thermal resistance between refrigerant and cooling water. Two factors all can lead to optimization effect of temperature on the heat transfer coefficient.
The heat transfer enhancement mechanism of enhanced tube mainly includes three parts: the increment of heat transfer area, condensed fluid quickly removes from fin tip to fin bottom due to surface tension and shear force, and enhancement of liquid film turbulence under the function of fins. 33 The heat transfer enhancement mechanism is different under different working conditions, and the third factor mainly occurs under a large mass flux.
The heat transfer enhanced ratio was expressed as
where hhelical is the heat transfer coefficient inside the helical tube, and hsmooth is the heat transfer coefficient inside the smooth tube, W/(m2 °C).
As shown in Figure 7(c), the heat transfer enhanced ratio of 2# and 3# helical tubes is 2.53∼2.87 and 3.12∼3.68, respectively, while the heat transfer increment area ratio is 1.97 and 2.23, respectively, which is enough to indicate that apart from the increase of heat transfer area, fin also enhances heat transfer effect by enhancing fluid turbulence. In addition, the heat transfer enhanced ratio increases with decreasing condensation temperature due to the effect of surface tension and shear force on the drainage of condensates, and the heat transfer enhanced ratio increases with increasing mass flux due to that liquid film turbulence is enhanced for the increase of vapor and fluid velocities which can lead to a bigger inter-facial shear force. The same results can be found in the study of Sapali and Patil 34 and Vu et al. 35
As shown in Figure 7(b), the pressure drop increases with increasing mass flux and reducing condensation temperature. Because of fluid and vapor velocities all increase with increasing mass flux, not only the increment of fluid velocity can directly lead to a bigger friction force of flow film against tube wall but also the phase change from vapor to fluid can result in a bigger acceleration pressure drop; therefore, mass flux can directly lead to flow power dissipation against tube wall. About the effect of condensation temperature on the pressure drop, it can be explained by the change of R1234yf viscosity with temperature, and fluid viscosity becomes bigger when temperature reduces and it can cause a bigger flow resistance of fluid film.
The pressure drop deterioration ratio was expressed as

where ΔPhelical is the pressure drop inside the helical tube, and ΔPsmooth is the pressure drop inside the smooth tube, kPa.
It also can be found that the pressure drop of micro-fin tube is higher than that of smooth, and a larger helical angle can cause a bigger pressure drop. The pressure drop deterioration ratio of 2# and 3# micro-fin tubes is 1.95∼2.34 and 2.14∼2.49, respectively, as shown in Figure 7(d). The pressure drop deterioration ratio becomes bigger with increasing mass flux and reducing condensation temperature, due to the helical fin can enhance fluid turbulence and promote fluid mixing in the inner fin region, and then it causes more the frictional pressure drop between liquid film and inner tube wall. For smooth and micro-fin tubes with fin helix angle of 18° and 15° and outer diameter 9.52 mm, Sanjeev and Rajeev 36 found that the frictional pressure drops were 2.11∼2.56 and 1.62∼2.12 times higher than those of smooth tubes.
The heat transfer coefficient and pressure drop can directly represent the heat transfer effect and the flow power consumption inside the tube, respectively, and the two indicators are also taken into account the influence of experimental conditions and heat transfer tube structural parameters. The increment of heat transfer coefficient is usually accompanied by the increase of fluid flow power consumption. Therefore, the heat transfer coefficient per unit pressure drop was selected to make a comprehensive performance evaluation of heat transfer tube, which can give different influence results of variables on the heat transfer coefficient and pressure drop, and it can be defined as

Figure 8 shows the heat transfer coefficient per unit pressure drop HPR reduces with increasing mass flux, which illustrates that the enhancement effect of mass flux on the heat transfer coefficient is less than the reinforced effect of mass flux on the pressure drop; the heat transfer coefficient per unit pressure drop of 2# micro-fin tube is less than that of 3# micro-fin tube, which states that the heat transfer enhancement effect caused by the fin helical angle is stronger than that of the pressure drop. In a word, we can clarify the practical value of actions adopted for the heat exchanger based on the experimental results.

Analysis of the heat transfer coefficient per unit pressure drop.
Comparison with the heat transfer correlation
A comparison between experimental value and calculated value of the heat transfer coefficient using six well-known correlations is shown in Figure 9(a)–(c), and a comparison between experimental value and calculated value using six pressure drop correlations is shown in Figure 9(d)–(f). The MRD and the MARD were used to represent the correlation predictive effect


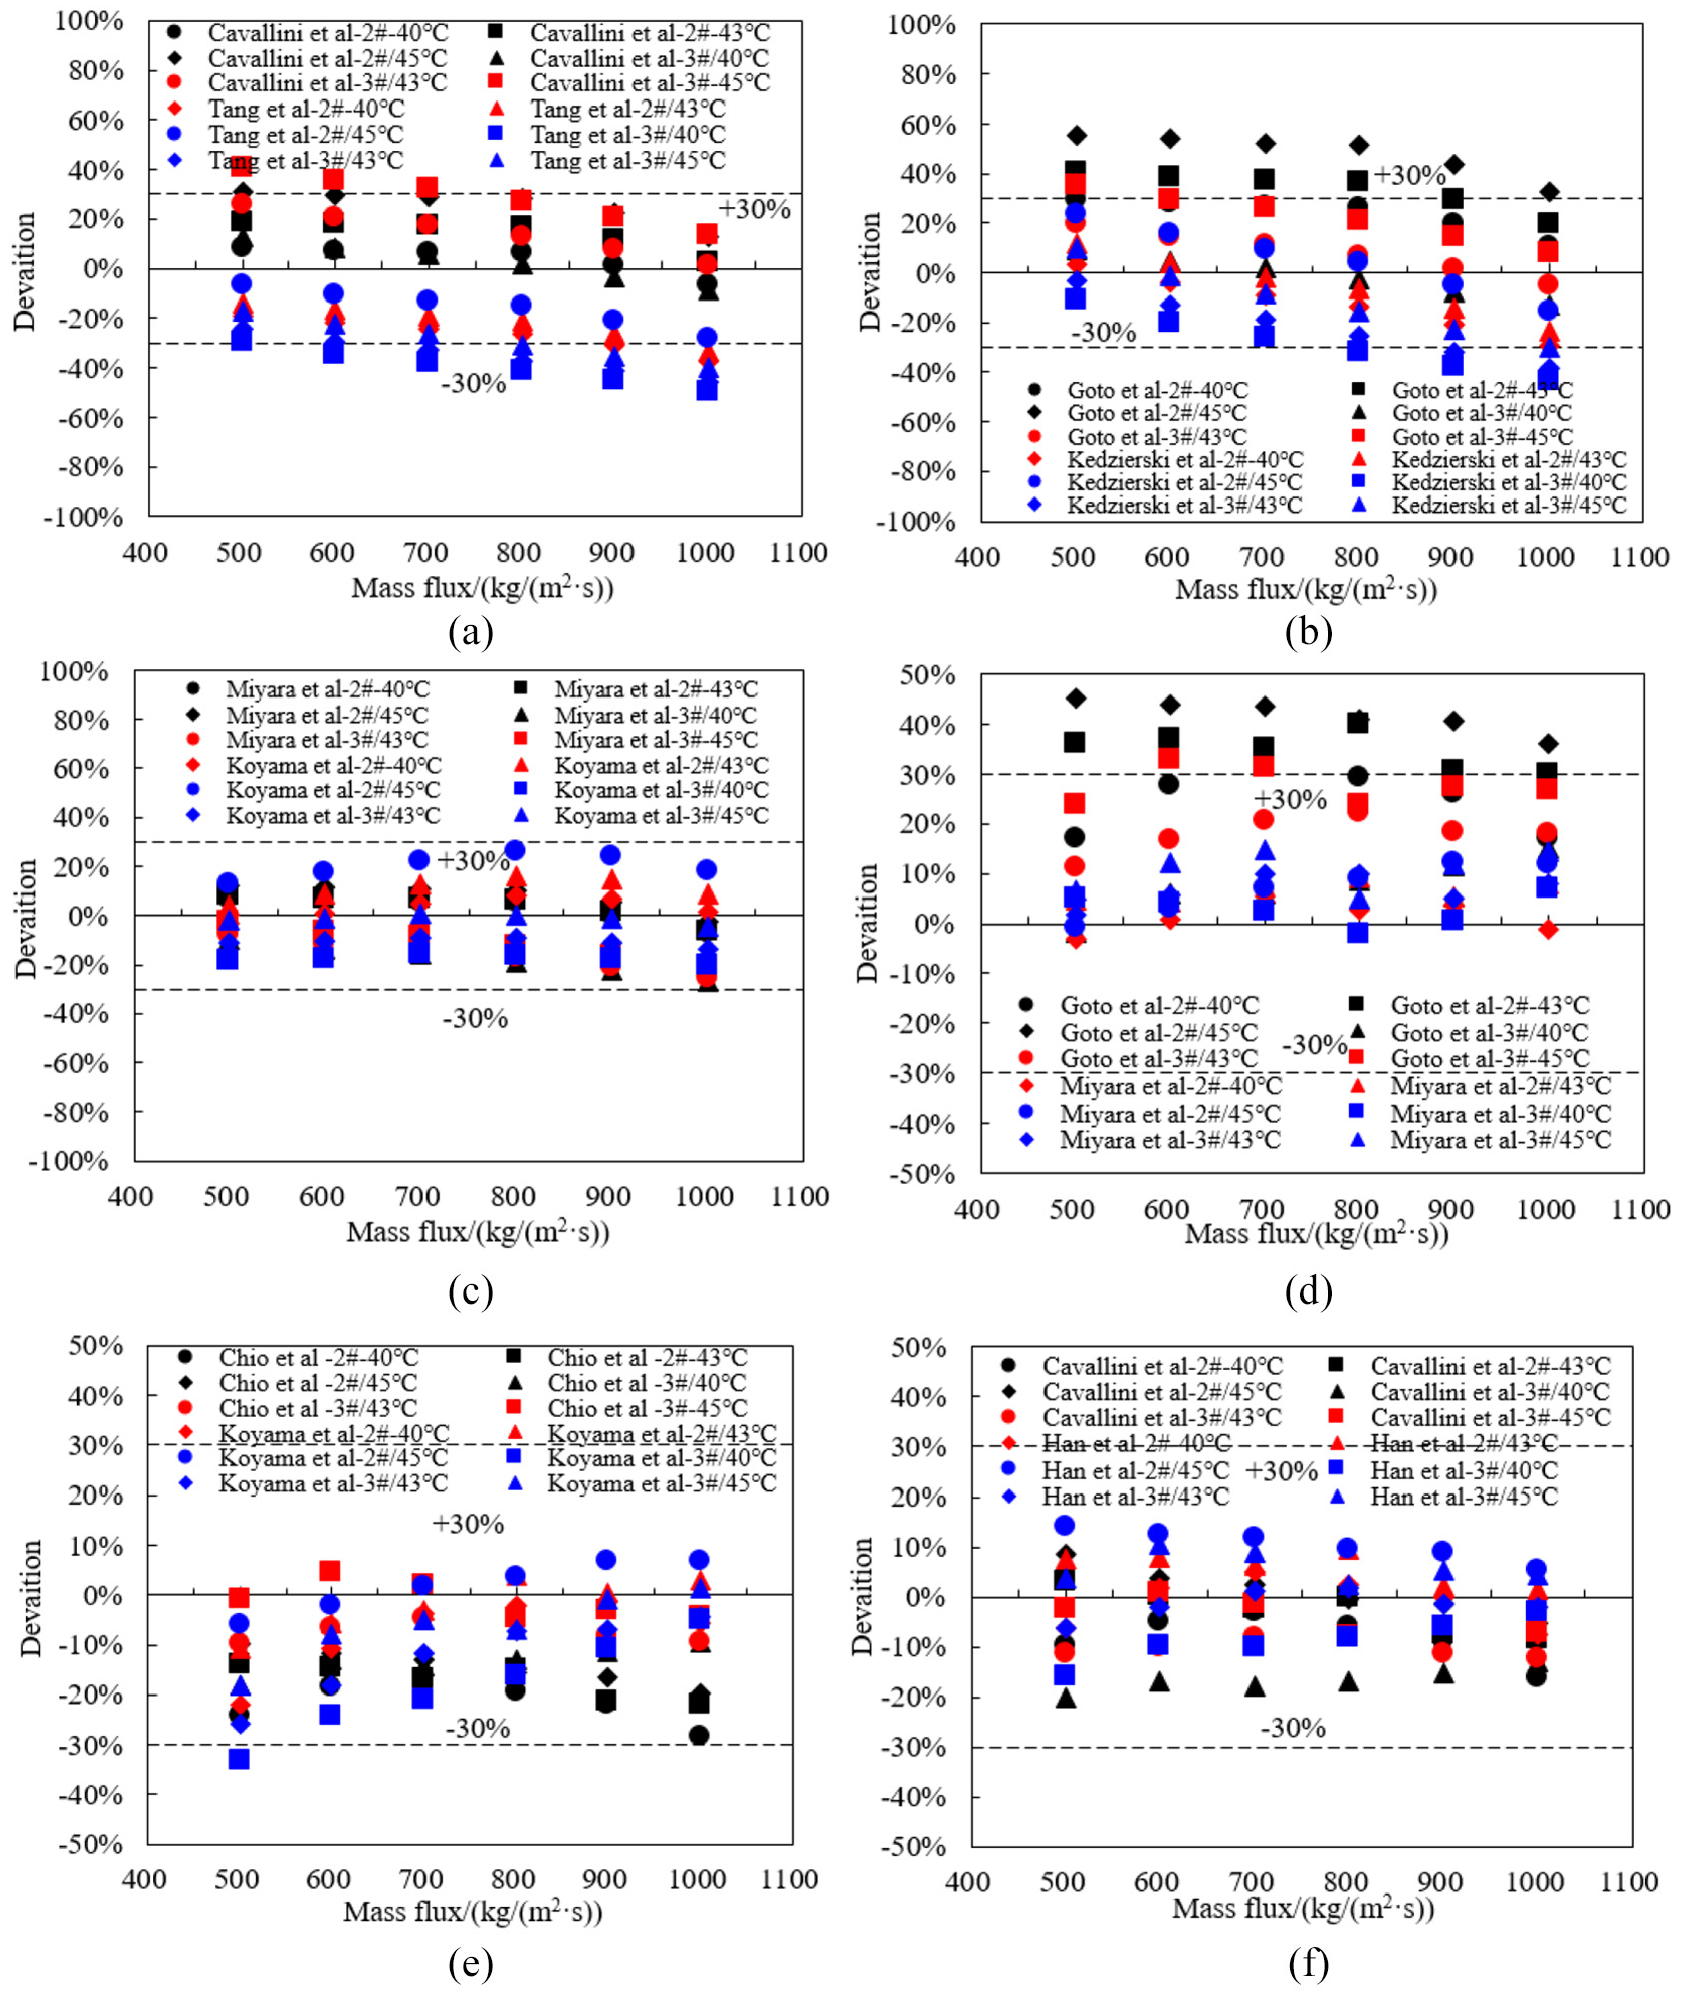
Comparison between the correlations of calculated value and experimental value of the heat transfer coefficient in (a), (b), and (c) and the pressure drop in (d), (e), and (f).
The comparison results are shown as follows:
The influence of fin structural parameters on heat transfer mechanism inside the tube was fully considered in correlations of Cavallini et al. 15 and Tang et al., 14 geometry enhancement factor was used to characterize fin structural parameters in the Cavallini et al. correlation, and hydraulic diameter was selected by Tang et al. Although Cavallini et al. overestimate and Tang et al. underestimate the heat transfer coefficient inside the tube, they all show a good predictive effect with an MARD of 15.78% for the Cavallini et al. correlation and an MARD of 27.96% for the Tang et al. correlation, as shown in Figure 9(a).
The Goto et al. 19 correlation was obtained based on the heat transfer coefficient inside the herringbone tube; therefore, the correlation calculated value is greater than experimental value of heat transfer coefficient with an MARD of 23.91%, which is consistent with experimental comparison results. For Kedzierski and Goncalves 37 correlation, the predictive error increases with the increase in mass flux. It is because fin has a great influence on fluid turbulence at a large mass flux which was not fully expressed in the correlation; meanwhile, helical angle also has a great influence on the predictive error, as shown in Figure 9(b).
Although the Miyara et al. 20 correlation was also fitted based on the heat transfer coefficient inside the herringbone tube, the correlation predictive error is less than 15%. It might be because they have different flow mechanisms for different structural fins, but the effect on fluid turbulence is similar at a large mass flux. Yu and Koyama 16 correlation shows the best predictive effect on the heat transfer coefficient inside the tube with the MARD of 10.84%, and the influence of operating conditions and fin structural parameters on the predictive error is small, as shown in Figure 9(c).
Correlations of Goto et al. 19 and Miyara et al. 20 all overestimate the pressure drop inside the tube, which agrees with the experimental results that the pressure drop inside the herringbone tube is greater than that of the helically finned tube, but predictive effect of Miyara et al. correlation with the MARD of 6.25% is better than that of Goto et al. correlation with the MARD of 25.82%, as shown in Figure 9(d).
The Chio et al. 17 correlation is the correlation of homogeneous model which is not suitable for working conditions with obvious gas–liquid phase distribution; thus, Chio et al. correlation totally underestimates the pressure drop inside the tube, and the MARD is 12.83%. Yu and Koyama 16 correlation is the correlation of separated flow model, it was also fitted based on the pressure drop inside the helically finned tube, and it shows the best predictive effect with the MARD of 9.03%, as shown in Figure 9(e).
Equivalent roughness was introduced into the Friedel correlation 12 by Cavallini et al., 15 which was used to characterize the influence of fin height, diameter, and helical angle on the wall roughness, while Han et al. considered that fin height and tooth pitch are the main factors affecting the flow resistance effect, and reset the liquid friction coefficient. Correlations of Cavallini et al. and Chandra and Han 18 both show a good predictive effect, the MARD of Cavallini et al. correlation is 7.81%, and the other is 6.23%, as shown in Figure 9(f).
For the adopted association, deviations between calculated value and experimental value of the heat transfer coefficient and pressure drop can be seen in Table 3.
Deviations of the adopted association.

MARD: mean absolute relative deviation; MRD: mean relative deviation.
New correlation
Obviously, Goto et al. and Miyara et al. correlations which were obtained based on the experimental data of herringbone tube are not suitable for the test tube, while the Yu and Koyama correlation can be used to derive an equation of comprehensive performance evaluation model based on the comparison results between experimental data and existing correlation, and it is also because of the heat transfer coefficient calculation formula and pressure drop calculation formula were related by the vapor conversion coefficient Φv, which is different with the Cavallini et al. correlation.
The total pressure drop mainly consists of the friction pressure drop and acceleration pressure drop, as shown in formula (6); the friction pressure drop accounts for about 85% of the total pressure drop and experimental variables have little effect on its value based on some experimental research works.38,39 The proportion of accelerated pressure drop in the total pressure drop calculated by existing correlation was also analyzed in the article.
Change of the acceleration pressure drop ratio under mass fluxes of 500∼1000 kg/(m2 s) and condensation temperatures of 40°C, 43°C, and 45°C was analyzed. For the Cavallini et al. 15 correlation, the acceleration pressure drop ratio is 8.85%∼10.39% and is not much affected by mass flux, as shown in Figure 10(a). For the Goto et al. 19 correlation, the acceleration pressure drop ratio is 7.16 ± 0.3%, which indirectly proves that the friction pressure drop inside the herringbone tube is greater than that of the helix tube, so the acceleration pressure drop ratio is the smallest among all used correlations, as shown in Figure 10(b). Based on experimental data, mass flux has little effect on the component proportion of pressure drop with the acceleration pressure drop ratio of 7.33%∼10.11%, while for the Yu and Koyama correlation, the acceleration pressure drop ratio decreases with increasing mass flux and it goes from 11.16% to 8.69%, as shown in Figure 10(c) and (d).

Ratio of acceleration pressure drop in the pressure drop correlation: (a) the Cavallini et al. correlation, (b) the Goto et al. correlation, (c) the Yu and Koyama correlation, and (d) the experimental data.
Although the acceleration pressure drop ratio varies in different existing correlations, it is certain that the acceleration pressure drop ratio is about 7.16%∼11.16%. The friction pressure drop was used to represent the total pressure drop, and based on the change of the acceleration pressure drop ratio with mass flux for the Yu and Koyama correlation, it can get
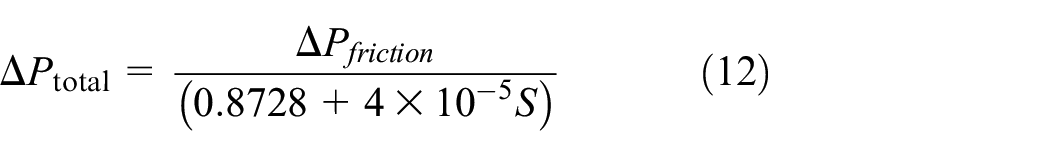
where S is the mass flux coefficient, which value is equal to the value of one hundredth of mass flux, and the calculation formula is

In the Yu and Koyama correlation, the heat transfer mechanism inside the tube was mainly divided into the forced convection heat transfer and the film condensation heat transfer. The film condensation heat transfer can be ignored under working condition of a large mass flux by the calculation; therefore, the heat transfer mechanism can be regarded as the forced convection heat transfer inside the tube under all experimental conditions, which can be represented as
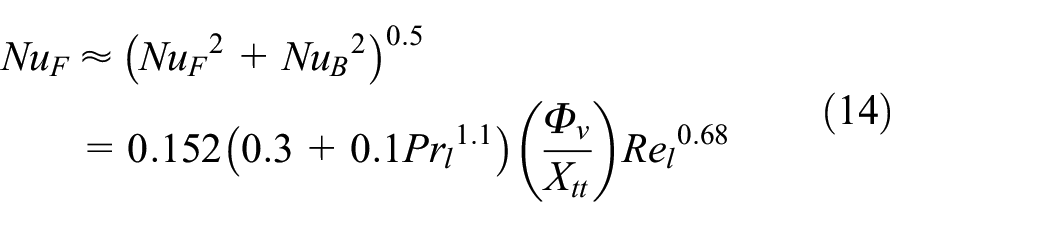
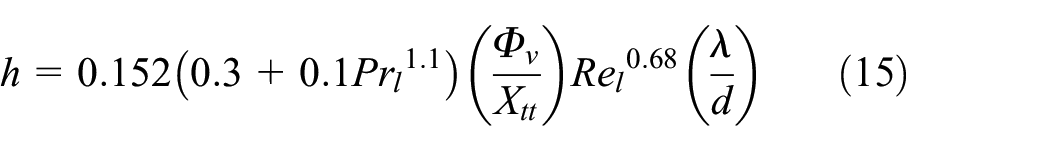
And then, the heat transfer coefficient inside the tube can be expressed as
Refer to equation (12), the total pressure drop can be expressed as

In conclusion, the heat transfer coefficient per unit pressure drop HPR was set as the comprehensive performance evaluation index in the article, and it can be represented as
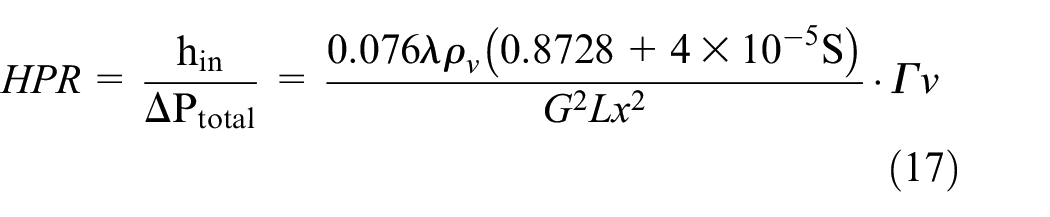
where Γv was defined as the comprehensive performance coefficient

The comparison between model calculated value and experimental value of HPR was shown in Figure 11, and the results display that the model overestimates mostly experimental value and experimental variables have little influence on the predictive error. The mean absolute prediction error is 87.22%. To improve the prediction accuracy of model, coefficient β was introduced into formula (15), and it can be expressed as after computation

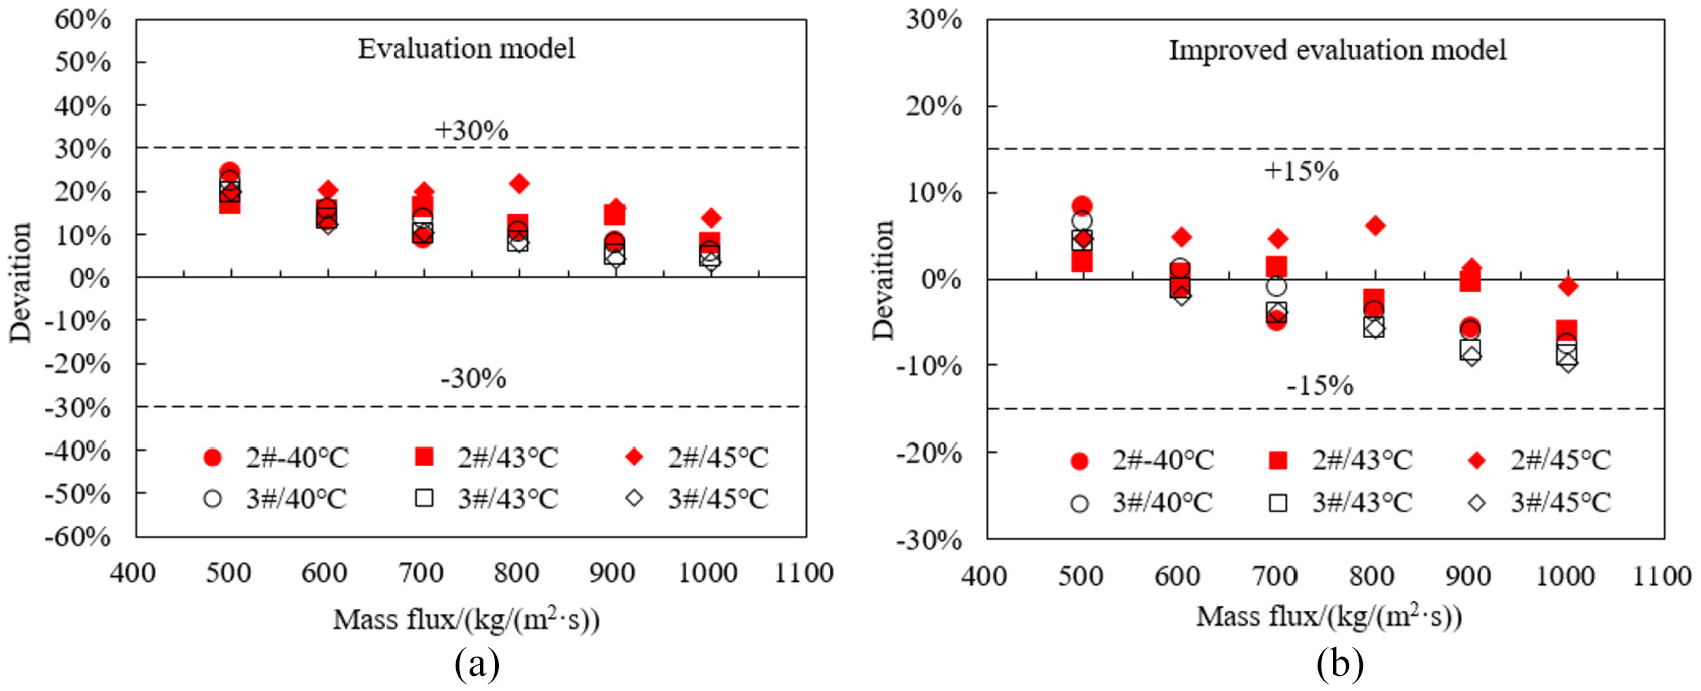
Comprehensive characteristics evaluation model based on the Yu and Koyama correlation: (a) evaluation model and (b) improved evaluation model.
The final form of mode is

The improved model has a better prediction effect for HPR with a mean absolute prediction error of −1.65%, as shown in Figure 11(b). The influence of vapor quality, heat flux, and fin structural parameters on the prediction accuracy of model is still unknown due to the limitations of experimental equipment; therefore, there is still a lot of work to be done to refine the model.
Conclusion
The flow condensation heat transfer experiment of R1234yf inside the horizontal tube was operated, and the following conclusion can be drawn:
The heat transfer coefficient and pressure drop all increase with increasing mass flux and reducing condensation temperature, the heat transfer coefficient and pressure drop of micro-fin tube are greater than those of smooth tube, the heat transfer enhanced ratio is 2.53∼3.67, and the pressure drop deterioration ratio is 1.95∼2.49.
For the heat transfer coefficient correlation, the correlations of Goto et al., Miyara et al., and Cavallini et al. overestimate the heat transfer coefficient while the correlations of Tang et al. and Kedzierski and Goncalves underestimate the heat transfer coefficient, and the Yu and Koyama correlation shows the best predictive effect with the average and mean deviation of 0.77% and 10.84% among all correlations. For the pressure drop correlation, correlations of Goto et al. and Miyara et al. overestimate the pressure drop while the Chio et al. correlation underestimates the pressure drop, and the correlations of Yu and Koyama, Cavallini et al., and Han et al. have the same predictive effect with the deviation of less than 10%.
The heat transfer coefficient per unit pressure drop HPR was used to make a comprehensive evaluation of heat transfer characteristics inside the tube, and found HPR reduces with increasing mass flux. Based on the Yu and Koyama correlation, a comprehensive performance evaluation model of HPR was proposed, and it can predict HPR with a mean absolute prediction error of −1.65%.
Footnotes
Appendix 1
Handling Editor: James Baldwin
Declaration of conflicting interests
The author(s) declared no potential conflicts of interest with respect to the research, authorship, and/or publication of this article.
Funding
The author(s) disclosed receipt of the following financial support for the research, authorship, and/or publication of this article: This study was supported by the Provincial Quality Engineering Project of Colleges and Universities in Anhui Province (2018jxtd100).