
Abstract
In this study, 3D printing of Ti6Al4V alloy is realized and the characteristics of the printed layer are examined. The morphological structures and metallurgical changes in the printed layer are assessed. Temperature and stress fields are simulated in line with the experimental conditions. Since the air gaps are present in between the loose alloy powders prior to the printing, the effective properties incorporating the air fraction are determined and the effective properties are used in the simulations. Thermal conductivity of the loose alloy powders with the presence of air gaps is determined by incorporating the virtual experimental technique. It is found that the printed layer is free from micro-cracks and large scale asperities; however, some small pores sites are observed because of the release of air around the loose powders during the printing. Microhardness of the printed surface is higher in the top surface of the printed layer than that of as-received solid alloy. In addition, the friction coefficient of the printed surface remains lower than that of the conventionally produced solid surface. The columnar structures are formed in the mid-section of the printed layer and slanted grains are developed in the region of the top and the bottom surface of the printed layer.
Introduction
Additive manufacturing becomes one of the important lines of production in various industries, and it remains critical for the efficient and fast production of the parts and the components. 3D printing plays a vital role in additive manufacturing among the other processes, such as stereolithography fused deposit modeling, laser selective melting and net shaping . In general, 3D printing is used for prototyping of the objects while creating the object replicate via forming sequential layers unlike material removal adopted in conventional machining processes. High temperature processing is involved in the production of metallic parts via using 3D printing. In this case, metallic powders are irradiated by a high-energy beam and melting and/or local evaporation (in some cases) takes place in the irradiated region. Since the high-intensity beam scans on the surface, the melt pool developed would take a non-symmetric shape reference to the high intensity beam axis. This alters the cooling rates in the front and the behind of the irradiated spot produced by the high intensity beam. The variation with a temperature gradient across the irradiated spot causes non-uniform cooling rates while influencing the metallurgical and morphological structures in the printed layer. In some cases, the rapid solidification takes place and glassy/amorphous structures can be formed, which in turn alters the hardness, stiffness, and fracture toughness of the printed layer. However, introducing the multi-passes of high intensity beam irradiation on the surface, during layer-by-layer forming, can possibly minimize these defects and improve the microstructural integrity in the printed layer. The thermal stresses formed during the process remains vital for the practical applications of the printed parts. In this case, the high temperature gradients formed during processing causes high stress fields developed in the printed material, which may cause crack formation, or enables the printed layer being vulnerable to the mechanical failure under the fatigue loading. On the other hand, titanium alloys find various applications in the industry due to its high toughness to mass ratio. Producing the alloy parts from powders via using the 3D printing process becomes fruitful because of the low cost and fast processing. In general, titanium alloys have a high affinity to oxygen and undergo exothermic oxidation reactions at high temperatures. 1 This, in turn, causes excessive heating and metallurgical changes in the irradiated region by the high-energy beam, that is, an excessive increase in temperature gradient could triggers the thermal erosion and formation of high stresses in the printed layer. Consequently, 3D printing of the parts from titanium alloy powders is challenging; therefore, investigation of the temperature and stress fields formed in the titanium layer printed becomes important.
Additive manufacturing of titanium alloys were studied previously. 3D printing process and resulting mechanical properties were the focus for process development.2,3 The porous structures developed during the process found to improve the elastic modules of the printed layer. In addition, the surface porosity of 3D printed layer influenced the biological cell growth in medical implantation applications; hence, the cell adhesion to the implant improved significantly for porous layers. 4 The geometric feature of the molten material in the printed layer enabled correlating melt size with the process parameters. Moreover, the processing parameters influencing the void and porous formations and the resulting anisotropic behavior of the printed layer become critical 5 and proper selection if these parameters remained vital for achieving quality of printed produces. 6 This is because of the fact that the excessive porous formation and structural disintegration limited the uniformity of the microhardness of the printed layer. 7 Contrary, a care should be taken in the selection of the process parameters toward avoiding excessive hardness and brittleness of the printed structure. This is because of the fact that the surface chemistry had significant influence on the surface morphology and microhardness,8,9 which was particularly important for avoiding the oxidation reactions during the melting process. 8 On the other hand, 3D printing could be used for creating multi-material structures, which could be used for various applications including corrosion and erosion prevention, and environmental friendly adaptations. 10 Through the process, the direct fabrication of required parts with corrosion and/or erosion resistance, and others having various mechanical and structural properties could be produced.11,12 Hence, the parts produced could have high fatigue strength 12 and flexural characteristics, which could be used for biomedical applications. 13 However, the residual stress formed in the printed layer limited the practical applications of the printed parts. Consequently, model study toward minimization of the residual stress in the printed layer remained fruitful. 14
Although additive manufacturing of parts from titanium alloy powders were studied previously,15,16 the main-focus was the assessment of the mechanical properties of the parts produced. In this case, the geometric feature influenced the strength of the printed parts, 15 which was particularly true for printing the honeycomb structures. 16 Therefore, the mechanical properties such as tensile, bending, compressive, fatigue, and impact were partly depended on the shape of the printed parts and fillers used in the printing process. 16 The thermo-mechanical modeling and simulation of the high energy beam printing process incorporating the effective properties of the powders are left for future study. In thermal modeling of the high energy beam (3D) printing process, the distribution of the metallic powders and the air gaps in the printed region remain critical for the assessment of the appropriate thermal properties including the effective thermal conductivity and the specific heat. The presence of the air gaps/voids in between the metallic powders in the printed region acts like an insulator while suppressing the heat diffusion and the rate of melting in the printed region. This, in turn, results in the wrong prediction of temperature rise and stress developed in the printed layer during the processing. Consequently, incorporating the proper estimated effective powder properties becomes essential in the analysis. Thermal analysis of high-energy (3D) printing of a layer using the Ti6Al4V alloy powders is considered. The effective thermal conductivity of the powders prior to the melting is determined from the virtual experimental technique in line with the previous study. 17 The phase change including melting is incorporated in the analysis and the melt pool size, in terms of the depth and the width, is predicted. An experiment is carried out achieving 3D printing of a layer from Ti6Al4V alloy powders. The microhardness, structural and metallurgical changes in the melted layer are assessed incorporating SEM, EDS, XRD. The friction coefficient of the printed layer is measured using the microtribometer.
Analysis of temperature rise and stress developed in printed layer
Heating analysis
High energy beam heating of alloy powders is considered, in which case, the high energy beam steadily moves over the surface with a constant speed (U) in the x-direction (Figure 1). The enthalpy equation for the high intensity beam processing can be written as:

where ρ is the material density, U is the high intensity beam velocity, H is the enthalpy, k is the thermal conductivity, T is temperature, and So is the volumetric source, resembling the high intensity beam absorption. The high intensity beam axis extends along the z-axis (Figure 1). The volumetric source is
where
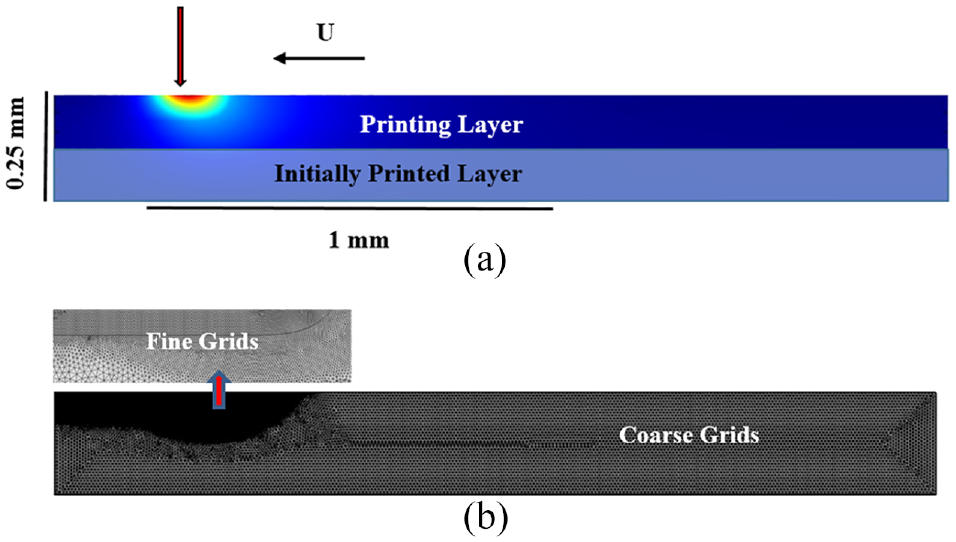
Schematic view of 3D printed layer: (a) geometric description and (b) grids used in the solution domain. Fine grids are located where high intensity beam interaction takes place.
Since the phase change occurs in the heating cycle under the high intensity beam, the powder specific heat capacity changes because of the phase change process. This can be approximated through

where
As the powder material is heated, it undergoes melting and energy is stored during the phase change process. Temperature transition takes place during the melting in between the solidus and liquidus temperatures ΔT 55 K (ΔT = Tliquidus—Tsolidus, where Tliquidus is the liquidus temperature and Tsolidus is the solidus temperature of the material); in which case, material partly melts and partly stays in a solid phase (mushy zone). The latent heat associated with the transition between the solid and liquid phases can be presented in terms of specific. In this case, specific heat (cp) in the enthalpy equation can be exchanged with

In equation (4), the heat absorbed per unit mass of the material is presented on the left side of the equation.
The liquid phase volume fraction, B, can be written as

Equation (1) is valid for the mush zone and other phases of the material; however, the material specific heat is modified with equation (3) for the condition stated in equation (5).
Ti6Al4V alloy is considered and properties used in the simulations are given in Table 1.
Properties used in the simulations. 18 The coefficients in property relations have units resulting the same as property unit, accordingly.

Thermal stress analysis
Thermal stress field is modeled incorporating Hooke’s law. The Hooke’s law relates the elastic strain increment vector, {Δεel} with the stress increment vector, {Δσ}, i.e.:

where [D] includes the elastic constants associated with the temperature-dependent elastic modulus (E), and ν is the Poisson’s ratio. The total strain vector, {Δε}, can be written as:

here {Δεel} represents the elastic strain increment vector, {Δεth} corresponds to the thermal strain increment vector while {Δεpl} is the plastic strain increment vector. The incremental thermal strain vector, {Δεth} is due to the change of volume accompanying the temperature increment (ΔT). ΔT can be determined via the thermal analysis. The temperature-dependent thermal expansion coefficient, α(T) is incorporated in the analysis. The relation between the differential and total thermal expansion (αT) coefficients can be written as:

where To represents the reference temperature corresponding to the point of no dilatational strain takes place in the material.
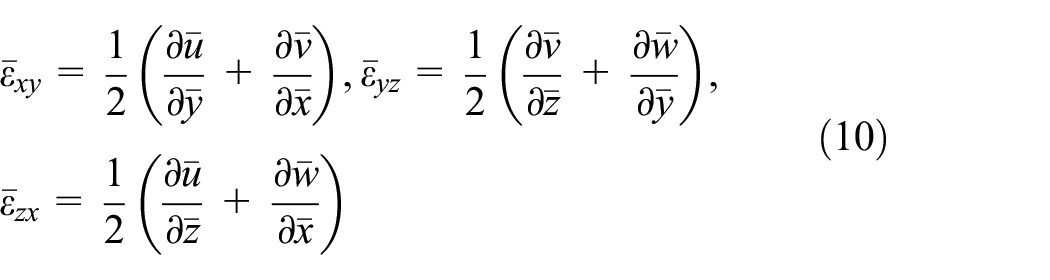
The displacement-strain relations for the thermal coupled system can be expressed as 19

The application of Newton’s method involves a nonsymmetrical Jacobian matrix, which can be shown in the coupled equations 19

The unsymmetrical matrix storage is needed for the solution of the system of equations requires von Mises (equivalent stress) stress can be written as
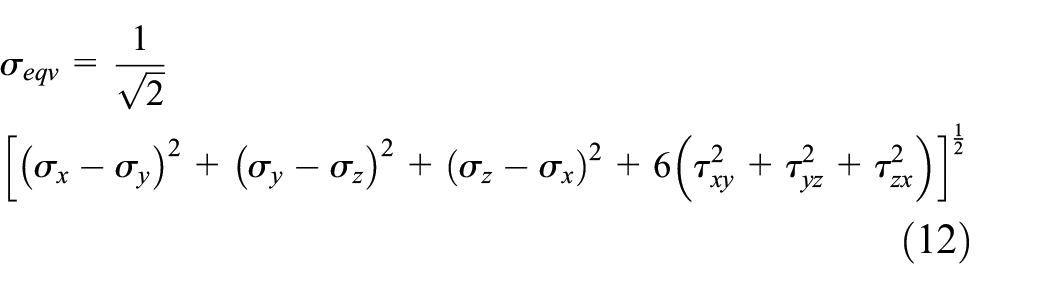
Equation (12) is adopted in the simulations predicting von Mises stress for the period of printing.
Formulation of effective properties
Since the powder is loose on the surface prior to printing, air occupies the gaps in between the powder particles. This alters the thermal properties significantly. Consequently, the alloy powder and air filling the gaps should be accounted for simultaneously to determine the effective properties. In this case, the density of the mixture of Ti6Al4V powder and air due to the gaps in between the powders can be determined incorporating the mass balance, 20 that is

where c is the volume concentration of air, ρAir is the air density, ρPowder is the powder material density, and subscript pa represents the mixture.
Adopting the Maxwell model, 21 the thermal conductivity of the mixture (alloy powder and air) can be written as
where kpa is the effective thermal conductivity corresponding to the mixture. However, the virtual experiment is realized by determining the thermal conductivity. The finding of thermal conductivity from equation (14) is compared with the virtual experiment estimation. The findings reveal that thermal conductivity obtained from equation (14) is almost 60% higher than that obtained from the virtual experiment.
The specific heat corresponding to the mixture can be determined by incorporating the energy balance. Since the powder material undergoes melting depending on the temperature range, the specific heat can be considered in line with the previous study, 20 in which case, it yields:
During the solid phase heating of the powders (for

where
During the phase change in alloy powders (for

Here, ρpa is determined from equation (13). In the liquid phase of the powders (
Numerical solution
COMSOL multi-physics code
21
is incorporated for the solution of equation (1). The implicit scheme is used and it is unconditionally stable; however, the accuracy is limited with the size of the residuals selected for the parameters, which are set as
Experimental
The 3D printing experiment was carried out using ARCAM EBM equipment. 22 The nominal beam power was 3000 W with resulting intensity 108 W/m2, the beam diameter was 180 µm and the high energy beam scans the surface with a rate of 0.1 m/s. Ti6Al4V powder was spherical geometry with an average diameter of 35 µm (Figure 2(a)). The elemental composition of the powder used is given in Table 2. Some few satellite attachments to the spherical powders, which protruded from the powder surface, were observed from SEM micrograph (Figure 2(b)).

SEM micrographs of Ti6Al4V powders used in printing: (a) various sizes of powders and (b) fine satellite attachment to powder.
EDS data (wt%) as received powders and printed layer.

Characterization of the printed layer was realized incorporating Jeol 6460 electron microscope. The sample surfaces were polished and later it was etched in Kroll’s reagent (1–3% HF, 2–6% HNO3, and 91–97% H2O) for 10 s prior to SEM micrographing of the sample cross-sections. XRD diffractogram for the printed layer was obtained using Bruker D8 Advanced XRD system, which utilized CuKα radiation. XRD was typically operated at 40 kV and 30 mA while scanning angle (2θ) was altered within 20°–80°. A micro-tribometer (MCTX-S/N: 01-04300) was incorporated determining the friction coefficient of the printed layer and referenced solid substrate surfaces. The contact load was set as 0.03 N and the end load was 5 N. The scanning speed at the surface was 5 mm/min and the loading rate for the device indent was 1 N/s. The digital microhardness tester (MP-100TC) was utilized measuring microhardness of the printed layer. The Vickers indentation hardness of advanced ceramics (ASTM C1327-99) was incorporated in the measurements. The measurements were repeated five times at different locations on the surface.
Results and discussion
3D printing of a slab using Ti6Al4V alloy powders is carried out and metallurgical changes and structural developments in the printed layer are examined using the analytical tools including SEM, EDS, and XRD. Temperature and stress fields formed in the printed layer are predicted during 3D printing process. The effective thermal conductivity of the layer formed by the alloy powder is determined from the virtual experiment method 17 and the finding is incorporated in the simulations.
Thermal conductivity assessment, and temperature and stress fields in printed layer
Since the alloy powders are loosely located on the surface prior to 3D printing, the mechanical contact between the particles is limited because of the air gaps between the particles. In addition, the circular nature of the particles (Figure 3(a)) reduces the mechanical contact area among the neighboring particles. The geometric shape and connectivity of the powder particles modify the thermal conductivity. A virtual experiment is considered determining the thermal conductivity of the layer formed from the loose powders. In this case, SEM micrograph of the layer (Figure 3(a)) is transferred to the digital environment and areas covered by the particles are evaluated at two-color scale; therefore, the projection area is considered as the slurry substrate consisting of powders (particles) and air mixture. Figure 3(b) shows area covered by the particles and the air gaps in between the particles. The concentration of particles is evaluated via the ratio of the area covered by the particles over the total projection area. The density, specific heat, and latent heat of melting of the mixture are evaluated incorporating the mass based formulations of mixture (equations 13, 15, 16). The concentration of powder particles (volume ratio) estimated is in the order of 0.743. The thermal conductivity is evaluated via virtual experiments incorporating the two-color image of particles mixture in the multi-physics code. The converted image is meshed accordingly (Figure 3(c)) and the boundaries conditions are introduced in the simulations in line with thermal conductivity measurements.

SEM micrograph and images of the powders used for thermal conductivity measurements: (a) SEM micrograph of powders, (b) black and white image of the powders, and (c) meshed black and white image for simulations.
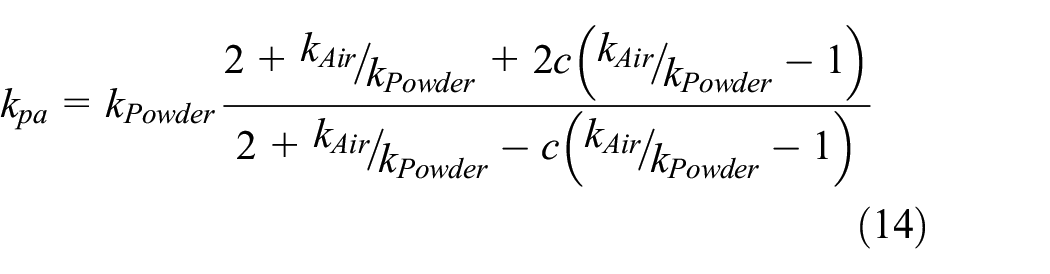
The effective thermal conductivity is obtained using the heat flux data (Figure 4(a)) obtained from the simulations. Since the mechanical connectivity of the particles provides the thermal contact in between the particles, the heat flux takes place across the thermally conducted regions of the particles. This modifies the temperature field in the solution domain, which can be seen from Figure 4(b). Consequently, localized thermal contact results in non-uniform heating of the mixture. The mass base thermal conductivity is also calculated using equation (14) to compare the predictions of the virtual experiment. The findings revealed that the thermal conductivity determined from equation (14) incorporating the mass base analysis is in the order of 6.125 W/mK, which is almost four times the thermal conductivity (1.7162 W.mK) determined from the virtual experiment incorporating the two-color actual image of the particles. Moreover, the density, effective specific heat, and effective latent heat of melting of the mixture determined from the mass base analysis, which are used in the simulations (Table 1).
Heat flux and temperature contours for black and white image of the powders: (a) heat flux and (b) temperature.
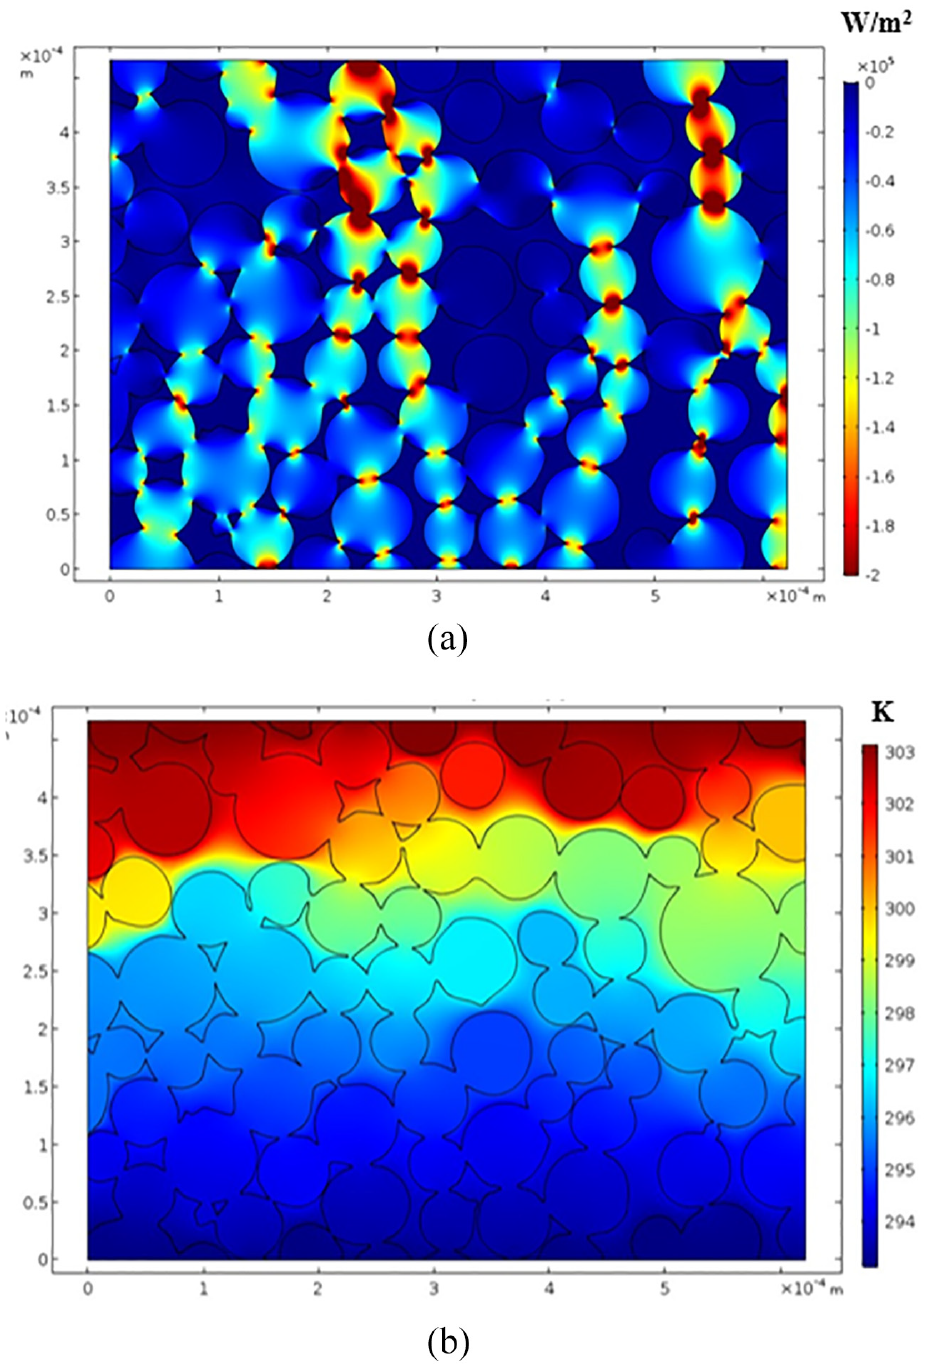
Figure 5(a) shows temperature contours inside the powder and melted regions of the layer during 3D printing while Figure 5(b) shows von Mises stress contours in the printed new layer. The temperature remains high in the melted region and the high temperature region extends over the region irradiated by the high intensity beam. Because of the movement of the 3D printed substrate layer during high intensity beam heating, temperature profiles do not appear to be a symmetric reference to the high intensity beam central line. In this case, high temperature region extends behind the high intensity beam while forming a tail like heated region. Temperature well exceeds the liquidus temperature in the heated region; however, excessively high temperature region is limited with the 1/e points of the high intensity beam (∼ 60 µm). In this case, the high intensity beam resulted in an excessive rise in the temperature in the melt pool during the printing. The high temperature region extends toward the second layer where the alloy powders are deposited. It should be noted that the influence of the previously formed printed layer on the temperature and stress field corresponding to the layer to be printed (on the top of the previously printed layer) is considered. Consequently, the simulations are carried out for the second layer where the loose particles are deposited. In this case, the first printed layer is assumed to be solidified and the temperature is kept just below the melting temperature of the alloy. Prior to melting, the particles are loose on the surface of the previously formed printed layer; therefore, von Mises stress remains zero in this section of the layer to be printed. In addition, the hydrostatic pressure in the melt pool is considerably lower than the thermal stress developed in the solid part of the workpiece because of the shallow depth of the melt pool. Consequently, the melted zone is removed from the stress contours as shown in Figure 5(b). von Mises stress attains high values in the region where the temperature gradient remains high. This takes place in the close region of the melt pool bottom. von Mises stress reduces in the region away from the melt pool bottom.
Temperature and von Mises stress contours: (a) temperature contours and (b) stress contours.
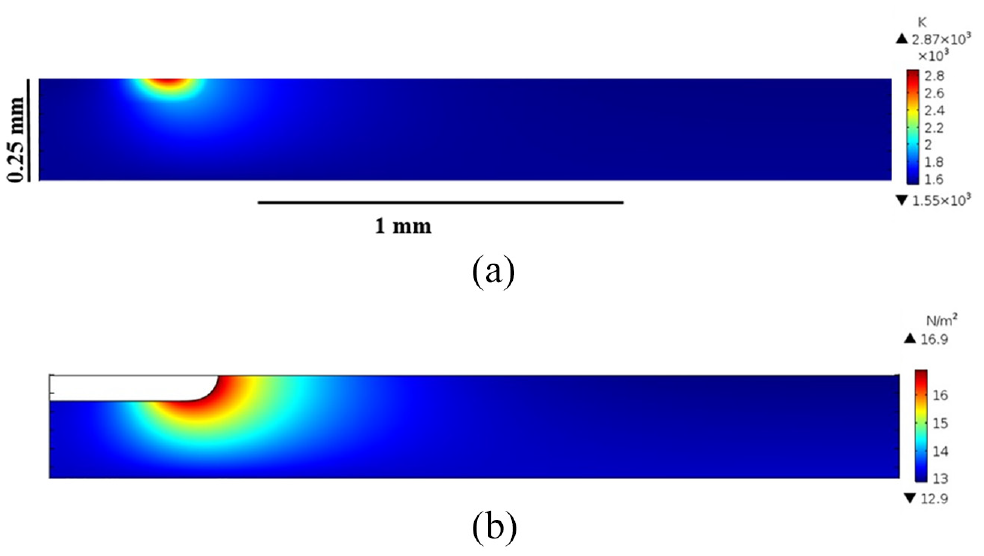
Temperature-dependent modulus of elasticity is used in the stress simulations; therefore, the stress distribution is influenced by the temperature variation in the printed layer. Moreover, in the case of the liquid fraction (Figure 6), the liquefied region extends both in vertical and horizontal directions. The layer formed from the loose powders totally melts above the initially printed layer. In addition, the melt layer slightly extends into the top surface of the initially printed layer because of the occurrence of high temperature in this region. Although the solidus and liquidus temperature difference is small (ΔT = 55 K), the presence of the mushy zone can be clearly observed from the contours, despite the fact that the mush zone size is small at the interface between the melted liquid and surrounding solid. This is more pronounced in the region behind the location of the high intensity beam. This behavior is related to the heat transfer by conduction from the melt zone to its solid neighborhood during the printing. In this case, the mush zone occurs in the neighborhood of the high intensity beam as compared to its counterpart in front of the high intensity beam. In addition, thermal properties vary with temperature (Table 1); this effects the temperature distribution and the size of the melt pool in the printed region. Moreover, the horizontal extension of the melted zone is associated with the scanning speed of the workpiece during 3D printing. It should be noted that 3D printing is realized at a constant high energy beam speed on the surface (0.1 m/s).
Contours of liquid fraction in the melted region. Liquid fraction 1 represents the liquid phase, liquid fraction in between 0 and 1 corresponds to the mushy zone, and liquid fraction 0 is the solid phase.
Figure 7 shows temperature distribution along the x-axis (horizontal direction) at the surface of the printed layer. The temperature remains the maximum at the center of the high intensity beam; however, the decay of temperature decays sharply from the maximum value along the x-axis. However, the slope of temperature reductions in the front and the behind of the high intensity beam center are not the same, which is related to the scanning speed during the printing process. The peak temperature attains low values as the depth from the surface increases provided that temperature remains higher than the liquidus temperature. Consequently, the liquid phase sensible heating occurs in the melt pool. At the melt pool solid interface in the region behind the high intensity beam, temperature reduction is relatively gradual than that of in the melt pool. This is because of the thermal conductivity; in which case, once the melt is solidified, thermal conductivity increases to the thermal conductivity of the bulk layer. However, in the front region of the high intensity beam beyond the melt pool, the layer remains in the powder form and thermal conductivity becomes low. This gives rise to a large temperature gradient in this region.

Temperature variation along the x-axis for various z-axis locations. The middle represents the middle height of the printed layer, interface corresponds to interface between the printed and initially printed layers, and half thick represents the half-thickness of the previously printed layer.
Characterization of printed layer and scratch resistance of printed surface
Figures 8 and 9 show SEM micrographs of 3D printed layer top surface and crosssection of the printed substrate. The surface morphology shows irregular texture with some pores. The average roughness of the surface is in the order of 13.6 µm. The possible explanation for the irregular appearance of the surface texture is that the air trapped in between the powders forms the irregular gaps at the surface even though the molten liquid fills these gaps. In addition, the pressure of the air trapped in between the loose powders increases significantly because of the temperature increase during the printing. This, in turn, allows air bubbles departing from the bottom side of the layer while forming the pores like structure once they escape from the surface. The pores like structures do not confine in a circular shape rather odd shapes, which can be noted from SEM micrograph (Figure 8(a)). Since the molten layer formed from the loose powders has high temperature, particularly in the neat region of the high intensity beam, the holes formed in the molten layer, by the departing air bubbles at high pressure, filled by the molten liquid. During the motion of the workpiece, the high beam intensity beam moves away from the initially high temperature molten surface. This causes temperature drop and partial solidification of the surface under the convection cooling. In the case of the departing second air bubble at high pressure, the air bubble escapes from the liquid side of the initially formed pores structure while expanding the hole geometry toward the molten site. This behavior deforms the geometry of the initially formed hole site while generating odd shape pore geometry on the surface. In addition, the gaps in between the loose particles have odd shape appearance and semi-attached air bubbles can also depart from the layer bottom and can escape from the surface while generating the odd shape pores sites on the surface. Moreover, high cooling rates from the surface, under the convection and radiation heat transfer, result in dense structures at the surface and formation of the fine size protruding pillars like textures at the surface (Figure 8(b)).
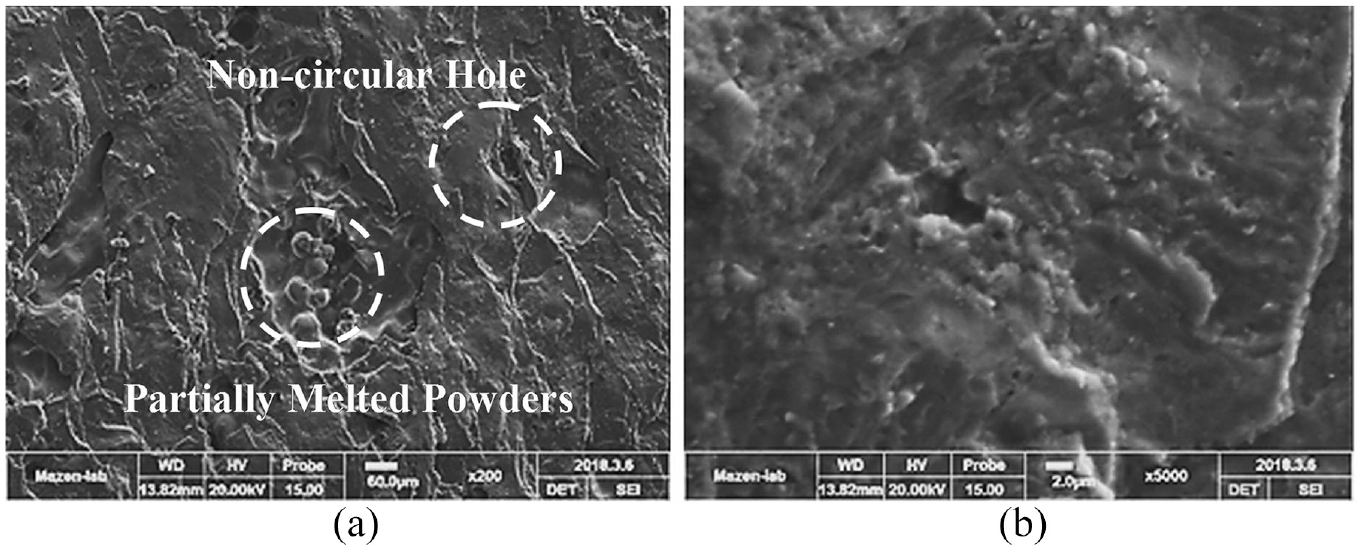
SEM micrographs of 3D printed surface: (a) non-circular hole and partially melted powders, and (b) pillars and dimples like structures.

SEM micrographs of the cross-section of printed layer: (a) large columnar structure, (b) large and small lamellar structures, (c) demarcation lines, and (d) partially melted and solidified powder.
The microhardness varies along the surface; however, this variation is small, that is, the average microhardness of the surface is 390 ± 10 HV and it is higher than that of the solid Ti6Al4V alloy (340 ± 10 HV). The attainment of high surface hardness is associated with the high cooling rates from the surface during the printing process; in which case, the spacing of the β phase becomes smaller in the surface region (due to high cooling rate) than that of the interface between the newly and previously printed layer. This is also noted in the early study. 23 The printed surface is free from cracks even though the high cooling rate takes place at the surface. The crack free surface is attributed to the underlaying initially formed printed layer. In this case, the initially formed layer acts like a heated zone while creating the self-annealing effect on the top printed layer via keeping the interfacial temperature high during the printing process. In the case of printed workpiece cross-section (Figure 9), columnar grains and martensitic formations are the main structures in the re-solidified printed region (Figure 9(a)). The columnar grain formation is associated with the cooling rate due to heat dissipation particularly from the surface of the printed layer to the gas ambient and heat diffusion from interface toward the initially formed underlaying layer. In this case, during the solidification process, the growth of the columnar grains initiates epitaxially in the mid-section of the printed layer where the cooling rate is relatively low. 24
The grains develop at a slant angle to the printing direction (normal to the high intensity beam direction) in the surface region. This is related to the high cooling rates in the surface region. 25 In this case, colonies of parallel and fine lamellae structures take place (Figure 9(b)). However, at the bottom side of the printed layer, lamellae structure becomes larger (Figure 9(b)) because of the relatively slow cooling rates. The interfacial temperature between the newly printed and the previously printed layers remains small (Figure 5(a)). In addition, the demarcation line becomes visible in between the powders (Figure 9(c)), which takes place because of the excessive air gap between the powder particles during the melting. It can cause high cooling rates as similar to that is observed at the boundary of the heat affected zone. In addition, partially melted particles are observed toward the edges of the printed layer (Figure 9(d)).
Figure 10 shows X-ray diffractogram of 3D printed Ti6Al4V alloy. The peaks of α—and β-phases can be observed from X-ray diffractogram. The hexagonal α-phase experiences an allotropic transformation to a body-centered cubic β-phase at about 1165 K, which becomes stable at the melting temperature. In general, α—β interface acts like an effective site for stopping the dislocation and crack propagation. 26 In addition, the increase of β-phase volume fraction gives rise to the flow stress while minimizing the crack formation. 27 However, the presence of TiO peak reveals that oxidation of titanium occurs during the printing. This may be related to one or all of the following: (i) the presence of small oxygen concentration in argon during the printing and (ii) the presence of oxygen in alloy powder, which releases during the printing and causes the oxidation reaction. The presence of oxygen in the workpiece printed and the alloy powder is evident from EDS data, which are given in Table 2. On the other hand, because of the high surface texture height and varying surface roughness of the printed layer, the surface of the printed layer is grounded at a slow rate using the coolant to reduce the texture height at the surface prior to the friction coefficient measurements.
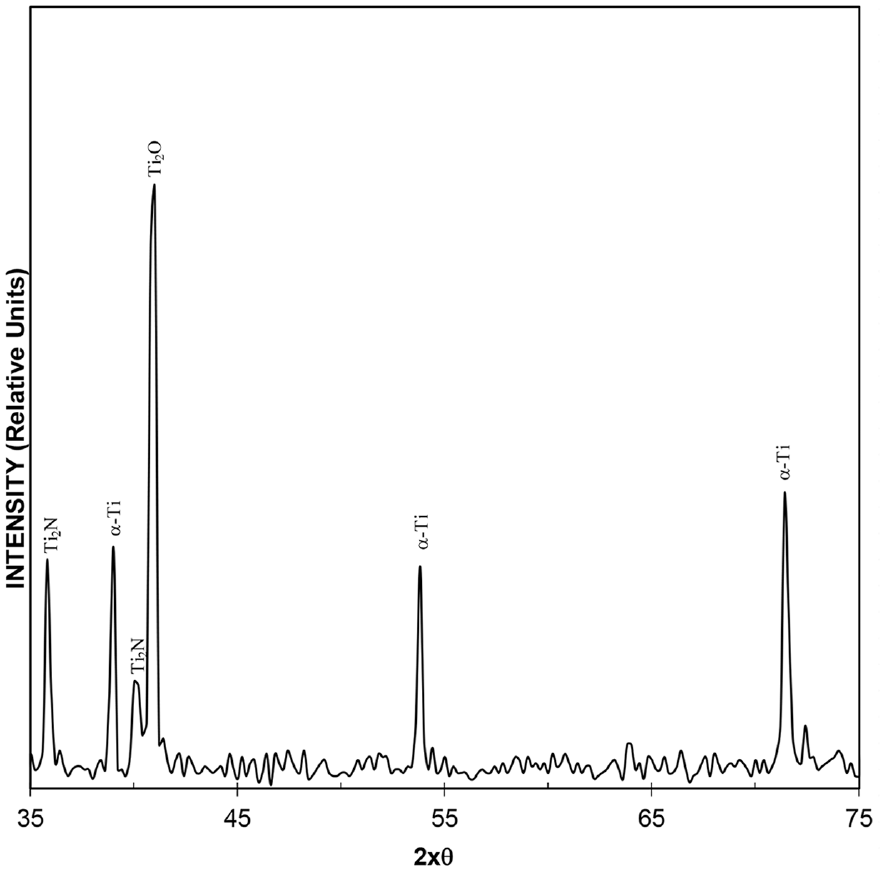
X-ray diffractogram of the printed layer.
The friction coefficient of the briskly grounded printed surface is obtained from the micro-tribometer data. The friction coefficient of the solid Ti6Al4V alloy is also presented for comparison. Figure 11 shows the friction coefficient of the printed and the solid as received alloy surfaces. The friction coefficient of the printed surface is slightly lower than that of the solid alloy surface. This behavior is related to the microhardness increase on the printed surface. Nevertheless, the difference between the friction coefficients for both samples is small. Moreover, the small wavy appearance of the friction coefficient takes place for the printed surface along the scratch length. This is associated with the presence of few pores like textures on the printed surface, which influences the scratching pin position on the surface while causing waviness appearance of the friction coefficient.

Friction coefficient of as-received Ti6Al4V alloy and 3D printed layer.
Conclusion
3D printing of Ti6Al4V alloy powders is considered. Morphological structures and metallurgical changes in the printed layer are investigated incorporating the analytical tools. The texture of the printed surface is characterized by incorporating the AFM line scan across the surface. Temperature and stress fields in the printed layer are simulated after incorporating the experimental conditions. Microhardness and friction coefficient of the printed surface are determined utilizing the micro-tribometer. Since the loose particles on the surface contain air gaps prior to printing, thermal properties of the powder are evaluated using the air fraction obtained from the SEM micrographs. The thermal conductivity of the loose particles with the presence of air gaps is determined by incorporating the virtual experiments. It is found that the thermal conductivity of the layer composing of the loose alloy particles (1.7162 W/mK) is considerably smaller than that of the solid bulk of the alloy (12.4 W/mK). This alters the heat diffusion and melt thickness in the printed layer when loose particles are presented; in which case, temperature gradient changes along the melted surface and the solidified melted material. Since the loose particles are considered to be located on the previously printed layer, interfacial temperature between the melted particles and the previously printed layer remains high. This in turn creates a self-annealing effect while eliminating the micro-cracks in the printed layer. The maximum von Mises stress remains low during the printing process. In addition, the transformation of α-phase into β-phase of titanium softens the printed layer contributing to the stress minimization and crack free layer formation. The growth of the columnar grains initiates epitaxially in the mid-section of the printed layer; however, the grains grow at a slant angle with respect to the printing direction in the surface region because of the high cooling rates. The lamellae structure becomes larger at the bottom side of the printed layer due to the gradual cooling rates. The demarcation line is observed in between the powders, particularly at the edges of the printed layer, which is associated with an excessive air gap between the powder particles which alters the cooling rates. The microhardness of the printed surface is higher than that of the commercially produced solid alloy. The oxidation reaction takes place during the printing, which is evident from the X-ray diffractogram peak, i.e. TiO compound is formed. This is related to the presence of oxygen either in the assisting gas argon or in the alloy powder. The friction coefficient of the printed surface is lower than that of the commercially produced alloy surface.
Footnotes
Handling Editor: James Baldwin
Declaration of conflicting interests
The author(s) declared no potential conflicts of interest with respect to the research, authorship, and/or publication of this article.
Funding
The author(s) disclosed receipt of the following financial support for the research, authorship, and/or publication of this article: The authors acknowledge the financial support of King Fahd University of Petroleum and Minerals (KFUPM) in Saudi Arabia, Gazi University and TAI (SAYP Project DDKIG1) in Turkey and King Abdullah City for Atomic and Renewable Energy (K.A.CARE) to accomplish this work.