
Abstract
In this article, a new feature extraction method is proposed for gear fault diagnosis by combining the empirical wavelet transform, Hilbert transform, and cosine similarity metric. In the first place, a number of empirical mode components acquisitions are done, using empirical wavelet transform. Since different empirical modes have different sensitivities to fault, not all of them are needed for further analysis. Therefore, the most sensitive empirical modes are selected using the cosine similarity metric method. Hilbert transform was then used to obtain the envelope for amplitude modulation. Finally, spectral analysis using fast Fourier transform is applied on the obtained envelope. Gear test rig with gears under different fault states has revealed an effective outcome and a solid stability of this new approach. The obtained results show that our approach is efficiently able to detect and expose the gear faults signatures, that is, it highlights their frequencies and the corresponding harmonics with respect to the rotary frequency. Furthermore, this proposed method demonstrates more satisfactory and advantageous performances compared to those of fast kurtogram, or the autogram.
Keywords
Introduction
The economic situation of any industrial institution and its reputation are directly related to the quality of its manufactures, the increase in production capacity, and the preservation of environment safety. This can be achieved through the development of methods and systems that allow early detection of any damage that affects the machine.
Gears are one of the most important components of industrial machinery, especially in rotary machines. Statistics show that 60% of transmission machines failures were generated by gears problems. 1 Thus, a solid condition monitoring system that can detect earlier malfunctions is extremely necessary. 2 Gear faults detection and diagnosis are mainly based on vibration signals analysis. These signals carry important dynamic information and data about the state of the machine, such as gear fault features that can be extracted from them.3,4
The reliability of a diagnosis system depends mainly on the extracted features exactitude and precision, which makes it the most important and difficult part of the job. Therefore, it is necessary to efficiently obtain the vital features that robustly enable the early detection of gears defects from vibration signals. 5
Traditionally, gear defect detection is derived from the vibration signal frequency analysis. However, their characteristic signatures are known to be weak, covered by the natural frequency of the machine and often overwhelmed by noise with obvious non-linear and non-stationary behavior. 6
To overcome this problem, many methods for gear fault diagnosis have been proposed such as fast kurtogram,7–9 autogram,10,11 empirical wavelet transform (EWT),12,13 and empirical mode decomposition (EMD).14,15 These methods have been successfully established to give powerful proofs that help to make the right and the earliest decision for maintenance and troubleshooting.
The EMD and EWT methods are known to be used on a large scale in diagnosis field, especially for non-stationary vibration signals analysis.16,17 Both EMD and EWT are used to decompose a signal into various mode functions (intrinsic mode functions (IMFs) or EWTs). However, not all mode functions (IMFs or EWTs) have the same sensitivity to the related faults.
The mode function selections usually depend on the user’s experience by visual inspections. Recently, some researchers use the kurtosis value to select the analyzed component, such as the kurtogram developed by A Jérôme 18 or the autogram developed by M Ali and Alessandro. 11
These two recent methods are dedicated to gear and bearing faults diagnosis. They have proven their ability to detect a certain type of defects. However, in some cases, both methods reach their limits. This is due to the use of kurtosis as selection tool. Knowing that the kurtosis value depends on the pulse intensity created by the defect makes it difficult to detect a fault produced by low intensity pulses. This is the case of chipped tooth in length (CTL) and tooth root crack (TRC) defects.
Ricci and Pennacchi 16 treated this problem differently by introducing the metric index to assist the IMF selection. The use of the automatic IMF selection to deal with spiral bevel gears vibration signals provided satisfactory results. Nevertheless, the specific parameter (k) used in Ricci and Pennacchi 16 related to the mechanical system and the threshold default should be specified initially.
Lei and Zuo 19 introduced a different way to separate all IMFs into two clusters where the effectiveness of the IMF selection was demonstrated both numerically and experimentally. The only issue about this method is that the healthy state signal must be considered. After adequate consideration of these issues, a new feature extraction and fault diagnosis method based on EWT and cosine similarity metric (CSM) is proposed in this article.
Cosine similarity measure20,21 which is the most widely used technique for similarity measurement will be utilized for the sensitive EWTs selection. After that, an envelope analysis of the selected EWT is employed.
This article is basically structured and organized as follows. Section “Basic concepts of involving signal-processing approaches” contains some relevant theories that support the proposed method, including EWT, Hilbert transform, and cosine similarity measure. Six states of gearbox faults are studied and investigated in section “Experimental verification.” A comparison study with recently developed methods such as fast kurtogram and autogram is presented. The obtained results are discussed in this same section. Finally, some important conclusions and future work on this subject are commented.
Basic concepts of involving signal-processing approaches
EWT
The EWT method allows the extraction of amplitude modulated–frequency modulated (AM–FM) components (modes) fk s(t) of the input signal f (t)
22
such that

This can be possible when using a set of N wavelet filters (one low pass and (N − 1) band pass).
The idea is that the wavelet filter bank relies on the Fourier supports detected from the processed signal spectrum contained information by finding the local maxima and taking the support boundaries ωi as the middle between successive maxima. 22
Figure 1
Fourier axis segmentation and EWT wavelets construction.
The empirical wavelets are considered as band pass filters on each

For arbitrary n > 0, their Fourier transforms, that is, the empirical scaling function


The function β(x) is given as follows

This property is mostly satisfied by this following function

Once the tight frame set of empirical wavelets is built, EWT and
The detail coefficients are the inner products result of the input signal and the empirical wavelets
22


The approximation coefficients are obtained by the inner product with the scaling function

So, the signal is decomposed into various empirical modes (EMs) fk that are defined as


Thanks to EWT invertibility, the signal can be reconstructed as follows

Since the initial goal of the EWT is to get decomposition as depicted in equation (1), comparing equation (1) with equation (11) leads us to deduce that each mode fk in equation (1) corresponds to equations (9) and (10).
Hilbert transform
Hilbert transform is the convolution of signal with the function 1/πt. Every extracted mode EM has its associated analytical signal z(t) that is set as follows

where

Thus, the instantaneous amplitude and frequency are, respectively, stated in equations (14) and (15)


In gears condition monitoring, and for almost all faults, we must modulate our vibration signal in term of amplitude. The instantaneous amplitude of each EM is considered as its envelope analytical signal. It provides useful and beneficial information that can contribute in the signal’s intrinsic characteristics investigation. Therefore, the computed envelope signal A(t) is mainly used to support our analysis.
Effective EMs selection using CSM
The changes of the frequency components contained in each EM component are usually related to the variation of signal f(t). Some of these components may have a direct relation with the defect, when others may not.
Usually, using the obtained EMs from EWT for fault diagnosis provides different results for various EMs. Therefore, the implementation of sensitive EMs selection methods is highly important to distinguish the fault-related EMs from the useless ones. 23
In order to perform an adequate fault detection and diagnosis, it would be necessary to select sensitive fault-related EMs for processing instead of the whole signal. The selection process is automatically and effectively ensured by employing the conventional measuring method named CSM. This method has been widely used to measure vectors similarity. It is originally defined as the inner product of two vectors
The original similarity metric between the two vectors is formally established as follows
20
It is clearly noticed that the magnitude of similarity between two vectors is reflected by the cosine value. The cosine of the angle between two vectors is used to quantify the “similarity” between original signal and each obtained EMs.
Among numerous applications of the cosine similarity like text classification, speaker recognition, information retrieval,20,21 it is usually about vectors with non-negative elements, such as weights of features. In this way, the magnitude usually lies in the interval between 0 and 1. Thus, the smaller the cosine value, the lower similarity degree of two vectors would be, and vice versa. However, the substitution of the vectors in equation (16) by the EMs will generate negative similarity values since EM signals elements contain both positive and negative values.
24
Consequently, the similarity magnitude ranges within [–1, 1]. It is intuitive that to calculate the similarity between the original and the EM component, when the cosine similarity value is equivalent to 1, it has only to imply that the maps between the two are identical.
24
When the similarity is calculated between the original and the negative EM signals, its value will be equal to –1. It can be considered as a negative correlation between the two signals. For further understanding of the CSM, it should be modified as
24

The final step is to determine the similarity degree between the two signals
The previously mentioned steps of signal processing and fault detection are briefly described in the flow chart in Figure 2
Relevant flowchart of the proposed method for gear faults diagnosis.
Experimental verification
Experiments were run based on the dataset provided by the laboratory of contact and structure mechanics at INSA Lyon, France, aiming to test and verify the effectiveness of the proposed approach. 25
Experimental system description
Gear vibration testing experimental apparatus is shown in Figure 3
(a) Experimental gearbox test rig and (b) gearbox single stage gear structure.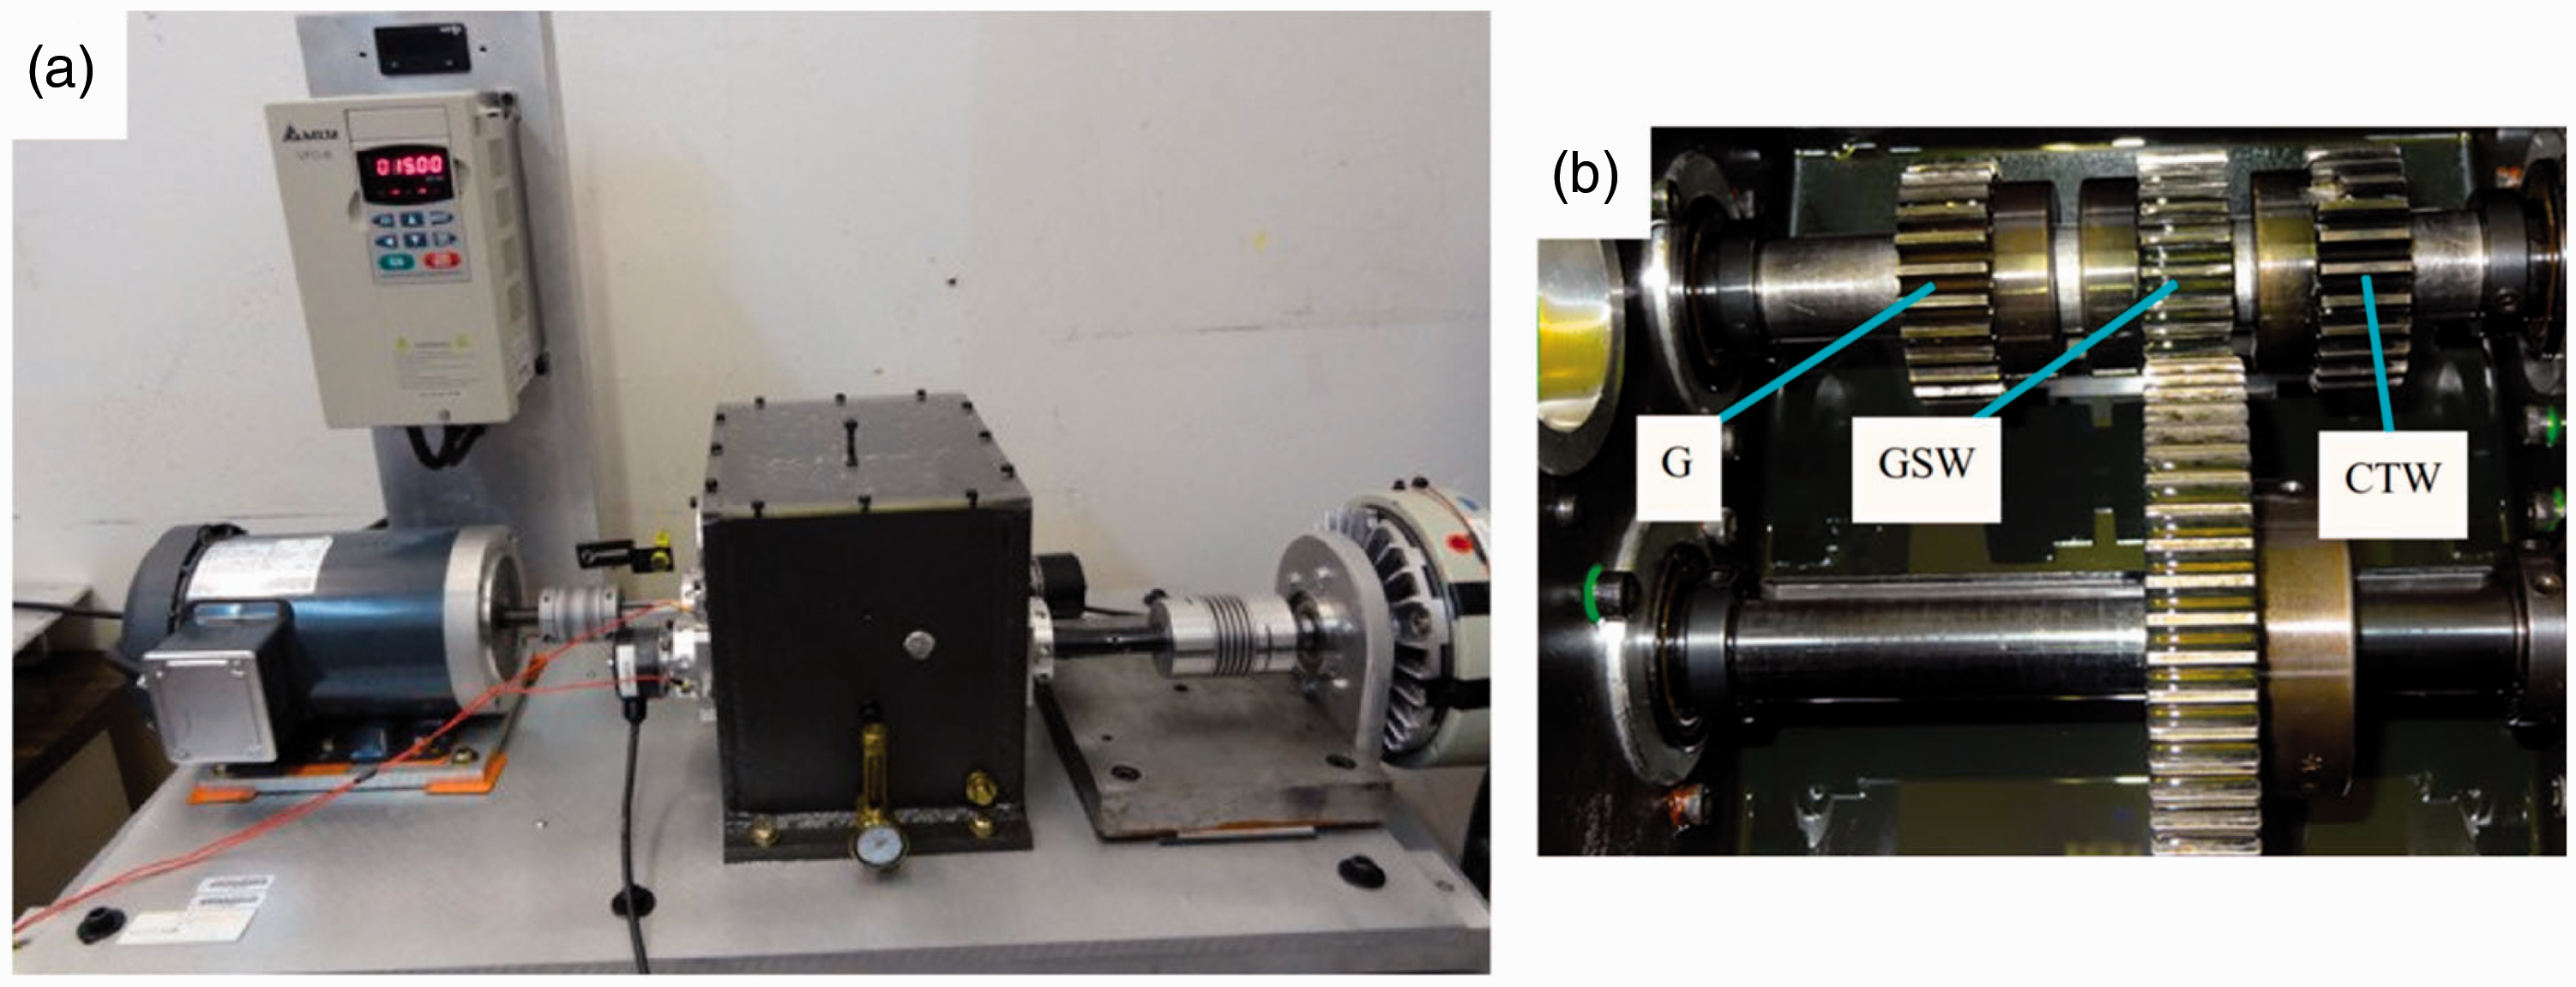
Gearbox torque transmission passes through the coupling where several pinion fault configurations were assembled. After the reducer outputting, through gear coupling, the torque will be transferred to a magnetic powder brake that is capable of generating different resistive torques. 25
The effectiveness of this method can be verified by considering a healthy pinion and five faulty ones with different defect types: the healthy one is referred as good (G), a TRC, a CTL, a chipped tooth in width (CTW), a missing tooth (MT), and general surface wear (GSW) as shown in Figure 4
Six pinion states: (a) G, (b) GSW, (c) CTL, (d) CTW, (e) MT, and (f) TRC. Geometrical parameters and material of the gears system.

A 100-mV/g sensitivity accelerometer was radially mounted on the bearing case of the output shaft for vibration signals recording. The accelerometer channels have a time sampling frequency of is 125 kHz, the cut-off frequency of the anti-aliasing filter is 27 kHz and the acquisition duration is 30 s.
The acceleration vibratory signals shown in Figure 5
Gear box pinion vibration signals for a healthy and five different faulty states: (a) G, (b) GSW, (c) CTL, (d) CTW, (e) MT, and (f) TRC.
It is noticeable from Figure 5(c) and (f) that the CTL and TRC faults do not have a significant effect on the vibration signal. On the other hand, GSW, CTW, and MT time signal energies have significantly increased compared to the healthy state. Localized defect signatures are expressed by the presence of repetitive shock waves for each revolution period; this is shown in Figure 5(b), (d) and (e).
Comparison between the proposed method and fast kurtogram and autogram
The robustness of the proposed method is verified by implementing two methods that are used on a large scale (kurtogram and autogram) and then comparing their performances with that of Hilbert empirical wavelets transform combined with cosine similarity metric (HEWT-CSM) for gear feature extraction. The most similar EMs to the original signal are considered the most sensitive. Thus, they are the ones which contain the majority of the information since the cosine similarity measure is a dot product between the original signal and the EMs.
In Figures 6
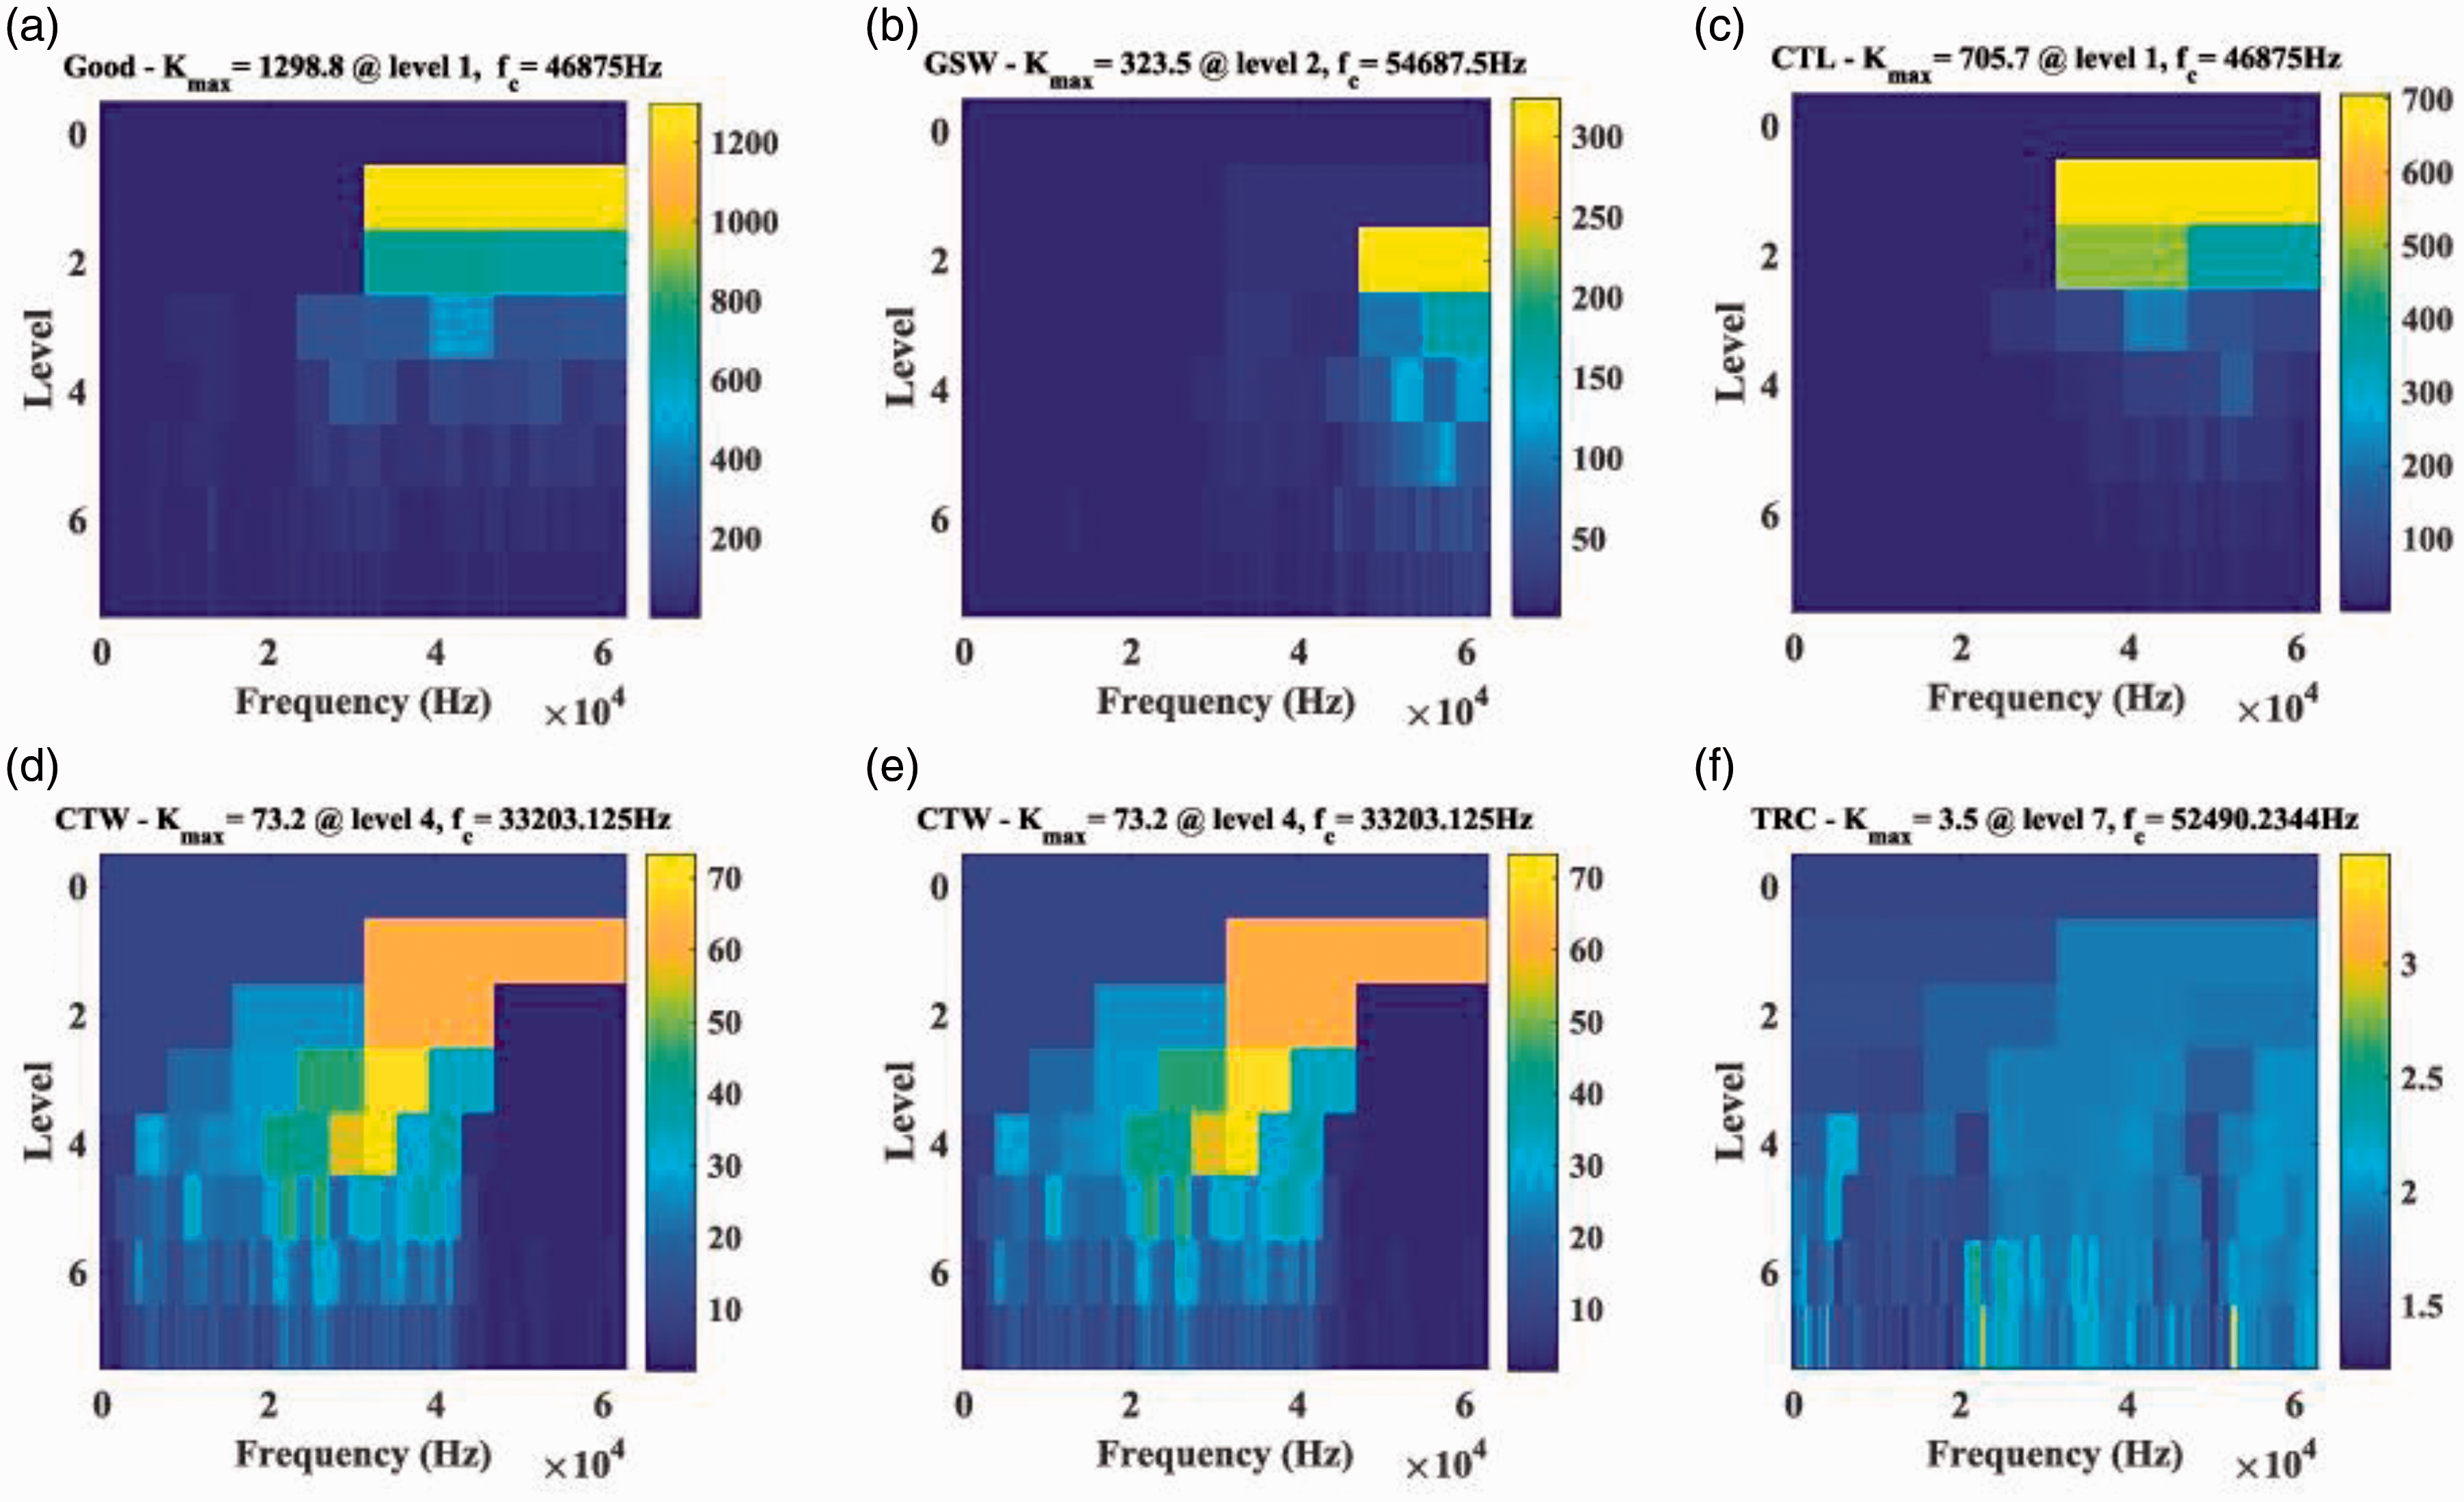
Fast kurtogram of the vibration signals for a healthy and different faulty states: (a) G, (b) GSW, (c) CTL, (d) CTW, (e) MT, and (f) TRC. Spectrum envelope of the corresponding filtered signal provided by the Fourier transform for a healthy state and five different faults: (a) G, (b) GSW, (c) CTL, (d) CTW, (e) MT, and (f) TRC. Autogram of the vibration signals for a healthy and five types of faults: (a) G, (b) GSW, (c) CTL, (d) CTW, (e) MT, and (f) TRC.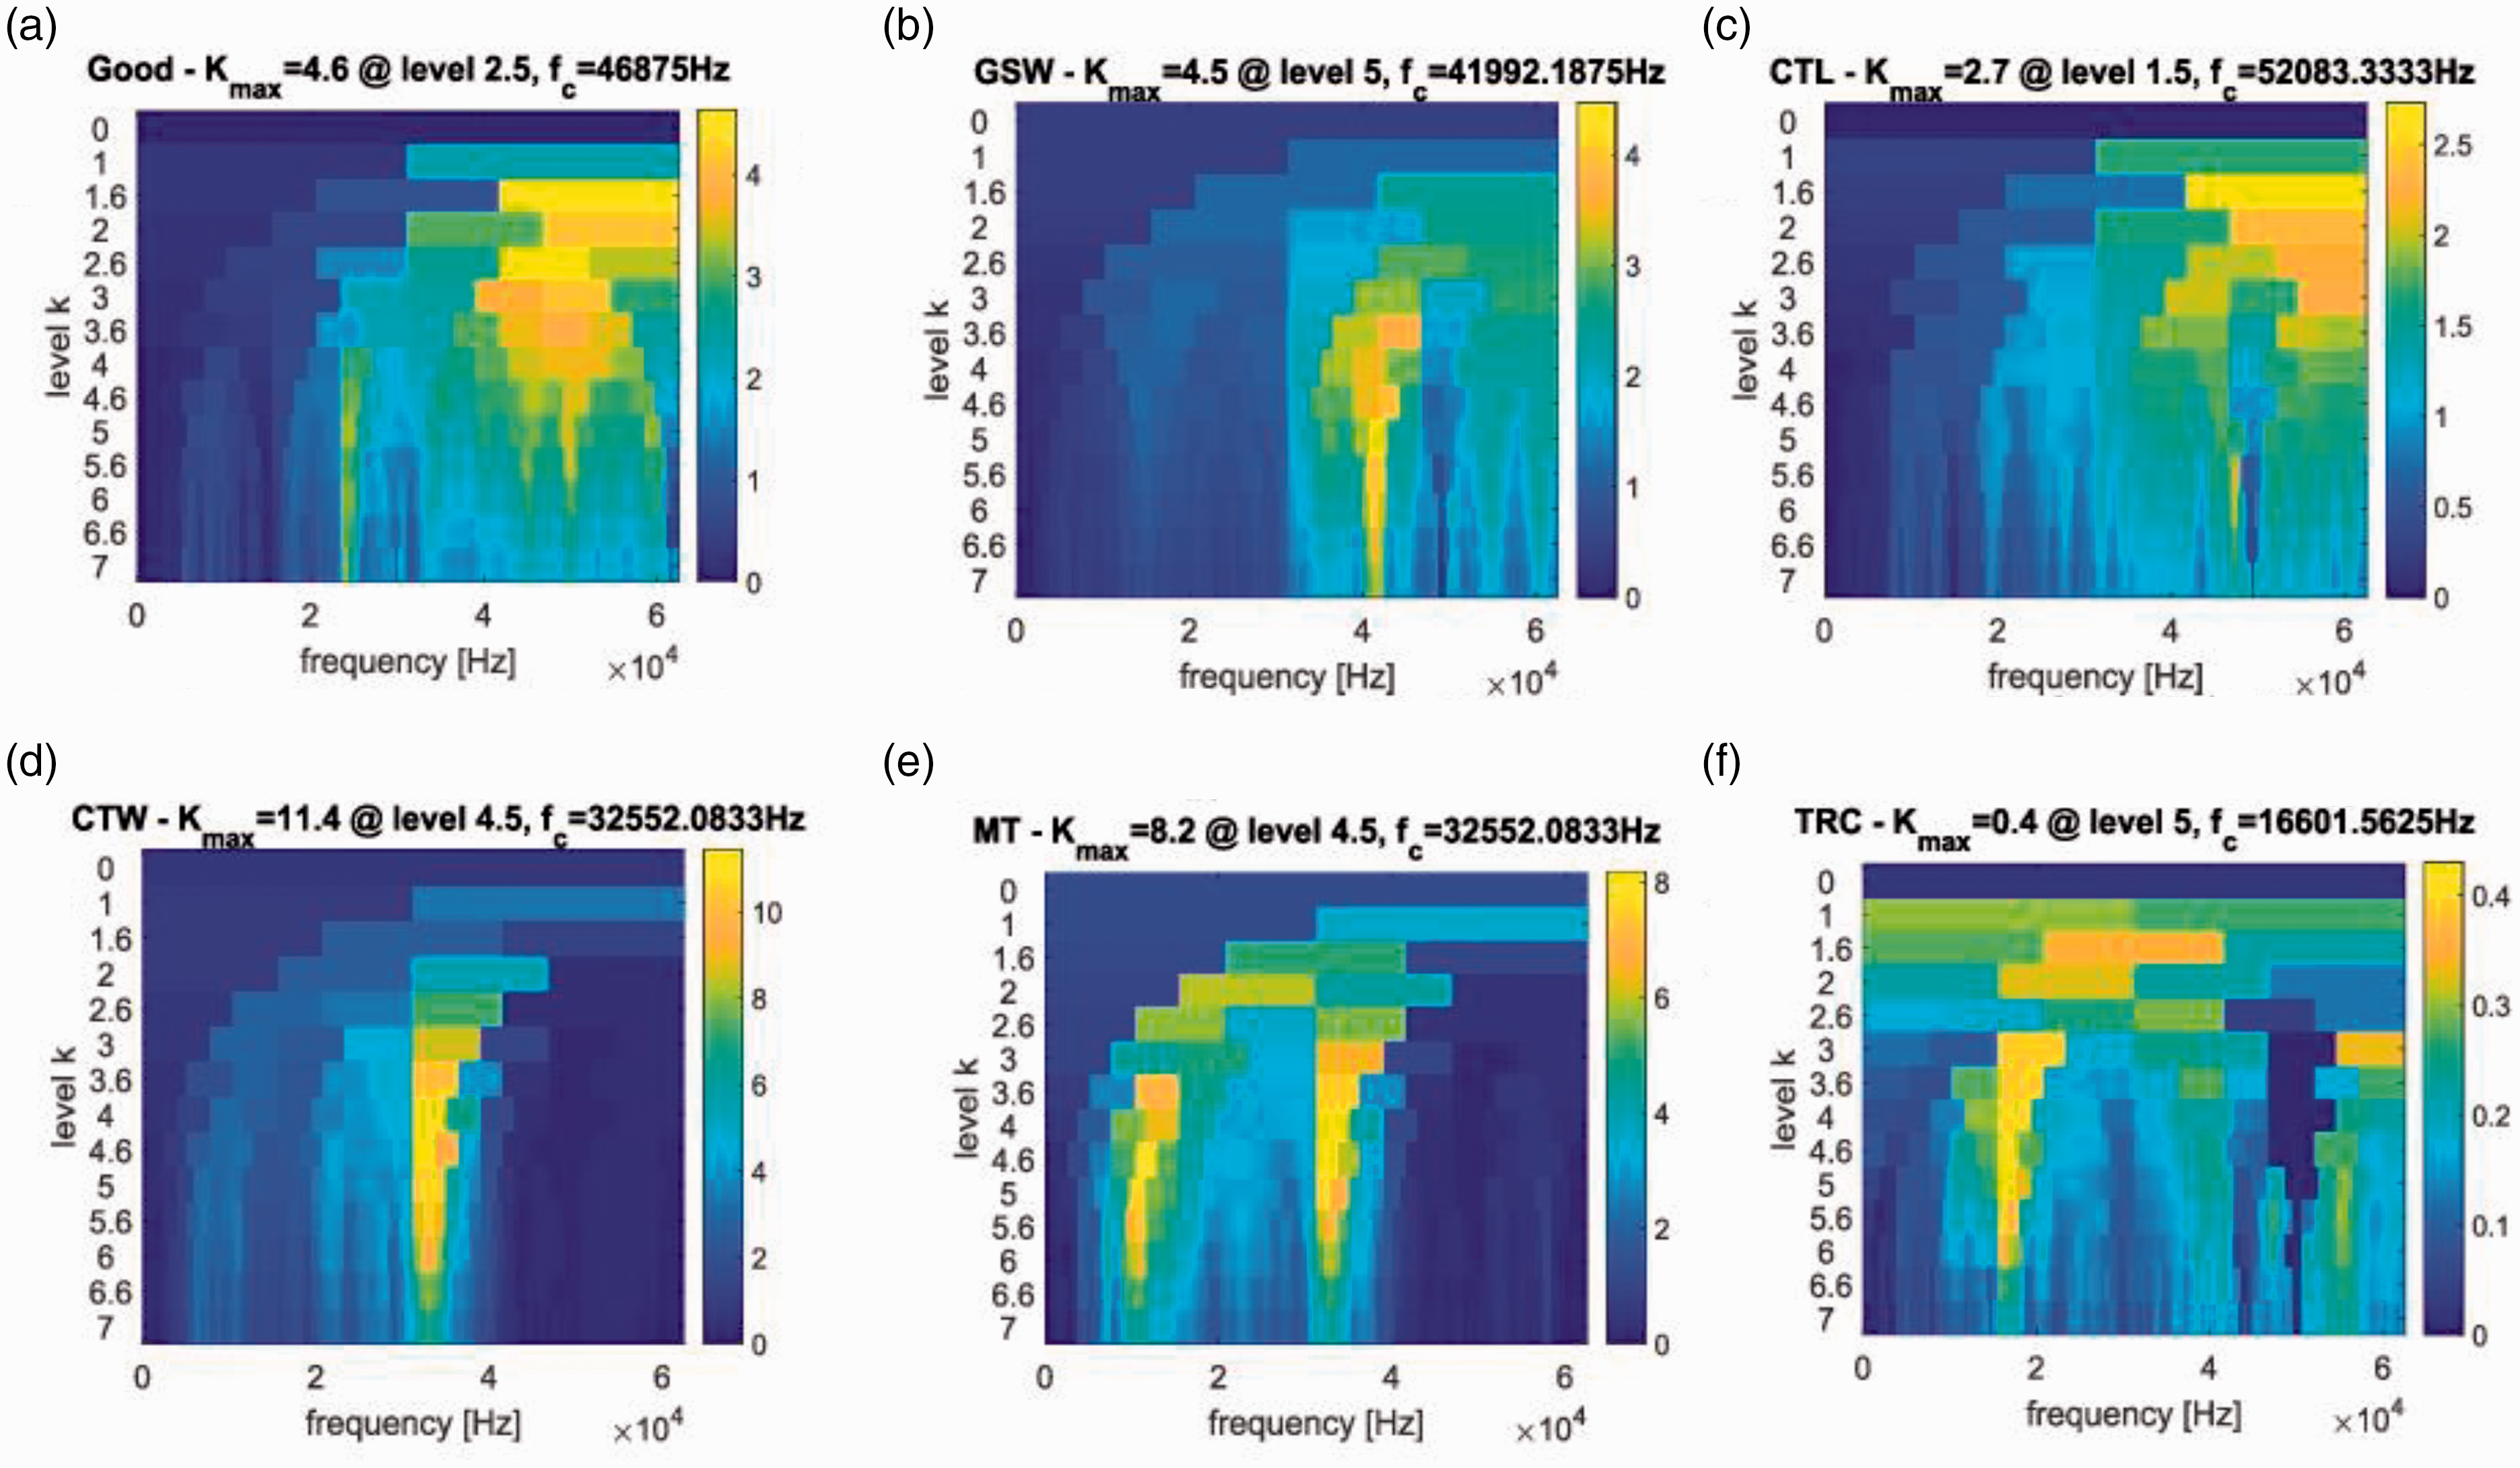

Also, it is noticeable that for the rest of the faulty gears, the defects manifest as a multiple of the rotational frequency kfr on their corresponding spectra.
In Figures 8 and 9
Squared envelope spectrum provided by the Fourier transform for a healthy gear signal and five different faulty ones: (a) G, (b) GSW, (c) CTL, (d) CTW, (e) MT, and (f) TRC.
We can observe that it is impossible to predict the presence of some defects in the gearbox system such as CTL (Figure 9(c)) and the TRC (Figure 9(f)). Thus, it is important to develop a new signal-processing strategy to solve this problem. Then, the similarity between each EM and the original vibration signal is evaluated by the CSM method to identify the most sensitive EM.
Results of CSM application on a good and five faulty gears states.
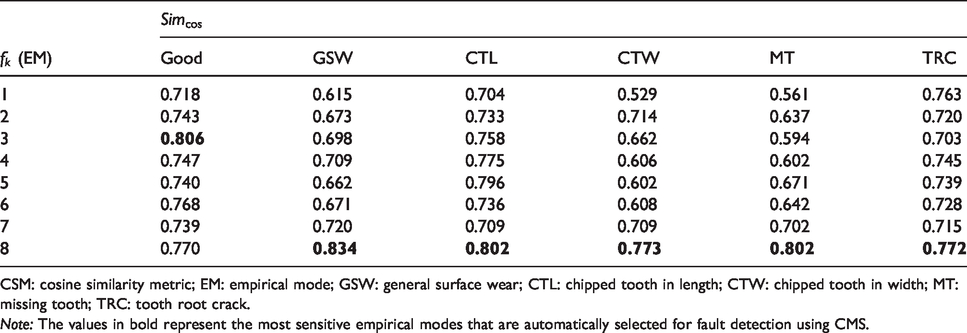
CSM: cosine similarity metric; EM: empirical mode; GSW: general surface wear; CTL: chipped tooth in length; CTW: chipped tooth in width; MT: missing tooth; TRC: tooth root crack.
Note: The values in bold represent the most sensitive empirical modes that are automatically selected for fault detection using CMS.
CSM results interpretation implies that EM 3 (f3) for the undamaged gear and EM 8 ( Sensitive EMs for: (a) G, (b) GSW, (c) CTL, (d) CTW, (e) MT, and (f) TRC.
Each selected EM has instantaneous amplitude that is considered as its envelope signal. It’s a time varying signal that provides useful information for the original signal’s intrinsic characteristics investigation. So, in order to support our analysis, the envelope signal A(t) computation is necessary. Finally, in order to perform a reliable diagnosis, fast Fourier transform (FFT) is implemented and used to process each envelope of each sensitive EM component.
After applying our approach on the selected EMs signals for damaged and undamaged conditions, some anticipated results are obtained. The use of FFT on sensitive EMs gives the spectra presented in Figure 11
Different envelope spectrum analysis results of (a) G, (b) GSW, (c) CTL, (d) CTW, (e) MT, and (f) TRC.
This indicates and confirms the effectiveness of the proposed approach for fault diagnosis when dealing with gearbox vibration signals.
Conclusion
This article presents a technology that combines many mathematical methods involving EWT, Hilbert transform, sensitive EM selection, and FFT to deal with the vibration signals from various gear fault states. Based on experimental tests on healthy and defective gears, this study lies essentially on these main fundamentals:
Since vibration signal is the core analysis source, it has shown a great capability of highlighting the whole performance for the diagnosis of gearboxes. The automatic selection of the sensitive EMs is ensured using CSM method. It should be pointed that not all EWT EMs extraction are sensitive and closely to the fault, many of them are useless and will even misguide the fault detection process. An experimental study that includes various gear states has been successfully performed to demonstrate the effectiveness and robustness of the used method. Furthermore, The obtain results were compared to the ones of fast kurtogram and autogram, and showed advantages over these two methods with an extended diagnosis capability. Signal feature extraction was effectively done by applying FFT on the selected EM. Our approach has proved its capability of enhancing fault features, based on the information found in the spectrum where the defective gear can be clearly discovered by the highlighted frequency and its harmonics for each case. Further research topics could employ some new techniques to avoid failure, improve fault identification, and promote its accuracy by focusing on different types of defects with small sizes and lower traceability. This approach could be implemented in real-world industrial machinery where strong background noise always exists and health condition monitoring systems are more than necessary.
Declaration of conflicting interests
The author(s) declared no potential conflicts of interest with respect to the research, authorship, and/or publication of this article.
Funding
The author(s) received no financial support for the research, authorship, and/or publication of this article.
ORCID iDs
Chemseddine Rahmoune https://orcid.org/0000-0003-0388-7455
Boualem Merainani https://orcid.org/0000-0002-1468-4437
Footnotes
Handling Editor: James Baldwin