
Abstract
Rotary machines consist of various devices such as gears, bearings, and shafts that operate simultaneously. As a result, vibration signals have nonlinear and non-stationary behavior, and the fault signature is always buried in overwhelming and interfering contents, especially in the early stages. As one of the most powerful non-stationary signal processing techniques, Kurtogram has been widely used to detect gear failure. Usually, vibration signals contain a relatively strong non-Gaussian noise which makes the defective frequencies non-dominant in the spectrum compared to the discrete components, which reduce the performance of the above method. Autogram is a new sophisticated enhancement of the conventional Kurtogram. The modern approach decomposes the data signal by Maximal Overlap Discrete Wavelet Packet Transform into frequency bands and central frequencies called nodes. Subsequently, the unbiased autocorrelation of the squared envelope for each node is computed to select the node with the highest kurtosis value. Finally, Fourier transform is applied to that squared envelope to extract the fault signature. In this article, the proposed method is tested and compared to Fast Kurtogram for gearbox fault diagnosis using experimental vibration signals. The experimental results improve the detectability of the proposed method and affirm its effectiveness.
Introduction
Gears are often the most important part of rotating machines. They play a fundamental role in transmitting the power and the motion from one shaft to another. Therefore, any unexpected gear failure can reduce the performance of the industrial mechanism. Thence, it is necessary to detect the gear defect to avoid any serious failures. Several methods were used for the condition monitoring of rotating machinery such as temperature, vibration, and acoustic emission (AE). 1 Lately, gear fault diagnosis using vibration signals has been the subject of intensive studies in this field. Vibration signals carry many information about the state of the gearbox. Thus, a multitude of methods using those signals have been developed to extract the fault signature such as Fast Fourier Transform (FFT), 2 Cyclostationary Analysis,3,4 Cepstrum Analysis, 5 Short-Time Fourier Transform (STFT), 6 Wigner–Ville Distribution,7–9 Wavelet Transform (WT),10–12 Hilbert–Huang Transform (HHT),13–15 Local Mean Decomposition (LMD),16–20 Empirical Mode Decomposition (EMD),20,21 Bayesian algorithms, 22 Hilbert Empirical Wavelet Transform (HEWT),23,24 and Envelope Analysis.25,26
In recent years, Envelope Analysis has gained much attention in gear fault diagnosis field. This method separates the low-frequency disturbances around the mechanical resonance of the gear system using a band-pass filter. This is done using an amplitude demodulation technique and Fourier transform. 26 Unfortunately, the main problem of this tool is to find the best filtering frequency band.27,28 Consequently, Spectral Kurtosis (SK) is an important step in solving this problem. SK is an extension of the kurtosis in the frequency domain, where a suitable demodulation frequency band is located to select the maximum impulsivity in the data signal. 29 The SK-based STFT determines the center frequency and the length of the window where the SK value is maximized. 30 These values are represented by a second dimension color map called Kurtogram.29,31 As an alternative method, Fast Kurtogram (FK) has been suggested, in which the bandwidths are divided into rational ratios to apply a fast multi-rate technique to calculate the kurtosis value of the complex filtered signal. 30 Then, the most impulsive frequency band is selected.28–31 However, industrial equipments are complex systems consisting of various devices such as gearboxes, bearings, and shafts that operate simultaneously. 30 As a result, gear fault signatures are often covered by the machine natural frequencies and submerged by high non-Gaussian noise, such as large random impulses or very low noise ratio, making the defective frequencies non-dominant in the spectrum compared to discrete components. 30 Thence, in the previous case, FK will have many difficulties because the kurtosis value decreases as the transient’s repetition rate increases. 30 A modern application, called Autogram, can manage this state by developing the conventional Kurtogram. This method is an effective tool for detecting the gear failure without depth knowledge. Autogram is based on unbiased autocorrelation (AC) to eliminate unrelated signal components such as noise and random impulse contents, and then improves periodic parts that are related to the fault signature. 30 Initially, the data signal is filtered and divided by WT into a dyadic tree structure to obtain different frequency bands and center frequencies. 30 However, the down-sampling operation reduces the ability to investigate the WT coefficients when there is a change in the starting point of the data signal. 30 Maximal Overlap Discrete Wavelet Transform (MODWT) overcomes the dyadic step. MODWT is a new enhancement of Discrete Wavelet Transform (DWT) without the down-sampling process,32–35 although MODWT has the same inconvenience as DWT. The bandwidth frequency used to decompose the signal is non-uniform. 35 Therefore, a substitute method has been developed called Maximal Overlap Discrete Wavelet Packet Transform (MODWPT) to provide a uniform frequency bandwidths and overcome time-variant transformation.32,35 MODWPT decomposes the original signal into many unique components with different levels of resolution. MODWPT also allows the reconstruction of the original signal without losing any information and facilitates the monitoring of the gear state. 35 So, the principle of Autogram is defined according to these steps. First, MODWPT is used to decompose the vibration signal into several frequency bands and center frequencies called nodes. 30 Thereafter, the unbiased AC is calculated for the squared envelope for each node. 30 Autogram then determines the most appropriate frequency band to compute the kurtosis of the squared envelopes. 30 The kurtosis values are displayed in a color map, where the color scale is proportional to the kurtosis value, while the decomposition level and MODWPT frequency are presented in the vertical and horizontal axes, respectively. 30 Finally, the squared envelope, where the kurtosis value is maximized, is selected to extract the characteristic fault frequency using Fourier transform. 30
The aim of this article is to propose Autogram as a new method to enhance the gearbox fault diagnosis ability. Compared to FK, Autogram is more robust signal processing technique which could extract the fault signature even in noisy environment. Experimental results demonstrate the reliability and accuracy of the proposed method for early detection of a chipping fault.
Mathematical background
Autocorrelation
AC is a mathematical tool which compares a signal with a delayed version of itself. AC also allows the detection of repeated patterns in a signal such as a periodic signal disturbed by a lot of noise and then improves the periodic parts that are significantly related to the gear fault. The AC of a signal is calculated as follows: 30
Find the value of the signal at a time t.
Find the signal value at a time t + τ.
Multiple the two values together.
Repeat the process.
Calculate the average of all those products.
Mathematically, for a signal x, the unbiased AC of the squared envelope is calculated with this expression 30

with the delay factor is equal to τ = q/fs and
Spectral kurtosis and Kurtogram
Kurtosis detects the impulsivity faults related to rotating machines by computing the peakedness of the data signal as follows 30

where x(ti) presents the sample at time with ti = 1/fs, and µx is the mean value of the data signal.
The SK value is obtained by calculating the kurtosis value for each frequency band to extract its impulsive and non-stationary components, then find their location in the frequency domain as is expressed in 30
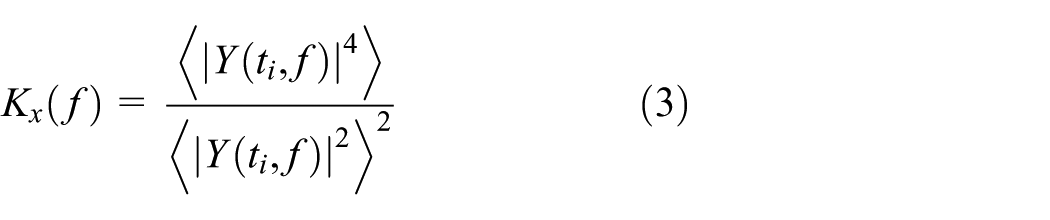
with Y(ti, f) represent the STFT of the data signal while
Kurtogram is the implementation result of these calculations for all possible combinations between frequencies and the window of STFT.
Combined squared envelope spectrum
The squared envelope spectrum (SES) is calculated for the nodes (nlevel) with highest kurtosis values at every decomposed level. Thereafter, the normalized spectrums within 0 and 1 are combined by 30

Maximal Overlap Discrete Wavelet Packet Transform
Continuous Wavelet Transform (CWT) is one of the most used signal processing methods. It gives a multi-time scale resolution. Each scale is considered as a frequency band to analyze the signal under several scales, and the CWT can be defined by11,34,36

where τ represents the translation parameter, while a is the dilation factor and it is called scale.
The main limit of CWT is the wide quantity of computation wavelet coefficients. DWT overcomes this limit by using a dyadic scale and translation parameter as defined in 36

where 2 j and 2 j k replace the dilation and translation parameters, respectively.
The DWT decomposes the signal using a high-pass and low-pass filters to analyze the high-frequency bands [Details Dj] and the low-frequency bands [Approximations Aj], respectively, at level j. The decomposition process is defined in 36

Figure 1 gives a better illustration of the decomposition process.

Decomposition process using DWT.
The motivation for formulating the Discrete Wavelet Packet Transform (DWPT) is essentially to overcome the main problem of DWT. Unless DWT, DWPT decomposes both the detail and approximation coefficients at each levels to obtain more information as follows 35

with z is the node number and z = 2m, where m ∈ N and m ≤ 2j–1 – 1 at level j.
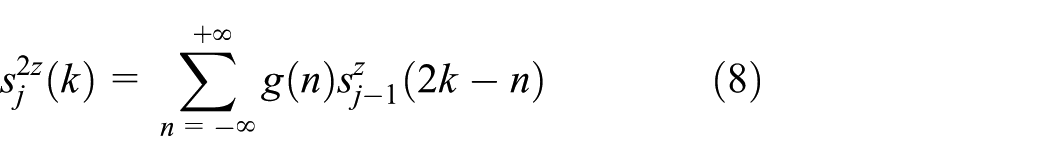
Although both DWT and DWPT have some disadvantages like time-variant property due to the down-sampling process, MODWPT overcomes those drawbacks by dispensing that dyadic step as shown in Figure 2. The MODWPT decomposition coefficients are expressed as follows 35


Two levels of the MODWPT decomposition.
Autogram
As detailed in Moshrefzadeh and Fasana, 30 Autogram could be described in the following steps:
Step 1: The data signal is filtered and decomposed using MODWPT into frequency bands and center frequencies called nodes. MODWPT is a sophisticated version of the DWPT without the down-sampling process.32,35 The down-sampling step is the main limit of DWPT because of the sensitivity of the starting point selection in a time data, for instance, a change in the starting point can give quite different results. 30 MODWPT is also used as a filter to analyze the data signal at all decomposition levels. Each filtered data correspond to a frequency band and a center frequency (node).
Step 2: Autogram uses the periodicity of the autocovariance function. In this step, the unbiased AC is calculated on the squared envelope of the filtered signal using equation (1). AC eliminates all uncorrelated parts of the signal such as noise and random impulsive components and improves all periodic components that are related to gear failure. 30 Also, AC offers more advantages since it is done on each node separately to remove any random impulsive part that defines a very high kurtosis. 30
Step 3: The aim in this step is to select an appropriate frequency band for the demodulation signal for an effective gear fault diagnosis. In this step, the kurtosis is evaluated on the unbiased AC of the squared envelope for each level and frequency band (nodes). Kurtosis values for all nodes are displayed in a color map, where the color scale is proportional to the kurtosis value, while the decomposition level and MODWPT frequency are presented in the vertical and horizontal axes, respectively.
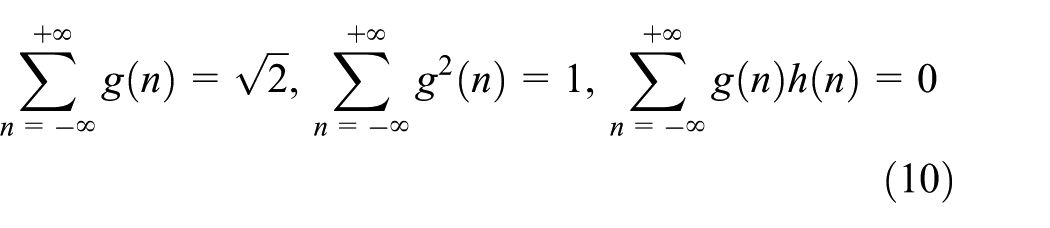
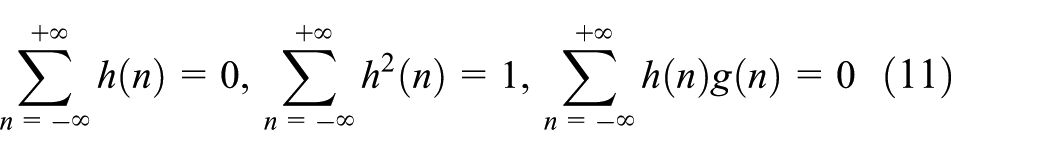
Equations (14) to (16) give a three modified equations of the conventional kurtosis in order to measure the impulsivity of AC for each node obtained above 30

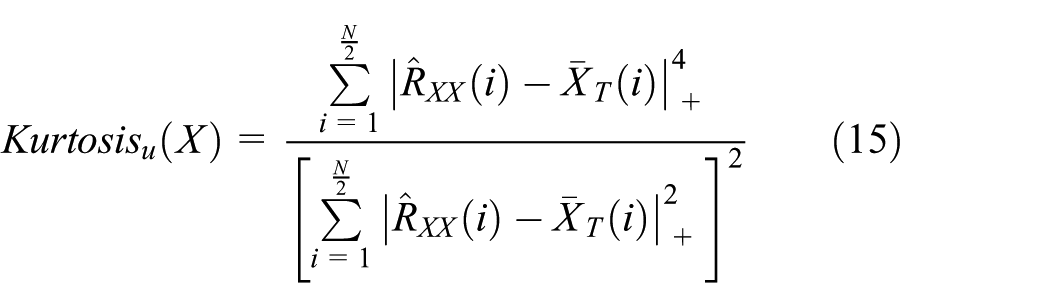
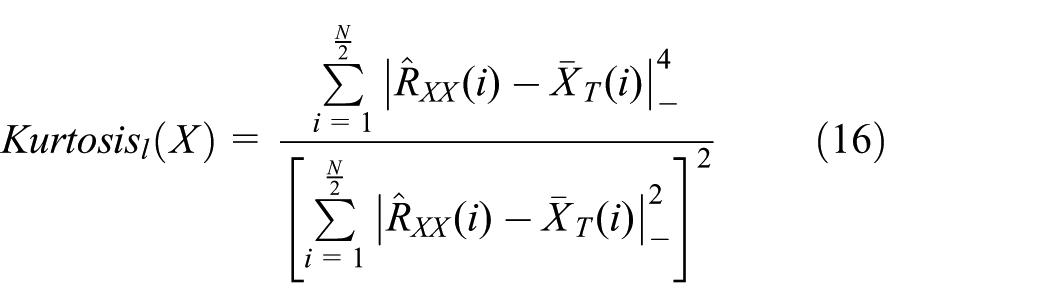
Only positive and negative values are accepted while the other are converted to zero, and

where k is the length of the windowed signal.
As we mentioned in the previous step, AC eliminates all the uncorrelated parts in the signal such as noise and random impulsive which may ineffectively assigns very high kurtosis. Therefore, the node with the highest kurtosis value is selected as an optimal frequency band for the demodulation signal.
Step 4: Fourier transform is applied to the squared envelope with the highest kurtosis value to extract the feature frequency, which is associated to the gear fault.
Figure 3 summarizes the four previous steps.
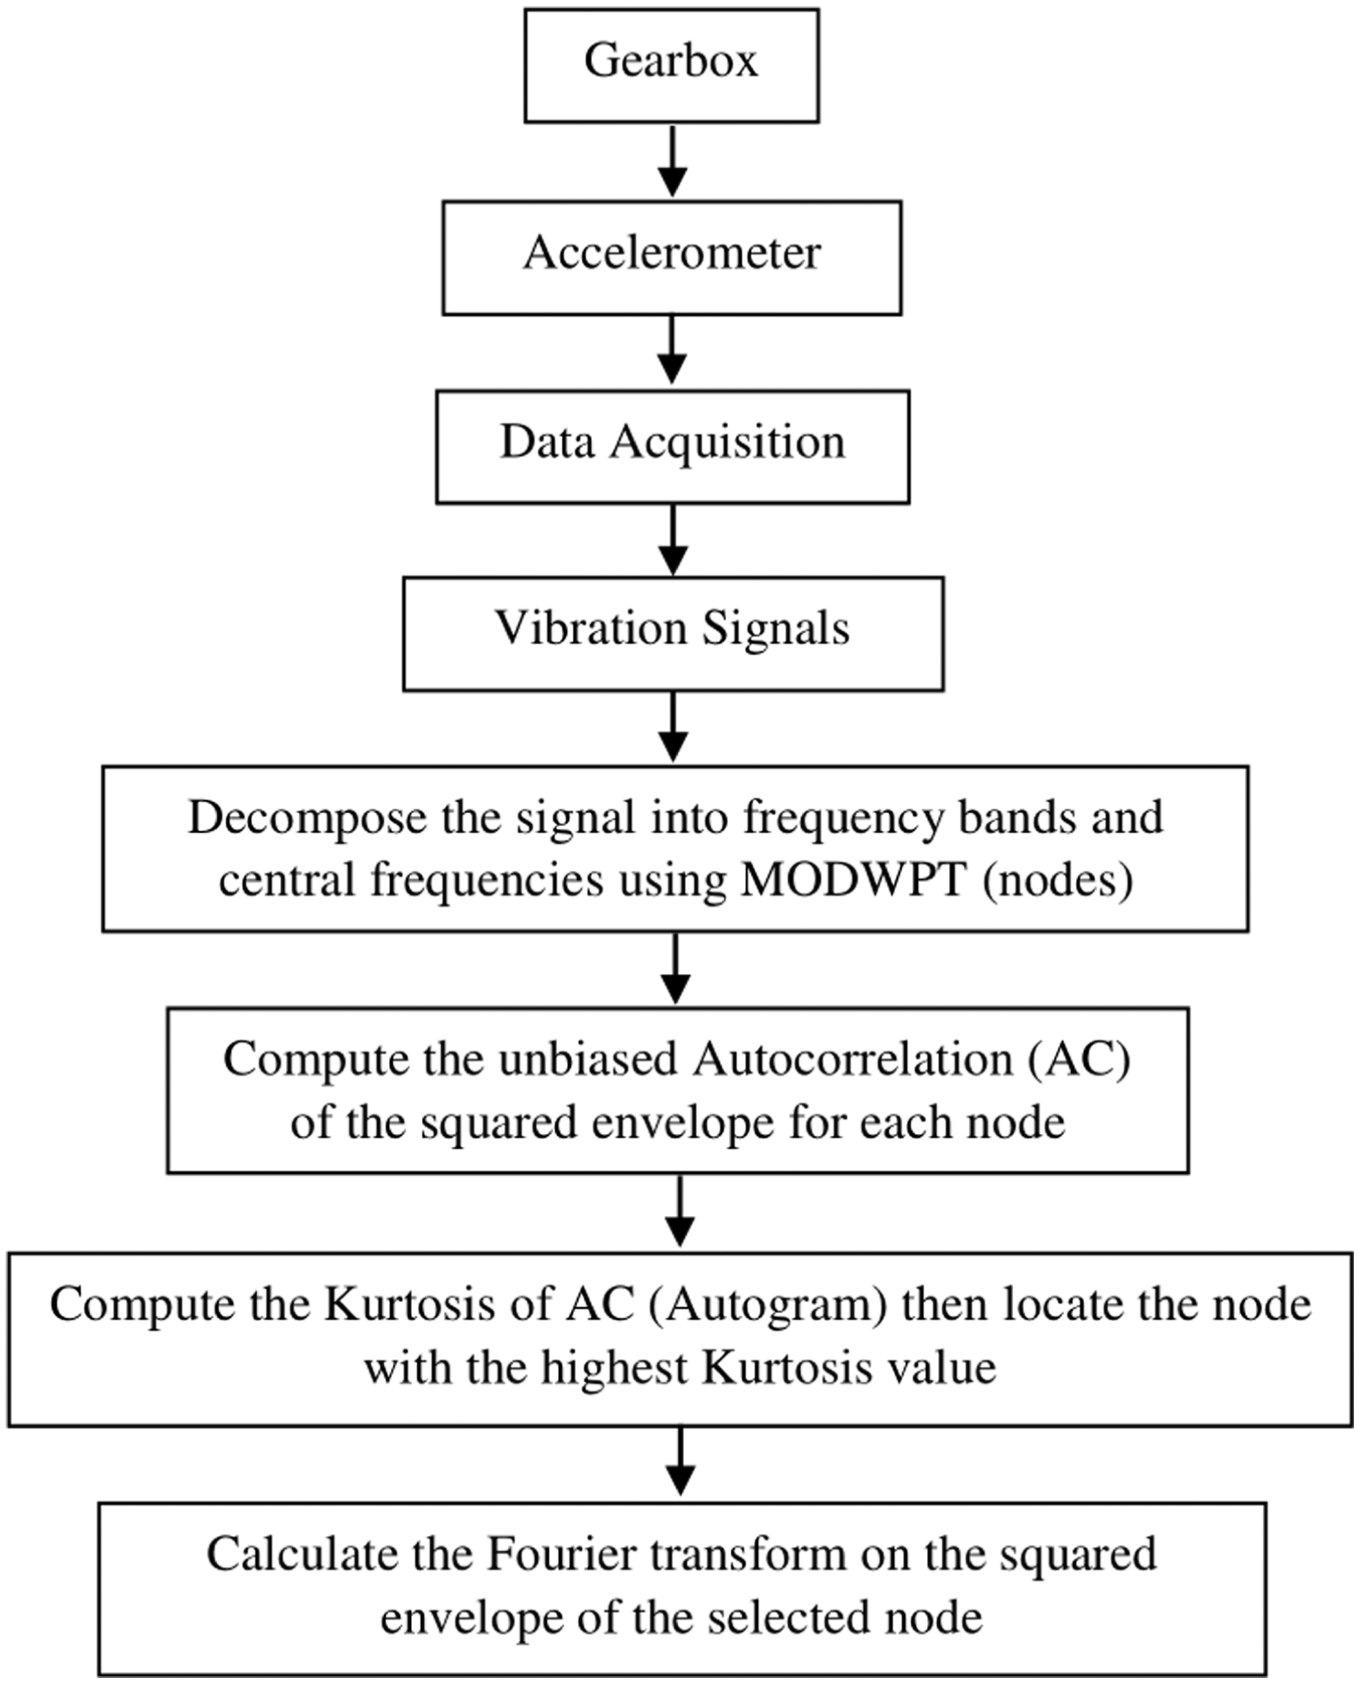
Flowchart for the new proposed method.
Experimental description
The vibration signals have been provided from CETIM, France. 37 They were delivered from a single-stage speed reducer as shown in Figure 4. The gearbox is composed of a pinion and a gear with 20 and 21 teeth, respectively. The rotation frequency of the input shaft is equal to fr1 = 16.67 Hz and fr2 = 15.87 Hz on the output shaft, while the meshing frequency is equal to fmesh = 333.33 Hz with 20 kHz as a sampling frequency.

Schematic representation of the test rig CETIM.
The gearbox system was operating for 24 h over 24 h, and experimental vibration signals were collected for 13 days, except the first day (no data acquisition), until we were close to the tooth break as illustrated in the expert report (Table 1). The dimensions of gears in addition to the operating conditions (speed, torque) have been adjusted to obtain chipping fault over the entire width of a tooth. During experience, the test bench has been stopped every day to appraise the gear state.
The expert report.

//// : same thing as the previous day
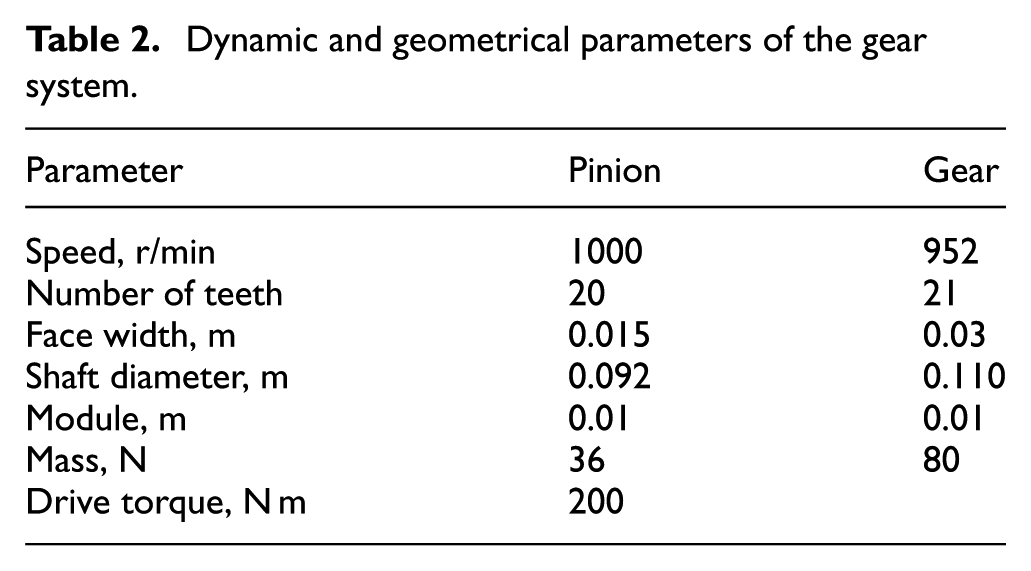
Figure 5 shows the faultless and the faulty tooth in the pinion, while Table 2 shows the different dynamic and geometrical parameters of the gear system.

Pictures of the pinion from CETIM test rig: (a) without defect and (b) with defect.
Dynamic and geometrical parameters of the gear system.
Results and discussion
The data sets provided by CETIM, France, 37 will be used to evaluate the performance of the proposed method by comparing the results with another signal processing technique. The comparison was provided with FK to prove the effectiveness of the suggested approach.
Table 1 gives the expert report and there is no data acquisition for the first day. Our purpose is to recognize the defect from the vibration signals collected before the tooth is broken.
The experimental signals for 2nd, 7th, and 10th days are shown in Figure 6. It can be seen that it is not possible to detect the gear failure only by looking at the waveform, since the fault impulses are masked by the noise.

Analyzed vibration signals of (a) 2nd, (b) 7th, and (c) 10th days.
The signals generated by a defective gear have two important characteristics: a wide frequency and a very low energy compared to the total energy of the signal, so it is difficult to detect the chipping defect through a simple conventional signal processing technique.
To overcome this problem, we first applied FK on the vibration signals recorded with a sampling frequency of 20 kHz. Figures 7 and 8 show the FK and the corresponding envelope spectrum of the filtered signal for days 2, 7, and 10, respectively. Figure 7(b) displays the color map of FK for 7th day, the bandwidth and center frequency are equal to 2500 and 8750 Hz, respectively, while Figure 8(b) displays the spectrum of that band. From Figure 8(b), we notice that it is not possible to extract the defect signature using FK. This is due to the nature of the impulses that are converted by noise. Whereas from Figure 8(c), we could obviously view the appearance of a new frequency that effectively corresponds to the input shaft frequency fr1 = 16.67 Hz with 2fr1 is its harmonics.
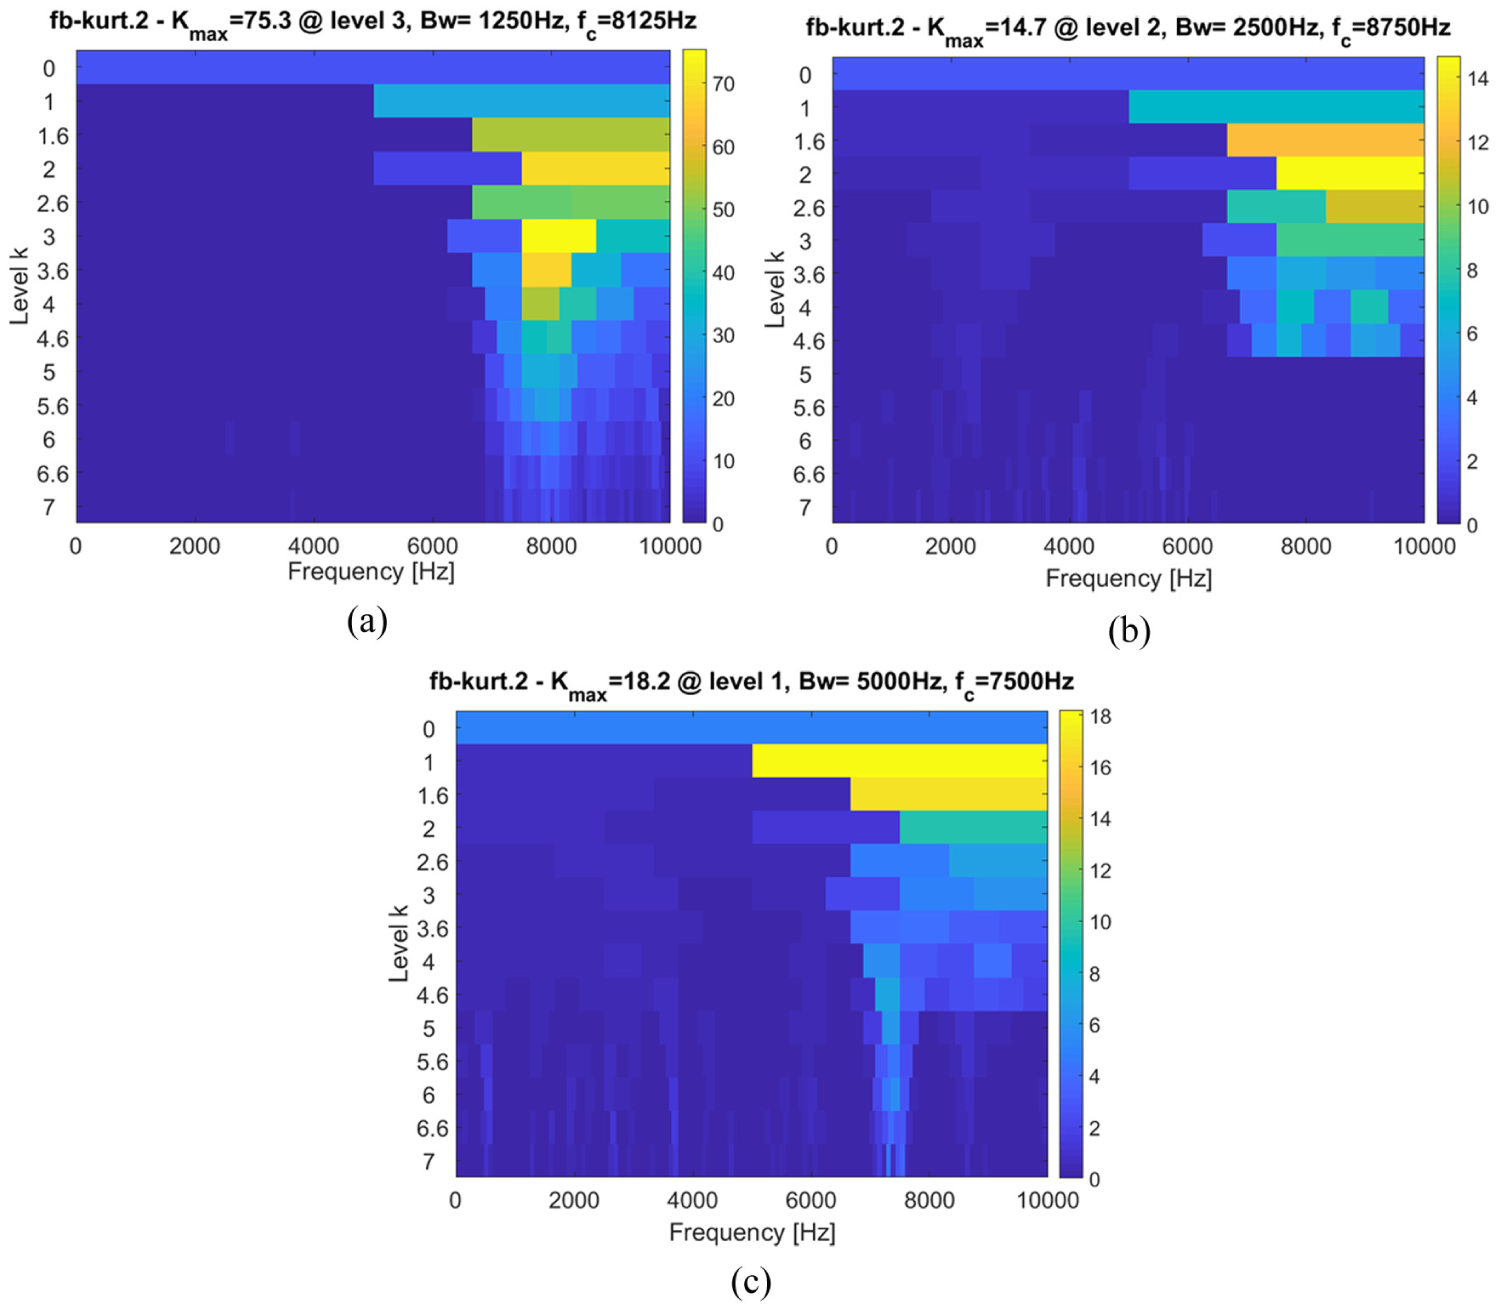
Fast Kurtogram of the vibration signals for (a) 2nd, (b) 7th, and (c) 10th days.
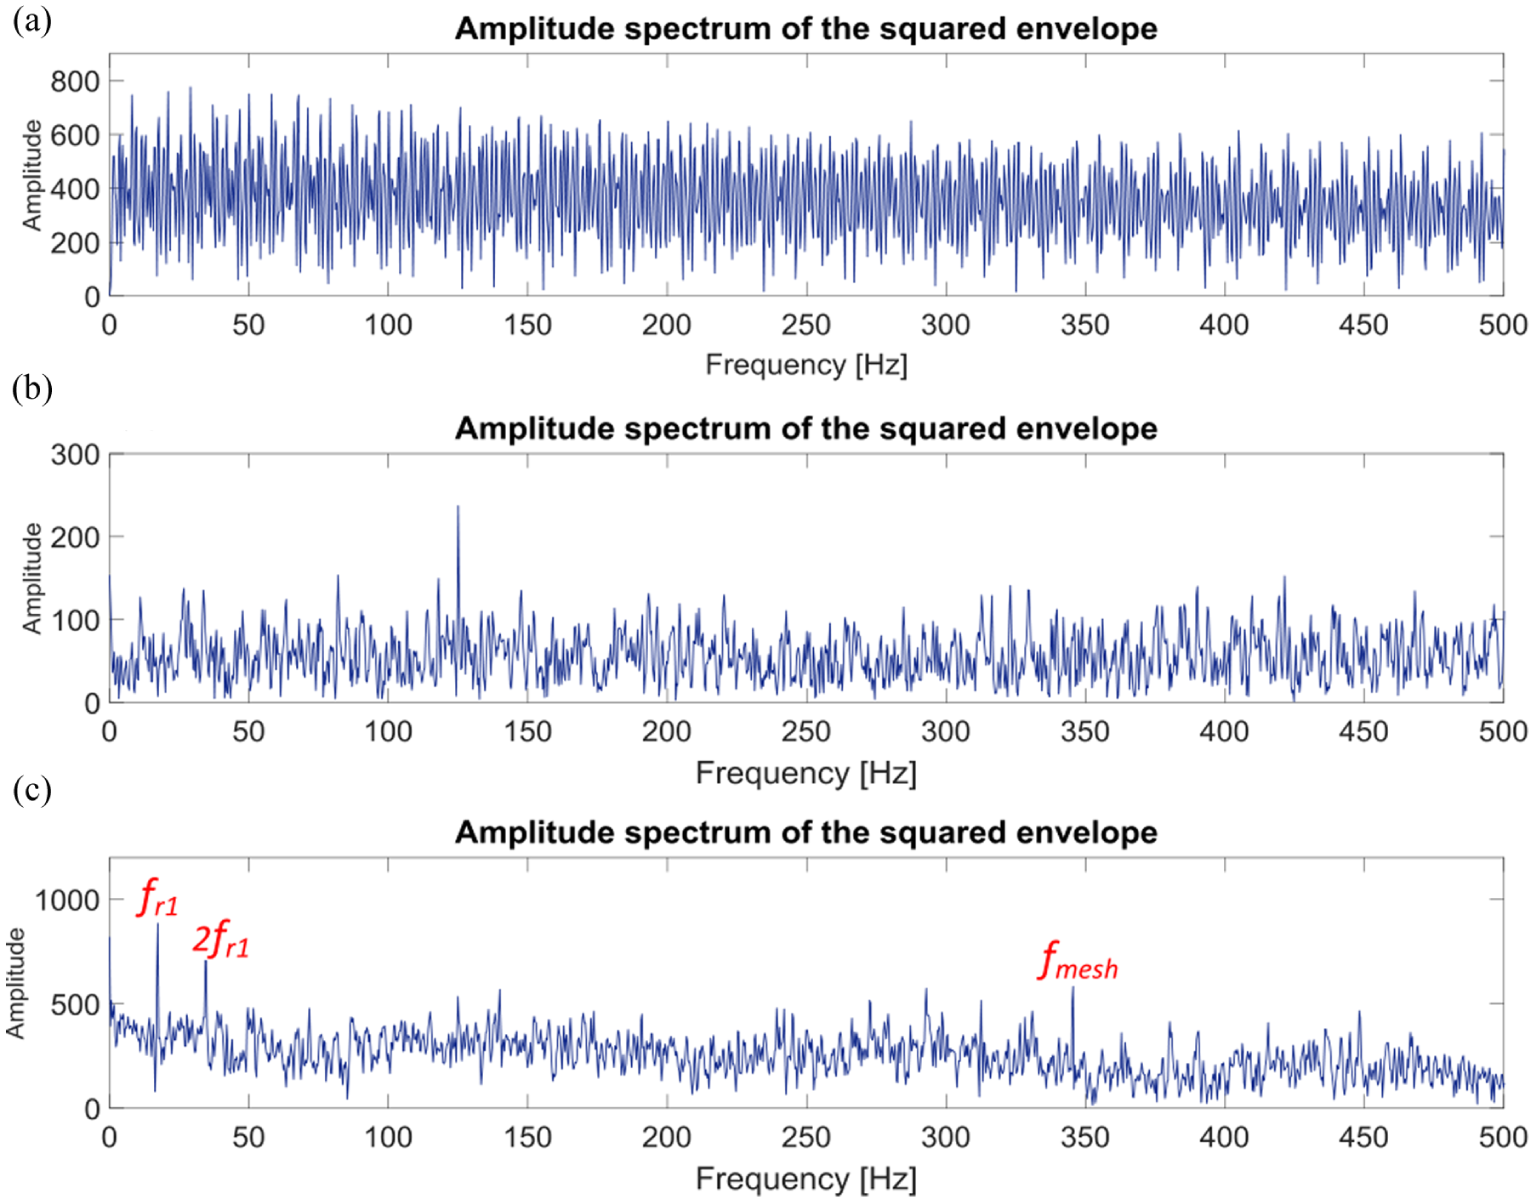
The envelope spectrum provided by the Fourier transform for (a) 2nd, (b) 7th, and (c) 10th days.
The results obtained indicate that we could only detect the gear defect using FK after the 10th day, while the expert report (Table 1) indicates that we could detect it before that.
Thereafter, the proposed “Autogram” method is applied to the same data signals. The results are shown in Figures 9 and 10. Unlike FK, a smaller frequency bandwidth is located (156.25 Hz) in the 7th day as shown in Figure 9(b). The corresponding squared envelope spectrum for the 7th day is shown in Figure 10(b). We can see that the squared envelope spectrum immediately indicates a typical modulation which actually corresponds to the input shaft rotation speed, fr1 = 16.67 Hz (Figure 10(b)). It is also possible to notice the presence of the same frequency at the 10th day, when the width of the chipping tooth has evolved up to 15/16 of the entire width (Figure 10(c)), which confirms the robustness and effectiveness of the proposed method compared to FK.

Autogram of the vibration signals for (a) 2nd, (b) 7th, and (c) 10th days.
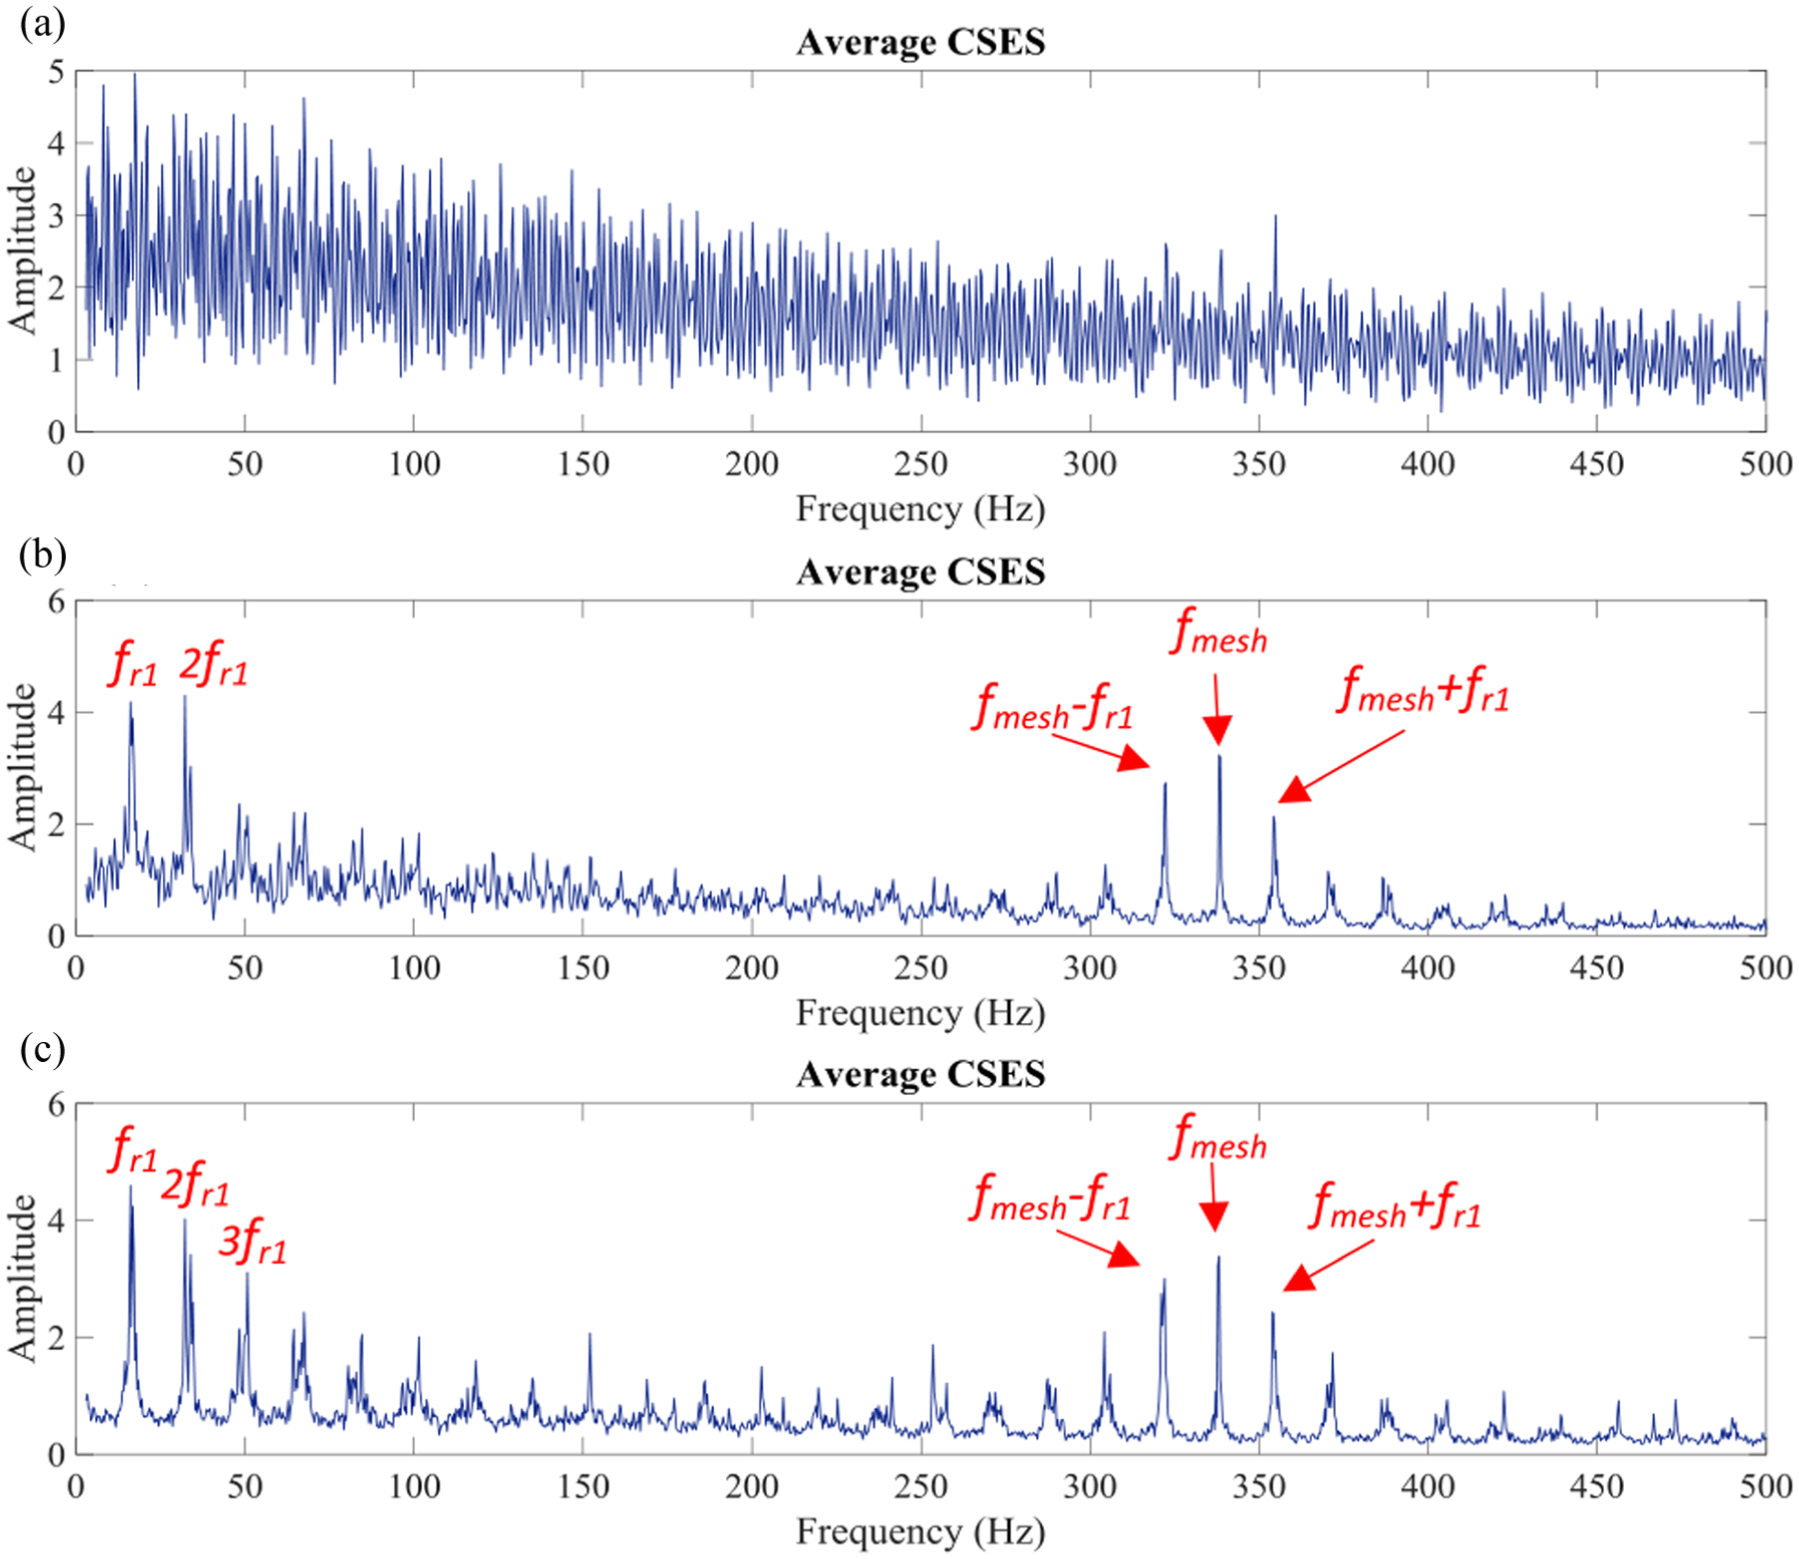
The squared envelope spectrum provided by the Fourier transform for (a) 2nd, (b) 7th, and (c) 10th days.
Conclusion
Gear fault diagnosis requires a powerful non-stationary vibration signal analysis tool to extract the fault signature buried in strong background noise. FK has a strong ability to detect the gear failure even in noisy environment. However, a robust signal processing technique is still required when the vibration signals are covered by strong non-Gaussian noise. Therefore, a new method named Autogram is proposed to reduce the influence of noise, which covers the gear defect from a raw data. In contrast with Kurtogram, this new method finds the perfect frequency band for demodulation to allow a better feature extraction. First, the data signal is decomposed by MODWPT into different frequency bands and center frequencies (nodes). Subsequently, the unbiased AC of the squared envelope is computed for each node to decrease the uncorrelated random noise. Thereafter, Autogram selects the node with the highest kurtosis value. Finally, Fourier transform is applied on the optimal selected frequency band to extract the fault signature. Experimental data sets with faultless and a faulty gearbox were utilized and compared with FK to test the accuracy of the suggested approach. The experimental results confirm the effectiveness of our method in the identification of gear failure even in the presence of non-Gaussian noise.
Footnotes
Handling Editor: Hui Ma
Declaration of conflicting interests
The author(s) declared no potential conflicts of interest with respect to the research, authorship, and/or publication of this article.
Funding
The author(s) received no financial support for the research, authorship, and/or publication of this article.