
Abstract
To guarantee rescue time and reduce medical accidents, a health degradation prediction model of medical lithium-ion batteries based on multi-scale deep neural network was proposed aiming at the problems of poor model adaptability and inaccurate prediction in current state of health prediction methods. The collected energy data of medical lithium-ion batteries were decomposed into main trend data and fluctuation data by ensemble empirical mode decomposition and correlation analysis. Then, deep Boltzmann machines and long short-term memory were used to model the main trend and fluctuation data, respectively. The predicting outcomes of deep Boltzmann machines and long short-term memory were effectively integrated to obtain the health predicted results of medical lithium-ion battery. The experimental results show that the method can effectively fit the health trend of medical lithium-ion batteries and obtain accurate state of health prediction results. The performance of the method is better than other typical prediction methods.
Keywords
Introduction
Lithium-ion batteries are widely used in medical systems. However, an inevitable problem is that battery performance will continue to decrease with recycling and material degradation. In addition, the battery performance degradation cannot be directly measured.1,2 Estimating state of health (SOH) to determine whether to replace the lithium battery in the medical electronics to avoid unnecessary medical incidents is critical. Therefore, for medical electronic equipment lithium batteries, accurate SOH prediction can effectively evaluate the health status of medical electronic equipment lithium batteries and ensure the reliability and safety of medical electronic equipment.
The existing SOH prediction methods for lithium batteries can be divided into failure physical models and data-driven models. The failure physical model is a process of expressing lithium battery performance degradation by establishing a mathematical model; however, the method is susceptible to noise and environment. 3 Interference, it is difficult to dynamically detect the health of the lithium battery, and the robustness and adaptability are poor.4,5 The data-driven method is the mainstream method for battery SOH prediction due to its high flexibility and easy implementation.6,12 This kind of calculation extracts the health characteristic parameters from the performance degradation data of the battery, and outputs the prediction result through modeling to provide decision information for system maintenance. Partial rebirth occurs during the degradation of battery capacity. The volatility generated by this phenomenon will seriously affect the performance of the prediction algorithm, and it is difficult to make effective predictions in actual situations.
In response to the above problems, Xing et al.
13
proposed a fusion or integrated model- and data-driven prediction method to give full play to the advantages of different methods to obtain better performance. Dong et al.
14
proposed support vector regression (SVR) and particle filter (PF) prediction method. Yu,
15
based on logic regression (LR) and Gaussian process regression (GPR), proposed to solve lithium battery multi-scale method for SOH estimation. The above-mentioned fusion method-based prediction method research has effectively improved the accuracy of SOH prediction, but there are some problems with this type of method at present:
Combining multiple methods to make the parameters of the model more complicated, resulting in large calculation of the model and unstable prediction; Most fusion methods rely on large-scale data sets for training, and the generalization is poor; The limitations of the traditional machine learning method itself affect the optimization effect of the fusion method.
Deep learning has achieved great success in image processing, speech recognition, and other fields. Although, most of the current deep learning is used to solve the classification problem, due to its excellent performance in feature extraction in the field of fault diagnosis and prediction. Tao et al. 16 built the deep Boltzmann machines model based on Teager energy operator to diagnose faults of rolling bearings with different damage degrees. Ma et al. 17 proposed a long short-term memory (LSTM) network predictive model for online monitoring of traffic flow conditions. For device health prediction problems, the effectiveness of deep learning methods such as LSTM and deep Boltzmann machines (DBMs) has been validated.18,19 The deep learning prediction method only involves a single model. It is difficult to maintain good performance when predicting different objects. In addition, deep learning is less applied to the prediction of lithium battery health status. The phenomenon of local rebirth during battery degradation limits the predictive power of a single model.
In this article, a battery health prediction model based on multi-scale decomposition and deep neural network is proposed, and further innovation is realized based on the current research:
First, the ensemble empirical mode decomposition (EEMD) and correlation analysis (CA) are used to multi-scale the time series to adaptively separate the local features and global degradation trends in the battery health indicators. Solved the problem of severe fluctuation caused by battery energy index rebirth. Considering that the deep neural network has excellent prediction performance, multiple sets of decomposition data are used to construct the DBM model and the LSTM model. Finally, the results of the two prediction models are integrated to obtain a reliable lithium battery health prediction result, which makes up for a single model that predicts poor stability.
Integrated prediction method based on multi-scale decomposition and deep neural network
Since the battery capacity data are easy to collect and can directly reflect the health of the battery, the battery capacity is used as the SOH indicator to describe the degradation trend of the battery. The overall framework of the algorithm is shown in Figure 1. First, the data are decomposed into main trends data and fluctuations data by EEMD and CA. Analysis of the two types of data was performed to avoid the adverse effects of regenerative phenomena on the degradation of the battery degradation process. Based on the superior performance of deep neural network in feature extraction and time series analysis, DBM and LSTM are used to model the two types of data, and the output of each group is effectively integrated to obtain the final combined prediction result.

SOH prediction of medical lithium batteries based on multi-scale decomposition and deep learning.
Definition of SOH
During the use of lithium battery, SOH generally shows a downward trend with the increase in charge and discharge cycles. Battery capacity is an important indicator of SOH. When the capacity declines to a certain extent, the battery will not continue to work normally and reach the end of life (EoL). The capacity of lithium battery is used to characterize SOH, defined as
Multi-scale decomposition based on EEMD and CA
Empirical mode decomposition (EMD) is a method for analyzing non-stationary signals, which decomposes the signal into an intrinsic mode function (IMF) and a remainder. It adaptively represents local features and global degradation trends in the signal. EMD is prone to modal aliasing during decomposition, resulting in the appearance of erroneous IMF components, which makes the IMF lose its physical meaning. EEMD 20 is a noise-assisted data analysis method proposed for the deficiency of EMD methods. The principle of EEMD is to repeat the EMD decomposition signal process n times. In each decomposition process, white noise with zero mean and fixed variance is added to the original signal, which effectively solves the modal aliasing phenomenon. Using EEMD to extract the local features in the SOH data of lithium battery, the effect of data fluctuation caused by rebirth phenomenon on the prediction performance of the algorithm is greatly reduced. The factors that affect the SOH of batteries include temperature, depth of discharge charging rate, and so on, which are random and nonlinear. And these indexes cannot directly represent the degradation degree of battery performance, so it is difficult to detect online. So this article adopts time series method to study SOH.
For the collected lithium battery SOH data
Considering that there are more data groups, the final cumulative error may be larger, and the accuracy of the prediction model is degraded. By calculating the correlation coefficient between

To achieve good generalization for different data,
The remaining component
The global degradation trend and local features in the SOH time series are effectively separated by using EEMD and CA, so that the local rebirth phenomenon can be significantly improved and the prediction performance of the SOH prediction model is improved. Furthermore, adaptively setting the CT can further improve the robustness of the prediction method. Through the screening method, the IMF data with strong correlation are combined with the margin. While the local features are preserved, the problem of excessive grouping and excessive cumulative error is avoided.
DBM-based prediction model
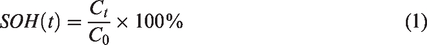
In general, we will rarely be interested in learning a complex, fully connected Boltzmann machine. Instead, consider learning a deep multi-layer Boltzmann machine as shown in Figure 2, left panel, in which each layer captures complicated, higher order correlations between the activities of hidden features in the layer below. DBMs are interesting for several reasons. First, like deep belief networks, DBM’s have the potential of learning internal representations that become increasingly complex, which is considered to be a promising way of solving object and speech recognition problems. Second, high-level representations can be built from a large supply of unlabeled sensory inputs, and very limited labeled data can then be used to only slightly fine-tune the model for a specific task at hand. Finally, unlike deep belief networks, the approximate inference procedure, in addition to an initial bottom-up pass, can incorporate top-down feedback, allowing DBMs to better propagate uncertainty about, and hence deal more robustly with, ambiguous inputs.
Left: A three-layer deep Boltzmann machine. Right: Pretraining consists of learning a stack of modified RBMs that are then composed to create a deep Boltzmann machine.
Consider a two-layer Boltzmann machine (see Figure 2, right panel) with no within-layer connections. The energy of the state


The conditional distributions over the visible and the two sets of hidden units are given by logistic functions


To obtain the optimal solution of the model, the maximum likelihood method is used to determine the parameter set

Taking the battery capacity as a health indicator, the decomposition and degradation process separated by EEMD decomposition will show a gradual decrease in the transition time. Because DBM can build a deep model through time series, find the hidden law in the process of battery degradation through historical data and adaptively fit the downward trend, so that it can achieve efficient prediction. The DBM is used to predict the main degradation trend of the lithium battery, and the time

The training process of the DBM model is shown in Figure 2. The RBM training of each layer is completed by calculating and reconstructing the weights of each node. During the training process, the sample statistical probability of the node and the model generation probability should be as equal as possible, so that the DBM model can achieve more accurate predictions. The entire DBM training process consists of two phases: the pretraining phase, which uses an unsupervised greedy mechanism to perform layer-by-layer training from the bottom up, transforming low-level features to high-level features, and finally sending them to the top-level regression layer; the reverse fine-tuning phase. Fine-tune network weights from top to bottom to reduce errors.
LSTM-based prediction model
LSTM is a special recurrent neural network (RNN). Compared with traditional RNN, LSTM adds a cell state to the hidden layer. LSTM improves the hidden layer of RNN and solves the problem of RNN processing long sequence data. It is easy to fall into the problem of gradient disappearance or gradient explosion and has more effective long-term prediction ability.
The core of LSTM consists of three “gates”: input, forget, and output. The network structure can effectively forget the previous useless information, save the valid input information, and determine the required output information, so as to process the long-term sequence more efficiently. The structure of the LSTM model is shown in Figure 3, and the calculation formula is shown below


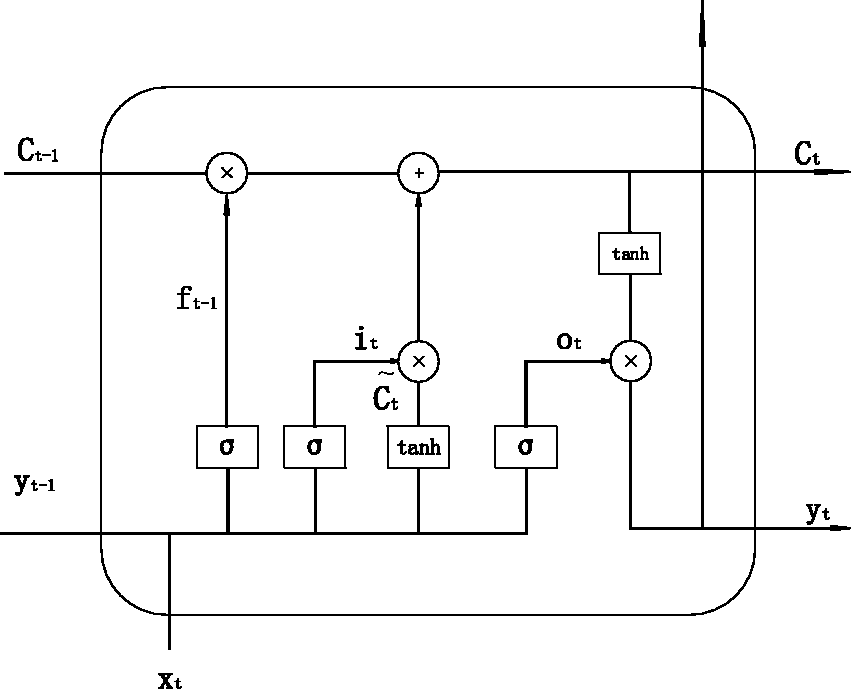
Network structure of long short-term memory.
In the formula,
The output values of the model are calculated according to equations (12)–(17), and the error terms S and weight gradients of each LSTM cell are calculated reversely according to the defined error functions (equations (18) and (19)), thereby updating the network parameters


LSTM uses memory gate units and threshold restrictions to achieve effective use of long-distance information and can respond promptly when facing large changes in data. Therefore, it can effectively deal with the problem of gradient disappearance and gradient explosion. Based on the significant advantages of LSTM in performing long-term time series prediction, the LSTM model is used to predict the fluctuation of the regeneration phenomenon during the degradation of battery capacity. The actual data

The training process of the LSTM model is shown in Figure 4. During the training process, according to the size of the time window, the required data are taken from the training set and substituted into the LSTM calculation to obtain the output value. The loss function is used to calculate the loss value and weight gradient to optimize the network parameters. Repeat the above calculation and update steps until all training data are complete.
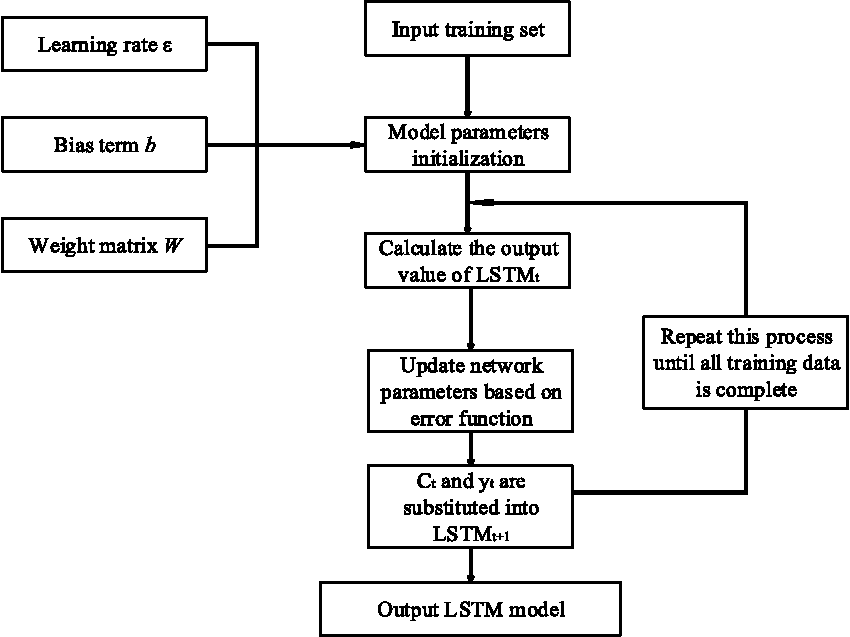
Flowchart of training long short-term memory network.
Prediction steps of combined SOH model
The process of the proposed prediction model includes three modules: data preprocessing module, network training module, and model prediction module. The specific steps of integrated model prediction are as follows:
Take the collected battery capacity time series data Decompose Perform a CA on the components, and use formula (3) to accumulate the highly correlated components and margin as the main trend The DBM model and LSTM model are trained by formula (5)–(10), (12)–(19). According to formula (11) and (20), the trained model is used to obtain the output results of the DBM model and the output results of the multiple sets of LSTM. The output results of the DBM model are

Establishment of experimental platform
Through the cooperation with Shanghai General Hospital, the experimental platform as shown in Figure 5 was built. To ensure the experimental results are more realistic and reliable, one set of medical electronic equipment lithium batteries was selected to predict the SOH through various algorithms (a lithium battery for a cardiac pacemaker with a rated capacity of 1.44 A h). The multi-scale decomposition and deep learning network centralized model prediction results proposed in this article are compared with the commonly used prediction models to verify the robustness and performance superiority of the proposed model. In this article, a total of 10 medical lithium batteries were used, which belonged to the same type and batch. Among them, four medical lithium batteries were used to verify four different integration models. Four medical lithium batteries were used to verify four different conventional prediction models. Two medical lithium batteries were used for robustness verification (high-temperature adaptability).
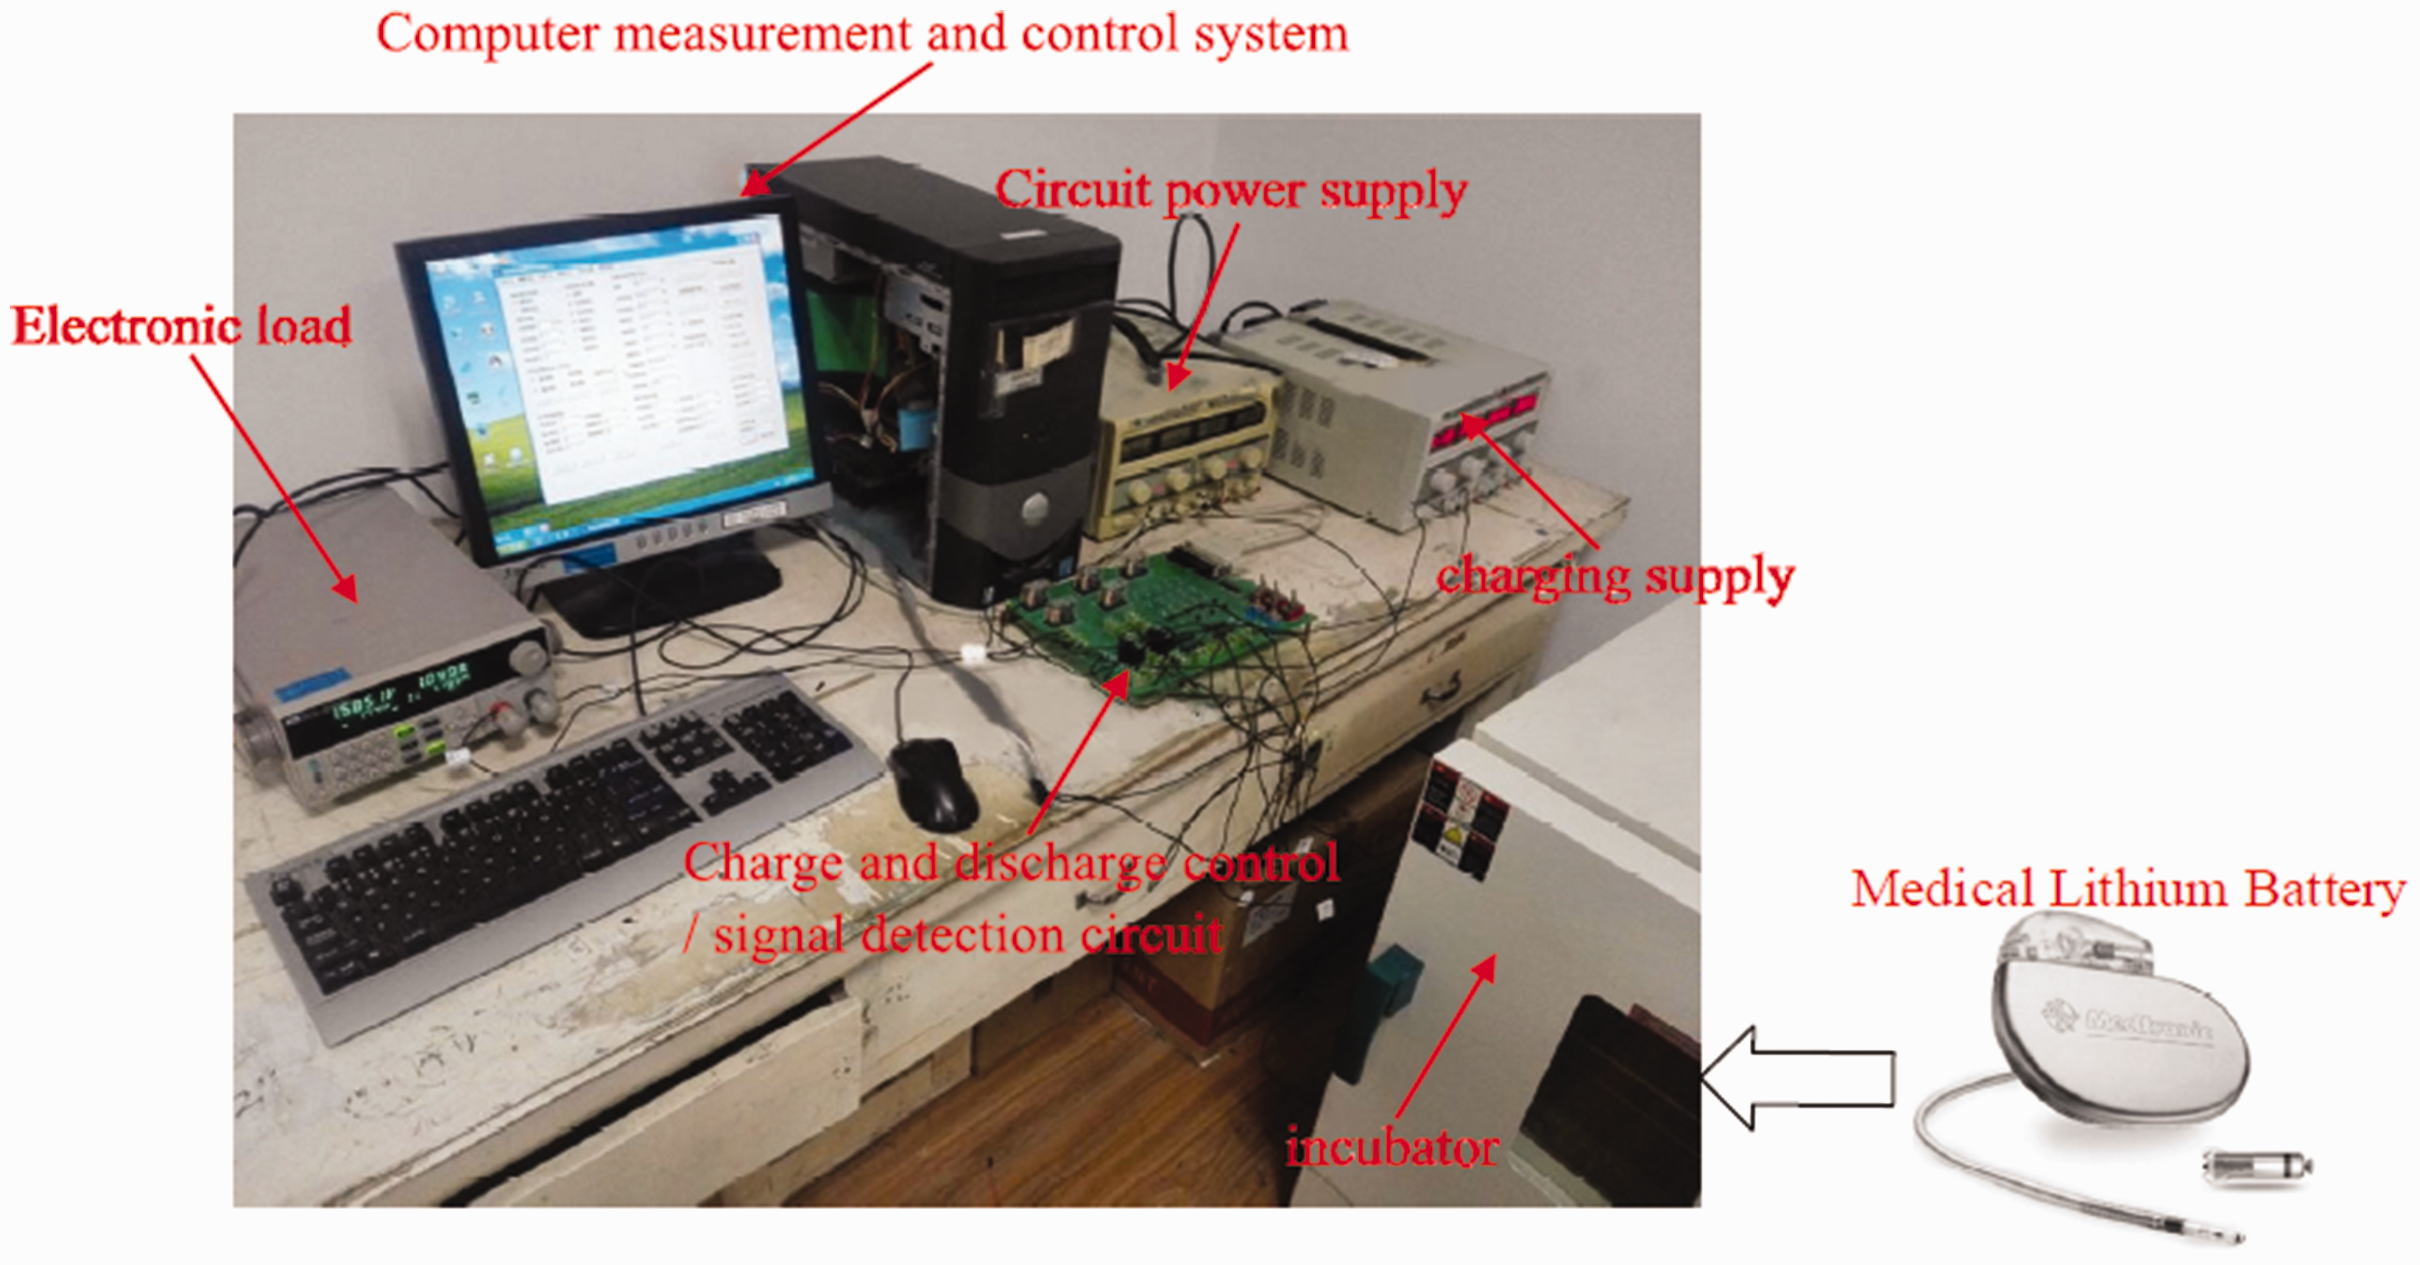
Medical lithium battery charge and discharge experimental platform.
The battery test platform consists of a host computer, an electronic load, a charge and discharge control/signal detection circuit, a circuit power supply, a charging power supply, a Controller Area Network (CAN) bus, a temperature control box, a safety protection box, and a sensor. The upper computer is set outside the temperature control box and connected to the short circuit trigger controller through the CAN bus to ensure safe and reliable operation. Lithium batteries, relays, and sensors are placed in a security box. During the experiment, the voltage, current, and temperature changes were recorded by the data acquisition unit. Two thermocouples were attached to the anode and cathode of the battery, respectively, for measuring the temperature of the battery.
Analysis of experimental results
Multi-scale decomposition of SOH time series
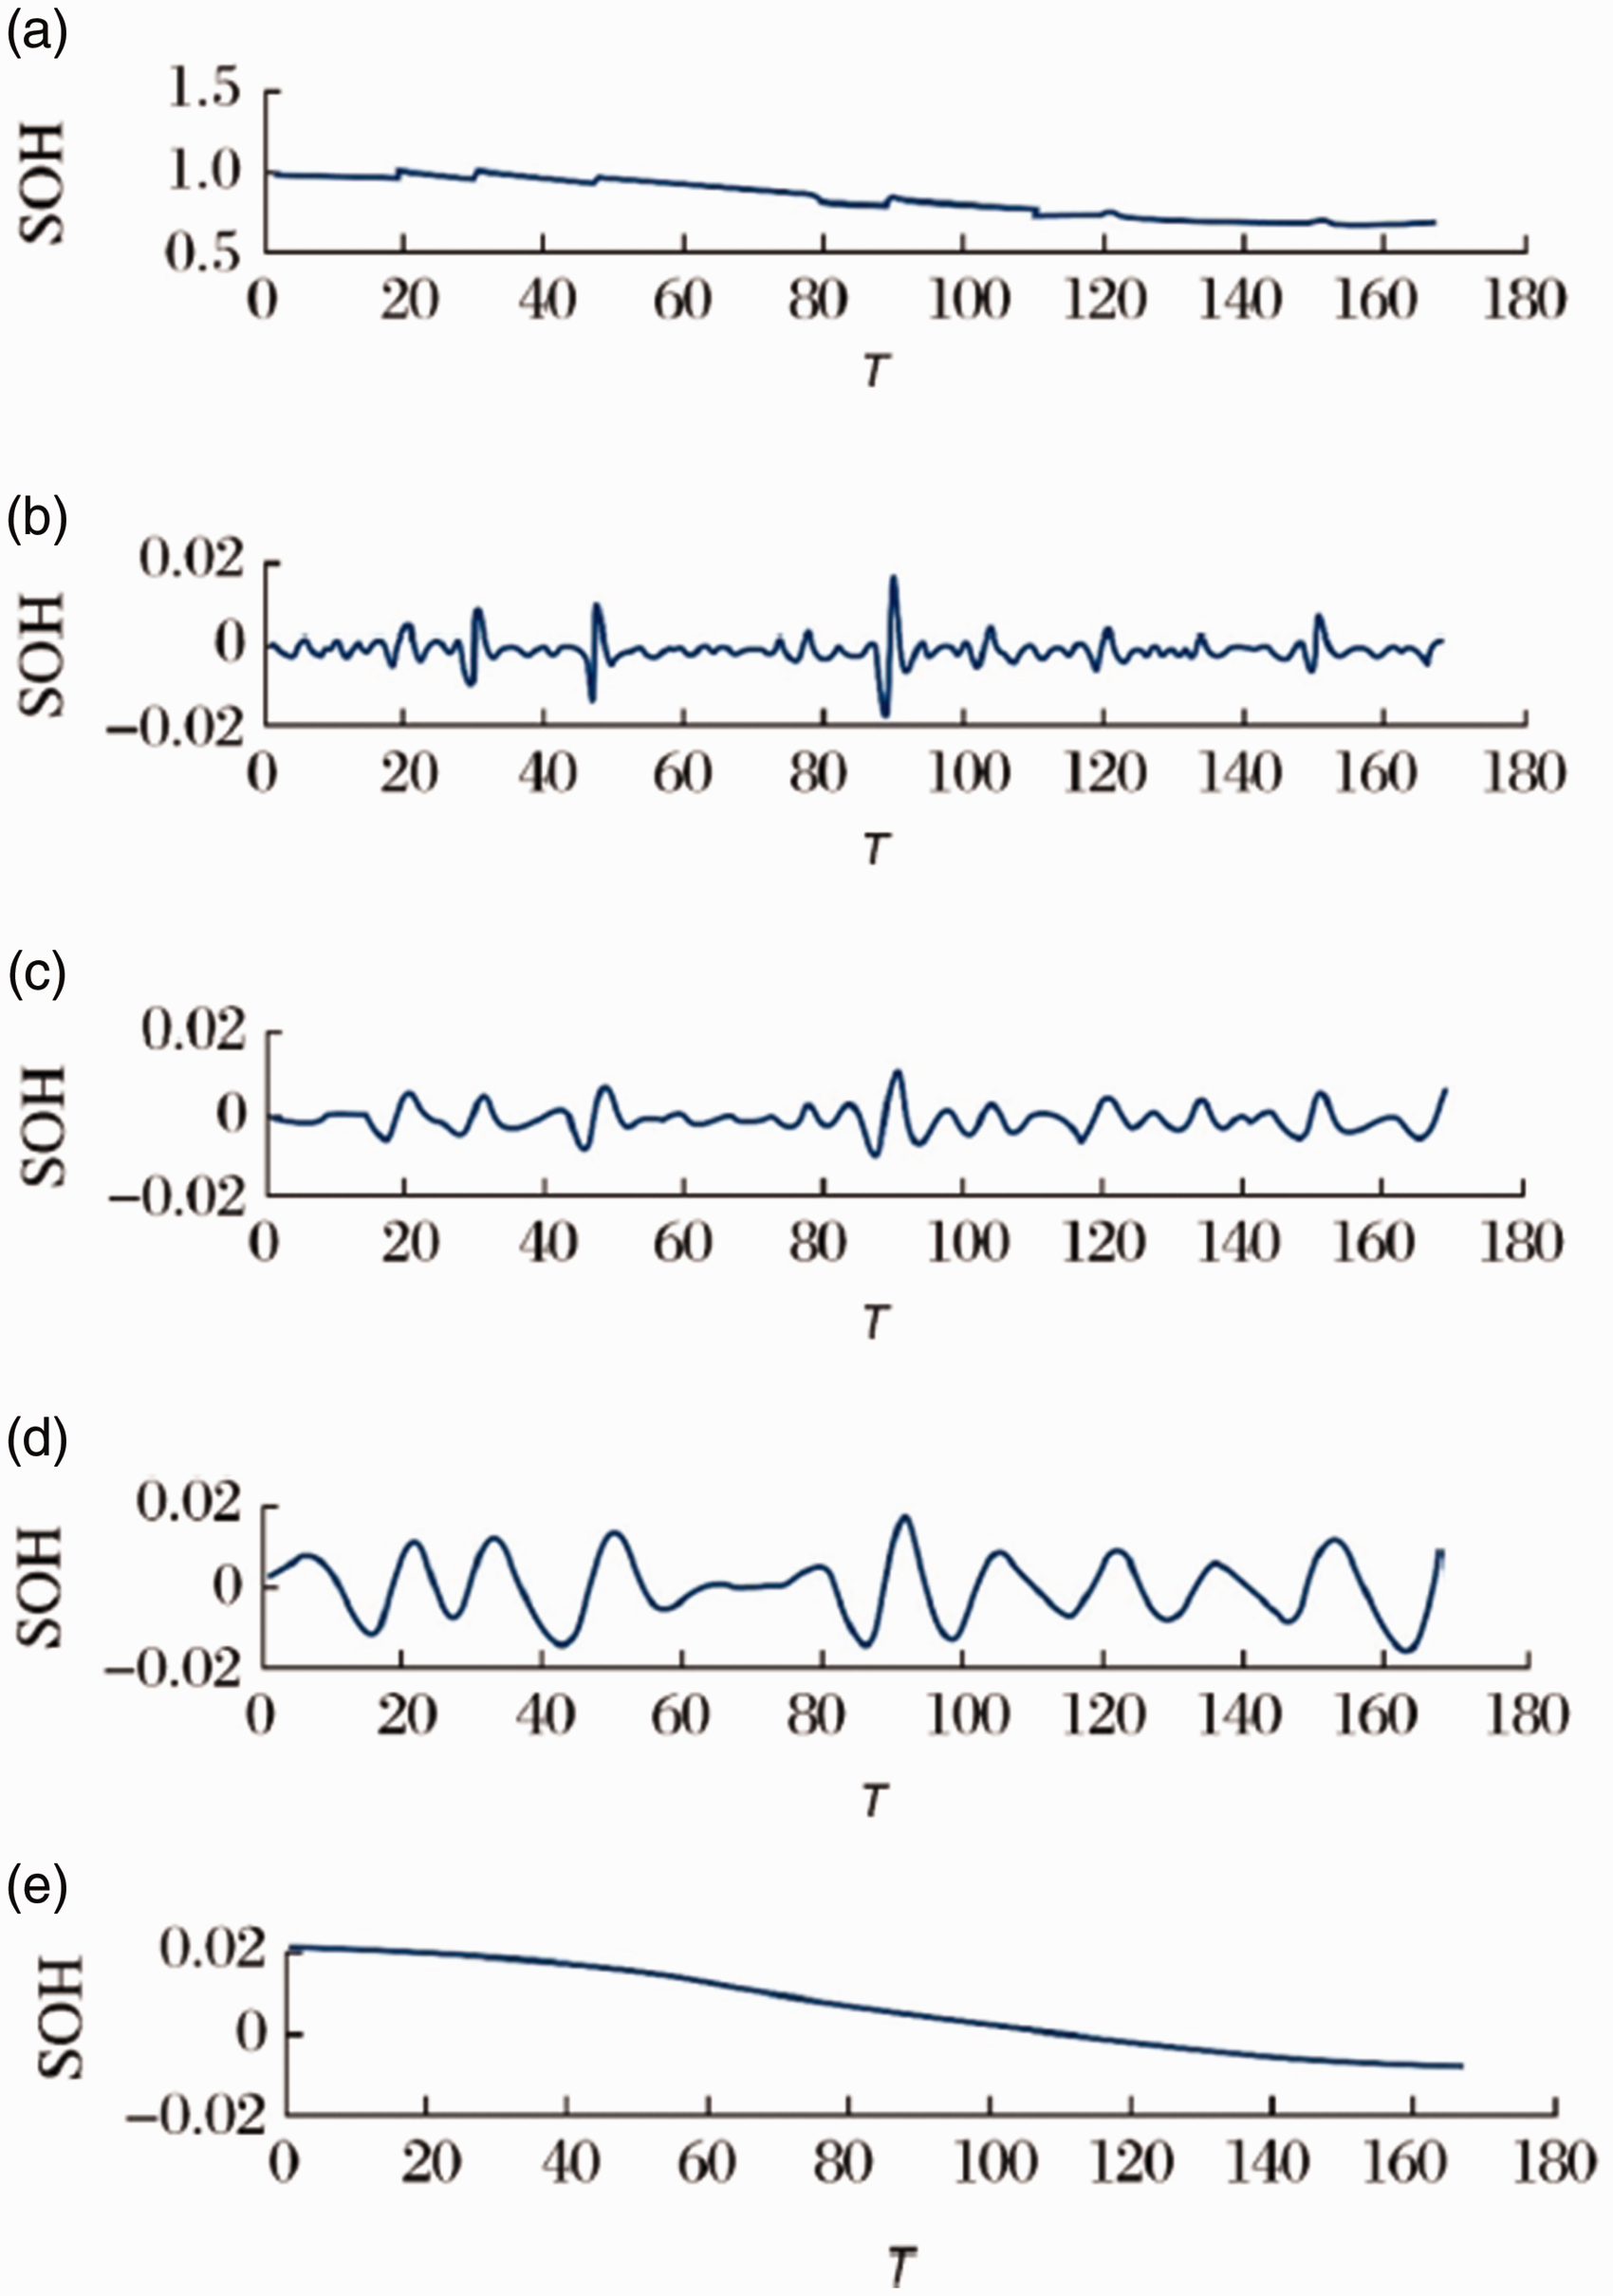
Equation (1) is used to obtain the battery’s SOH sequence, as shown in Figure 6(a). The EEMD is used to decompose the SOH time series into several component IMFs and margins, as shown in Figure 6(b)–(h). The CA method is used to extract component IMFs that have a strong correlation with the overall trend. These IMFs are combined with margins. The analysis results are shown in Table 1 and Figure 7. The CT is calculated to be 0.148 through formula (3).
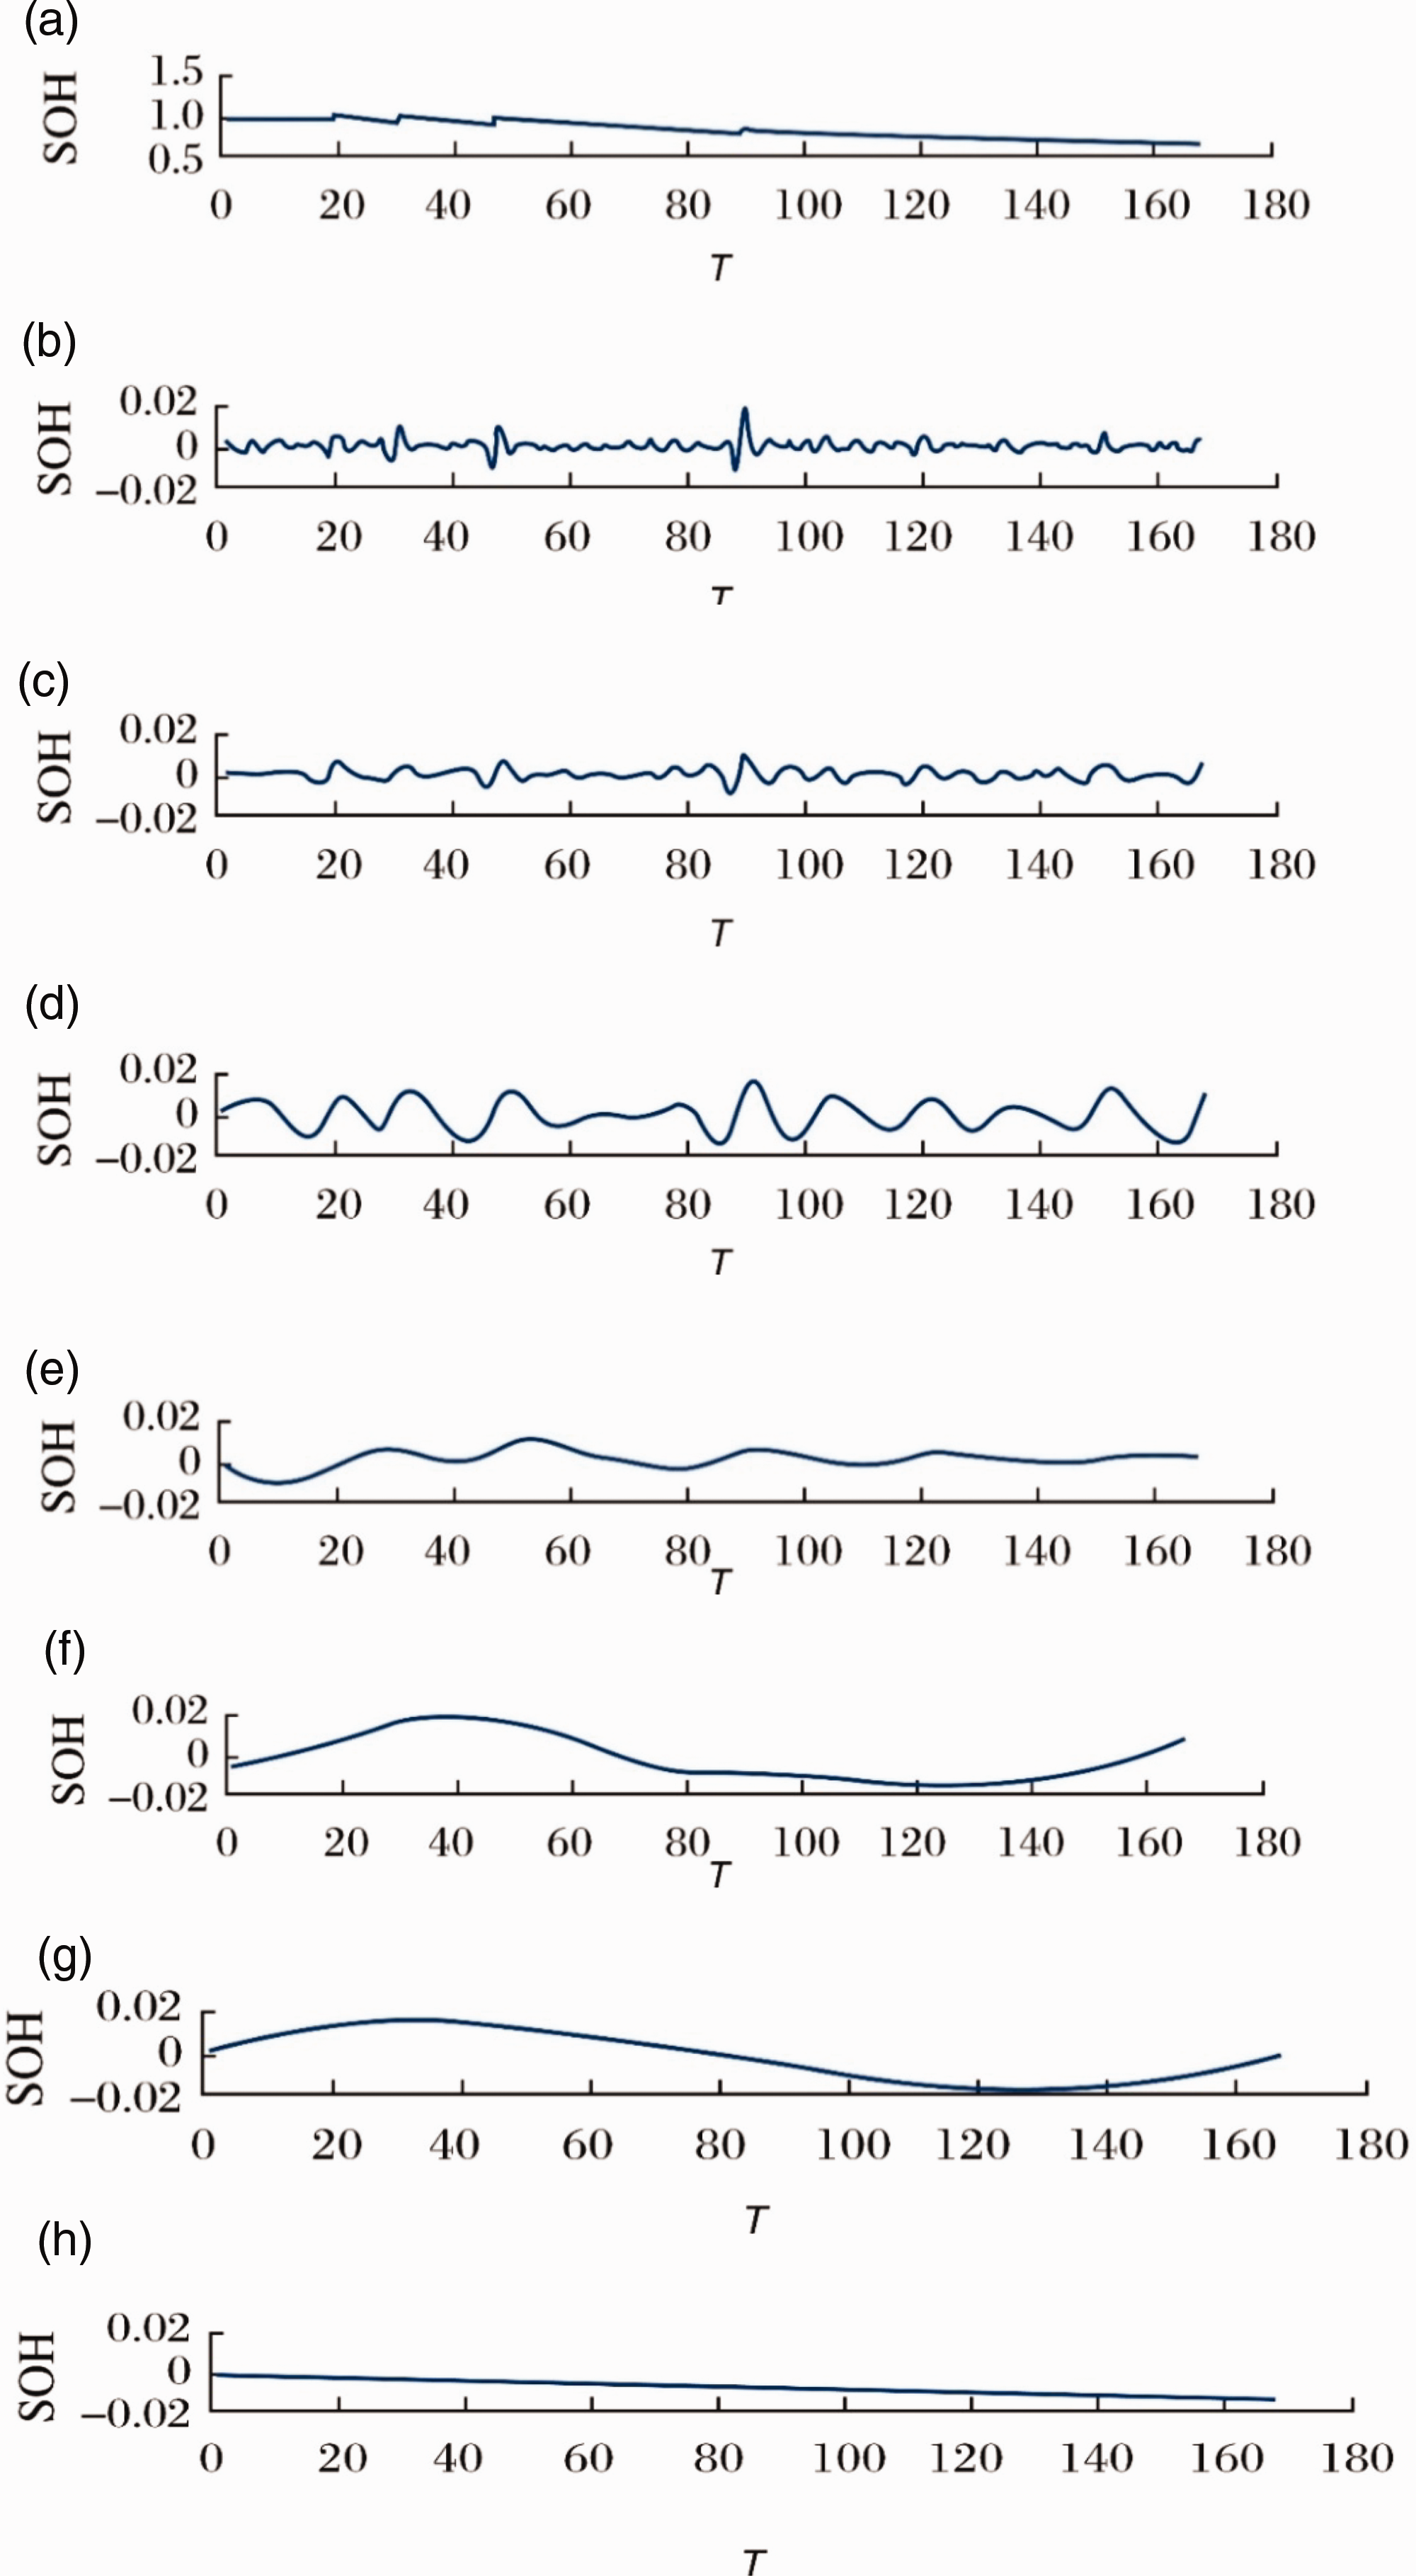
State of health time series based on ensemble empirical modal decomposition.
Correlation coefficients of intrinsic mode functions.

IMFs: intrinsic mode functions.
Filtering results of correlation analysis.
Through the multi-scale decomposition method based on EEMD and CA, the local features were effectively extracted from the data, that is, the three groups of IMFs in Figure 6(b)–(d). Through adaptive screening, the three sets of IMF (Figure 6(e)–(g)) and margins with no significant fluctuation were accumulated to form the main degradation data shown in Figure 6(h). The main degradation data show a good monotonous downward trend and are no longer affected by the rebirth phenomenon. By the above method, multi-scale decomposition of the data can effectively separate the local characteristics and global degradation trends in the battery capacity degradation data, avoiding the adverse impact of the rebirth phenomenon on the prediction method, which will help improve the performance of subsequent prediction models.
Model output results
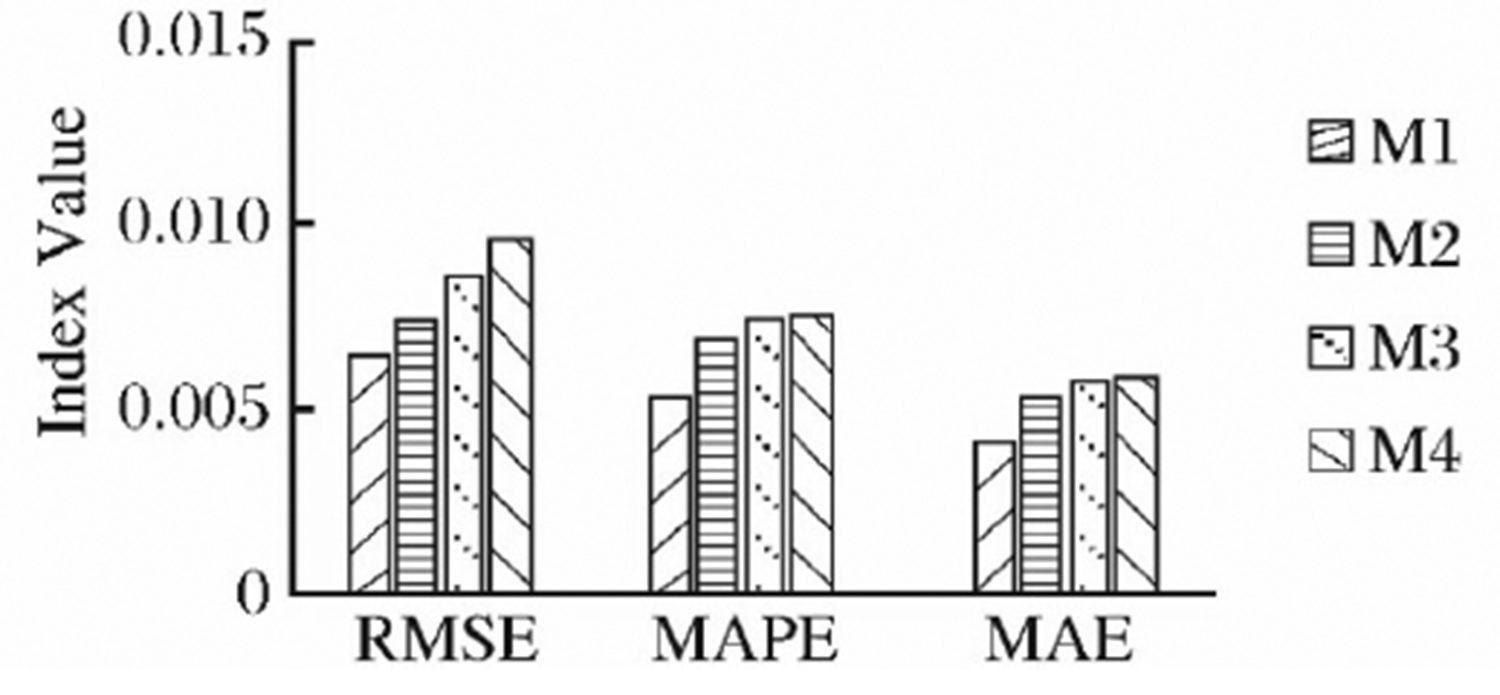
One-step prediction was used to verify the performance of the method, and the known data were used to predict the next SOH. Table 2 shows the network parameter settings of LSTM. Take the pacemaker battery which contains 168 sets of data as an example. The first 80 sets were taken as the training set, the last 88 sets were used as the test set. The training set was substituted into the set LSTM and DBM models for training. The trained model was used to predict the test set, and the output of each model was integrated to obtain the final result. The prediction results of each model are shown in Figures 8 and 9. In the figure, T is the charge and discharge cycle and its unit is cycle.
Parameter setting of long short-term memory network.


Prediction results of models. (a) Main trend data M prediction. (b) Volatility data

Integrated prediction results.
It can be seen from Figure 9 that the prediction result of the DBM is basically consistent with the downward trend of the actual capacity, and the LSTM model gives a timely response to the fluctuation data, so that the output value of the integrated prediction model and the actual value are highly fitted. It reflects the efficient performance of the method. The running time of the proposed method is shown in Table 2. In actual situation, the time cost of the method is completely within the acceptable range, and there is no need to train the model with a lot of historical data, so the method can be used for online prediction of battery SOH to achieve dynamic monitoring of battery health. Meanwhile, it can ensure that medical electronic equipment can continue to operate normally.
Performance superiority verification
Comparison with various integration models
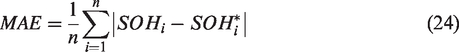
To more intuitively reflect the performance of the proposed integrated model, multiple sets of comparative experiments were performed on medical lithium batteries, where M1 is the result of the method of this article, M2 is the combined result of EEMD and DBM, M3 is the combined result of EEMD and LSTM, and M4 and M5 are the combined results of DBM and LSTM, respectively. The following formulas are used to calculate the performance of various methods by calculating root mean square error (RMSE), mean absolute percentage error (MAPE), and mean absolute error (MAE)
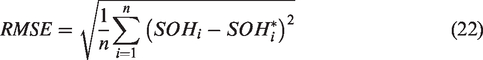

In the formula,
It can be seen from the comparison of the predicted trend graph and the index values (Figures 10 and 11) that the proposed method has the best prediction performance among the five groups of schemes. The multi-scale decomposition based on EEMD and CA enables the model to more effectively deal with rebirth phenomenon in the process of battery degradation. The integrated model of DBM and LSTM improves the accuracy of the prediction algorithm for the main trend and volatility data. Figure 11 shows the comparison of five sets of experimental evaluation indicators. The RMSE, MAPE, and MAE indicators of the method in this article are all smallest, that is, the smallest error and the highest prediction accuracy. This result illustrates the rationality and effectiveness of the prediction method in this article.

One-step prediction results of each integration model.
Indicator values of each integration model for one-step prediction.
Comparison with common prediction models
To further verify the superiority of the method, the commonly used prediction models SVR, GPR, LR, and extreme learning machine (ELM) are compared with the method in this article. These common methods include SVR, GPR, LR, and ELM. In Figures 12 and 13, M5, M6, M7, and M8 are the index value results of each method. By comparing the index values, it can be seen that the proposed method is optimal in all indicators, and the indicator values are basically less than 0.01. The integrated model based on multi-scale decomposition and deep network greatly improves the accuracy and stability of the prediction method, and other predictions Compared with the model, it shows superior performance.
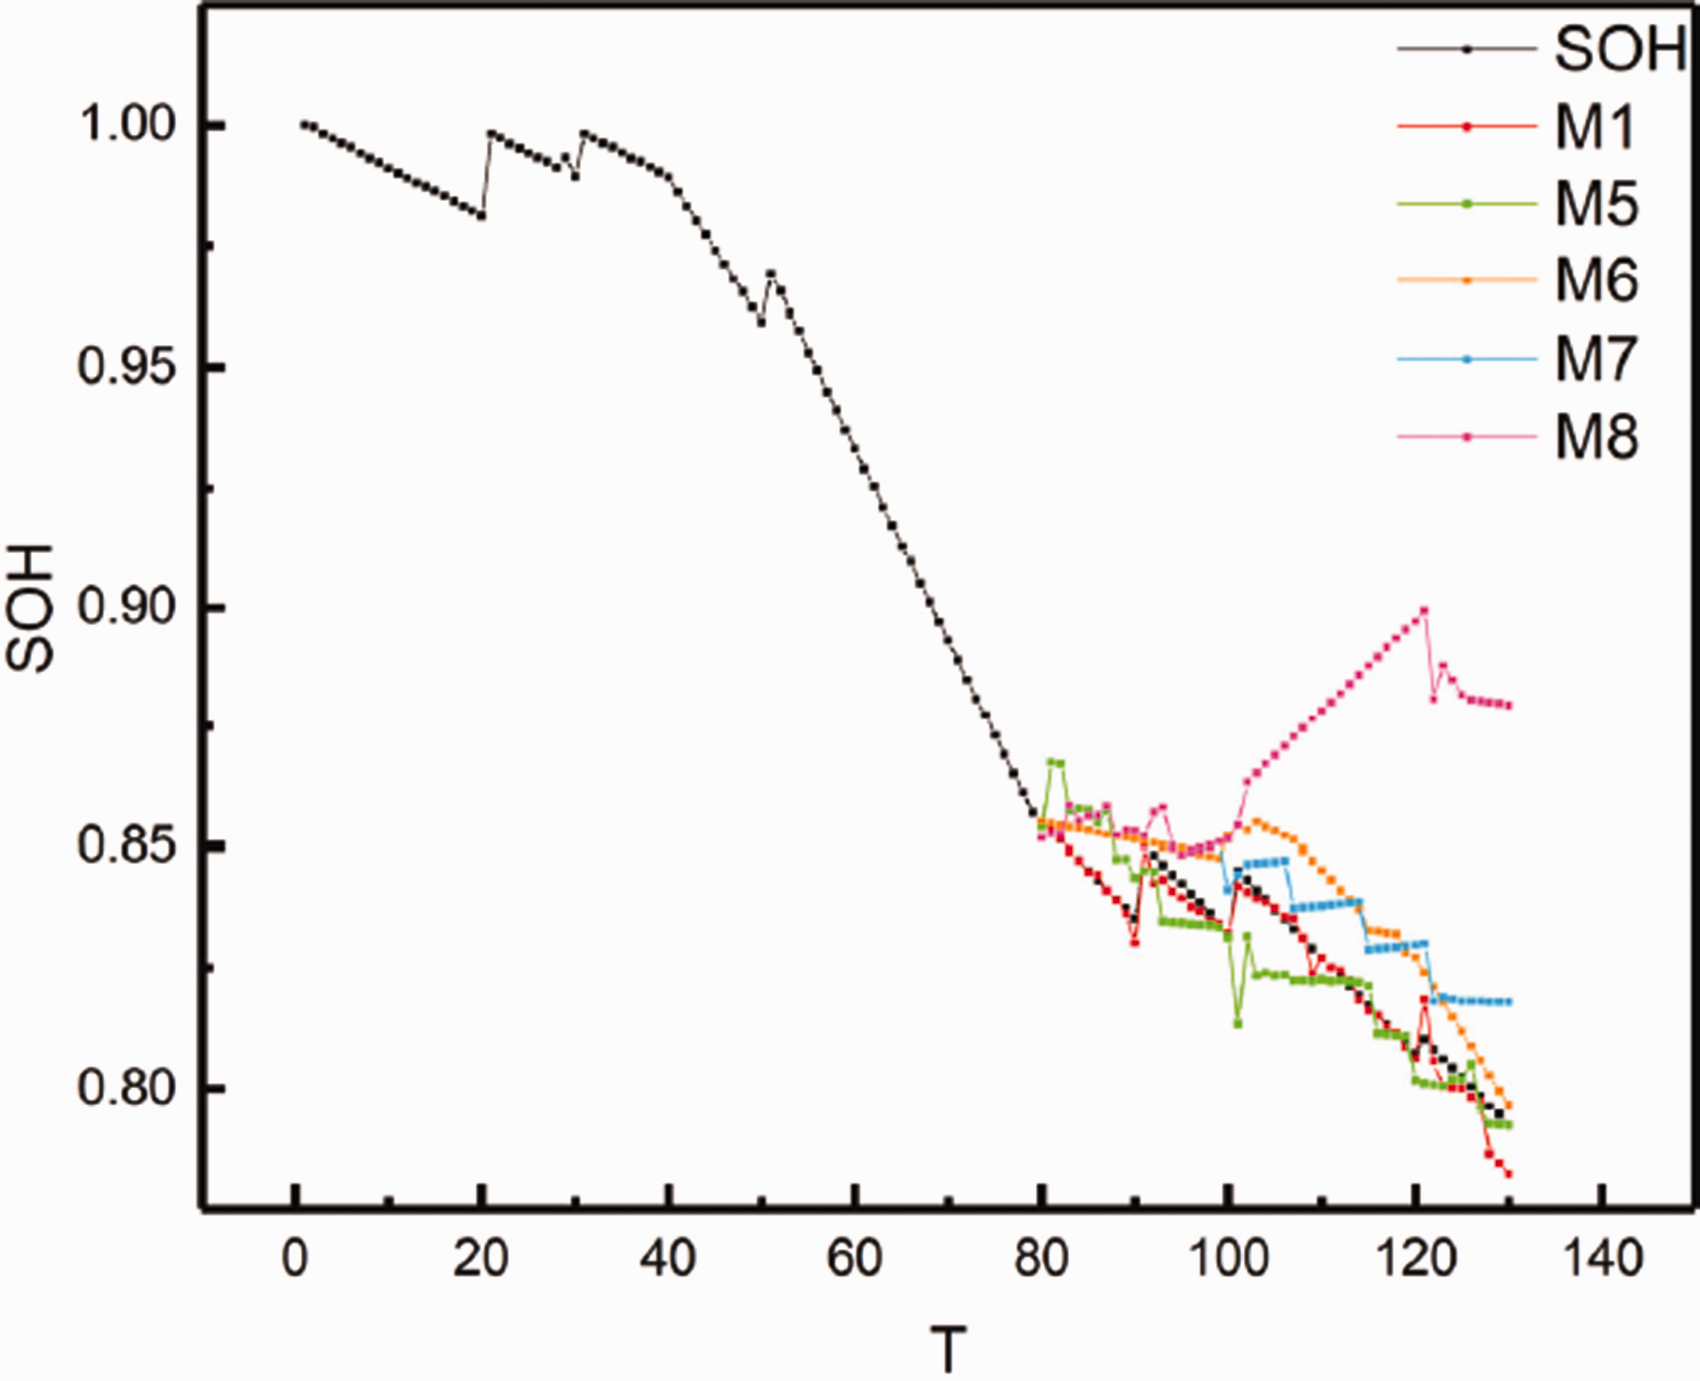
One-step prediction results of each contrast model.

Indicator values of each contrast model for one-step prediction.
Robustness verification (high-temperature adaptability)
Ambient temperature affects the state of the battery, and it is an important factor in testing the performance of the prediction method. To verify that the prediction method in this article has good stability when dealing with lithium battery data at high temperature, this method is applied to a set of medical lithium battery data. The test was performed in a high-temperature environment of 43°C. The battery has 126 data points. The first 80 groups were taken as the training set of the model, and the last 86 groups were used as the test set. Figure 14 shows the output of the prediction model. For medical lithium battery under the environment of high temperature, this method gives effective prediction results, accurately fits the actual data during the prediction phase, and achieves a fast response at the local rebirth phenomenon. This experiment proves the proposed integrated prediction method is capable of processing lithium battery data at high temperature. This method reflects good adaptability and practical application value.

Prediction results of high-temperature environment.
Conclusion
This article proposes a medical lithium battery health prediction model based on multi-scale decomposition and deep learning to effectively learn and predict the health trend change of medical lithium batteries. In this article, the capacity of medical lithium batteries is used as a health indicator. The data are divided into main trend data and fluctuation data through preprocessing, which significantly improves the prediction accuracy of the model. Based on the deep feature learning capabilities of deep learning, DBM and LSTM model the global trend and fluctuation of battery energy. The output of each model is integrated to obtain the final SOH prediction result. The experimental results verify the effectiveness and superiority of medical lithium battery health prediction based on multi-scale decomposition and deep learning.
Footnotes
Handling Editor: James Baldwin
Data availability statement
Medical lithium battery data come from Shanghai First People’s Hospital. Due to the special nature of medical electronic equipment and the confidentiality of hospitals, data cannot be made public.
Declaration of conflicting interests
The author(s) declared no potential conflicts of interest with respect to the research, authorship, and/or publication of this article.
Funding
The author(s) disclosed receipt of the following financial support for the research, authorship, and/or publication of this article: This article is supported by (1) Shanghai Polytechnic University Graduate Program Fund: EGD18YJ0003, (2) Subject funding of Shanghai Polytechnic University: XXKZD1603, and (3) Shanghai Science and Technology Agriculture Project: 2019-02-08-00-10-F01123.