
Abstract
The axial compressive experiments were carried out on 21 welded composite T-shaped concrete-filled steel tubular columns, and 395 finite element models were established for parameter calculation. The calculating formula of axial compressive bearing capacity of welded composite T-shaped concrete-filled steel tubular columns is established. The results show that three typical failure modes were found: middle buckling, end local buckling, and integral bending. When the slenderness ratio λ exceeds the elastic instability limit λp, the axial stress of steel is lower than yield strength fy, and the axial stress of core concrete is lower than axial compressive strength fc. Increasing the thickness of steel has a more obvious effect on increasing the axial compressive bearing capacity of specimen. The theoretical calculating formula can effectively predict the axial compressive bearing capacity, and the theoretical calculation is partial to safety. The average ratio of axial compressive bearing capacity of the theoretical calculation to the experimental is 0.909, and the standard deviation is 0.075. The average ratio of axial compressive bearing capacity of the finite element calculation to the experimental is 0.957, and the standard deviation is 0.045. The average ratio of axial compressive bearing capacity of the theoretical calculation to the finite element calculation is 0.951, and the standard deviation is 0.039.
Keywords
Introduction
In high-rise buildings, the application of concrete-filled steel tubular (CFST) columns can effectively solve the ratio of the axial loading to the cross-sectional area of bottom columns, and give full play to the advantages of high bearing capacity of CFST columns. At present, the cross section of CFST columns is mainly divided into circular, square, rectangular, and special shaped, among which the application of special-shaped CFST columns can effectively improve the indoor use area of high-rise buildings.1–5
Chen et al. 6 carried out axial compressive experiment on the ordinary T-shaped CFST short columns, analyzed the influence of the width thickness ratio of the steel tube and the height width ratio of the cross section on its mechanical performance, and finally discussed the applicability of the existing codes or regulations for calculating the axial compressive bearing capacity. Zuo et al. 7 conducted axial compressive experiment on T-shaped CFST short columns with binding bars; analyzed the influence of spacing of binding bars, thickness of steel and cross-section dimension on its mechanical performance; and finally discussed the applicability of the existing codes or regulations for calculating the axial compressive bearing capacity. Tu et al. 8 carried out axial compressive experiment on multi-cell composite T-shaped CFST short column; analyzed the influence of steel thickness, concrete strength, cross-section dimension on its mechanical performance; and finally discussed the applicability of the existing codes or regulations for calculating the axial compressive bearing capacity. Yang et al. 9 carried out axial compressive experiment on T-shaped CFST short columns with stiffeners, analyzed the influence of stiffener setting on its mechanical performance, and finally put forward the calculating formula of axial compression bearing capacity. Zhang et al. 10 carried out axial compressive experiment on multi-cell composite T-shaped CFST slender columns, analyzed the influence of cross-section dimension and slenderness ratio on its mechanical performance, and finally put forward the calculating formula of axial compressive bearing capacity. Zhao et al. 11 studied the axial compressive bearing capacity of multi-cell composite T-shaped CFST short columns, and based on the principle of equivalence and the unified strength theory, the calculating formula of axial compressive bearing capacity was established. Bian et al. 12 studied the seismic performance and failure modes of edge joint on T-shaped CFST-H-shaped steel beam and analyzed the influence of axial compression ratio and side plate extension length.
The above-mentioned researches on T-shaped CFST columns mainly focus on short columns, while the researches on medium long columns and long columns are relatively few. Meanwhile, there is no unified calculating method for axial compressive bearing capacity of different types of T-shaped CFST columns. Moreover, although the calculating formulas of axial compressive bearing capacity of different types of T-shaped CFST columns have been put forward in the above references, it is mainly obtained through experimental regression and has no generalization. Cao et al. 13 studied the validity of calculating formulas of axial compressive bearing capacity of different types of T-shaped CFST columns, compared the formulas calculation with the experimental results of welded composite T-shaped concrete-filled steel tubular (WCT-CFST) columns, and found that the formulas calculation are not in good agreement with the experimental results of WCT-CFST columns. The WCT-CFST columns are different from those above-mentioned T-shaped CFST columns. The cross section of WCT-CFST columns is directly formed by welding rectangular steel tube and U-shaped steel. Compared with those above-mentioned T-shaped CFST columns, the WCT-CFST columns are easier to manufacture. Therefore, we need to study the calculating method suitable for predicting the axial compressive bearing capacity of WCT-CFST columns.
In this article, the calculating method suitable for predicting the axial compressive bearing capacity of WCT-CFST columns is studied. The parameters influence on the axial compressive bearing capacity is analyzed. Based on the experiment and finite element simulation, the calculating formula of the axial compressive bearing capacity of WCT-CFST columns is established.
Experiment introduction and results
To further study the axial compressive bearing capacity of WCT-CFST columns, 21 specimens of WCT-CFST columns are designed. The main parameters are steel thickness, concrete strength, and slenderness ratio. The detailed parameters of the specimens are shown in Table 1. The cross section of specimen is shown in Figure 1. The measured thickness of steel used in specimen is 3.25, 4.25, 5.25, and 5.75 mm, respectively, and the average of yield strength of steel is 322 MPa. The strength grade of concrete is C30, C40, and C50, respectively, and the corresponding axial compressive strength is 27.3, 31.6, and 38.6 MPa respectively. The slenderness ratios are 10.392, 17.321, 24.249, 48.497, 62.354, and 76.210, respectively. The thickness of the top and bottom plates is 10 mm. Two displacement meters are arranged at the top and bottom plates of specimen to measure the axial compressive displacement, and three displacement meters are arranged at the side of specimen to measure the lateral displacement. Longitudinal and transverse strain gauges are arranged in the middle and end of specimen to measure the longitudinal and transverse strains. The experiment is carried out with 5000 kN electro-hydraulic servo controlled multi-purpose long column test setup, as shown in Figure 2. Three typical failure modes were found in specimens: middle buckling, end local buckling, and integral bending, as shown in Figure 3. The experimental results of axial compressive bearing capacity of specimens are shown in Table 2.
Specimens parameters.

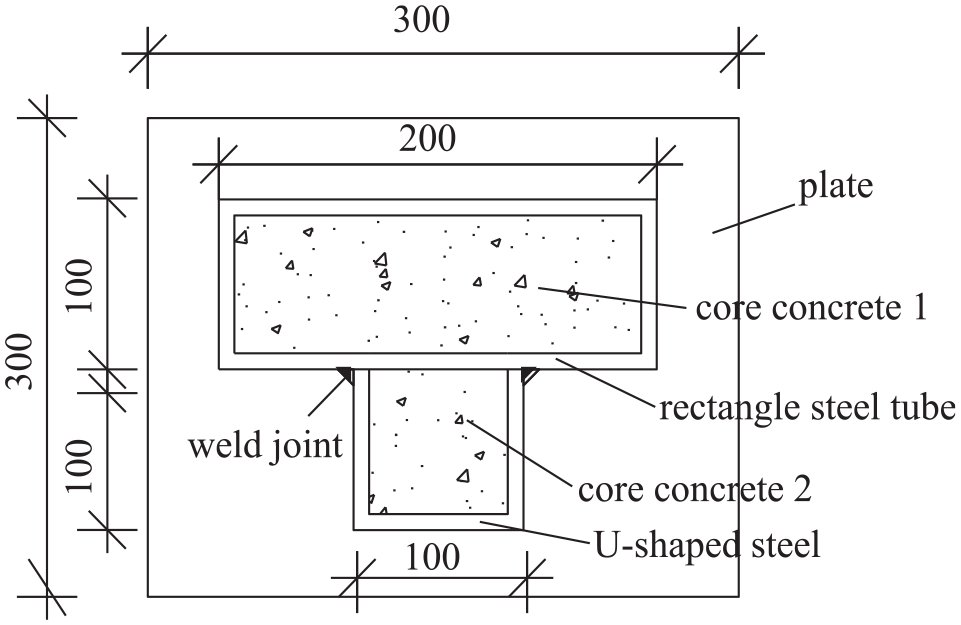
Cross-section diagram of specimen.

Test setup.

Three typical failure modes of specimens: (a) middle buckling, (b) end local buckling, and (c) integral bending.
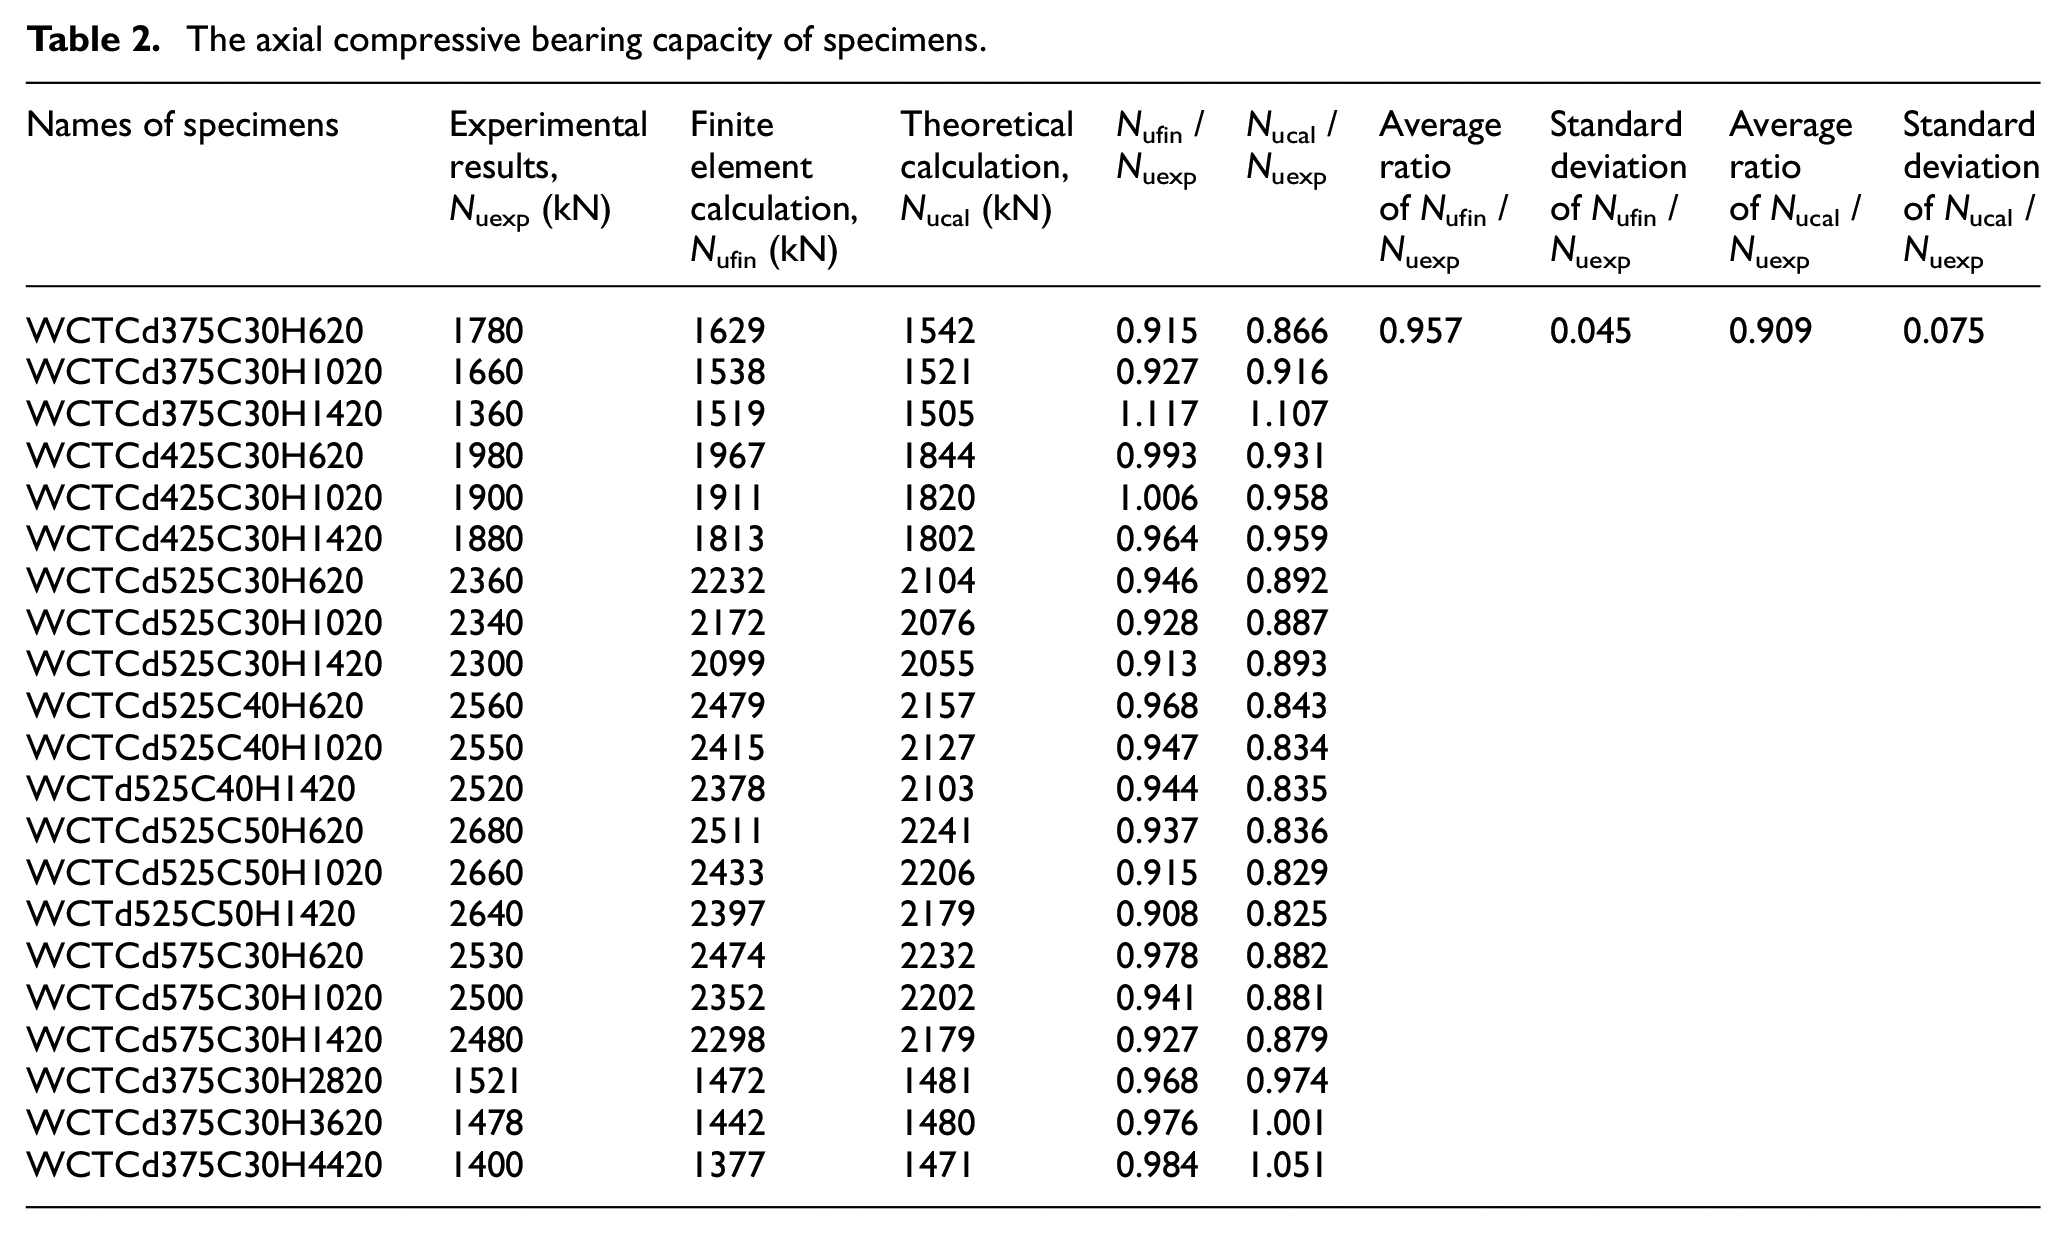
The axial compressive bearing capacity of specimens.
Finite element calculating
To further analyze the change trend of axial compressive bearing capacity of WCT-CFST columns, the finite element software ABAQUS was used to establish finite element models (FEMs) of WCT-CFST columns, and a total of 395 FEMs were established. The parameters of FEMs are the thickness of steel, concrete strength, and slenderness ratio. A vertical displacement load is applied to the top plates. According to the vertical deformation of the experimental specimens, the vertical displacement imposed by the finite element is 15 mm. The criterion of ending the finite element analysis is that the vertical displacement reaches 15 mm. An FEM is shown in Figure 4.

Finite element model.
FEM verification
In order to verify the validity of FEM, the failure modes and the curves of bearing capacity to the vertical displacement are compared, as shown in Figures 5 and 6. It can be seen from Figure 5 that the typical failure modes of finite element are basically the same as those of experiment, which are mainly manifested in three typical failure modes, that is, middle buckling, end local buckling, and integral bending. It can be seen from Figure 6 that the curves of bearing capacity to vertical displacement calculated by FEM are in good agreement with the change trend of experimental curves. The finite element calculating results of axial compressive bearing capacity of the experimental specimens are shown in Table 2. It can be seen from Table 2 that the average ratio of axial compressive bearing capacity of the finite element calculation to the experimental is 0.957, and the standard deviation is 0.045. Therefore, it is effective to use the FEM to calculate axial compressive bearing capacity of WCT-CFST columns.
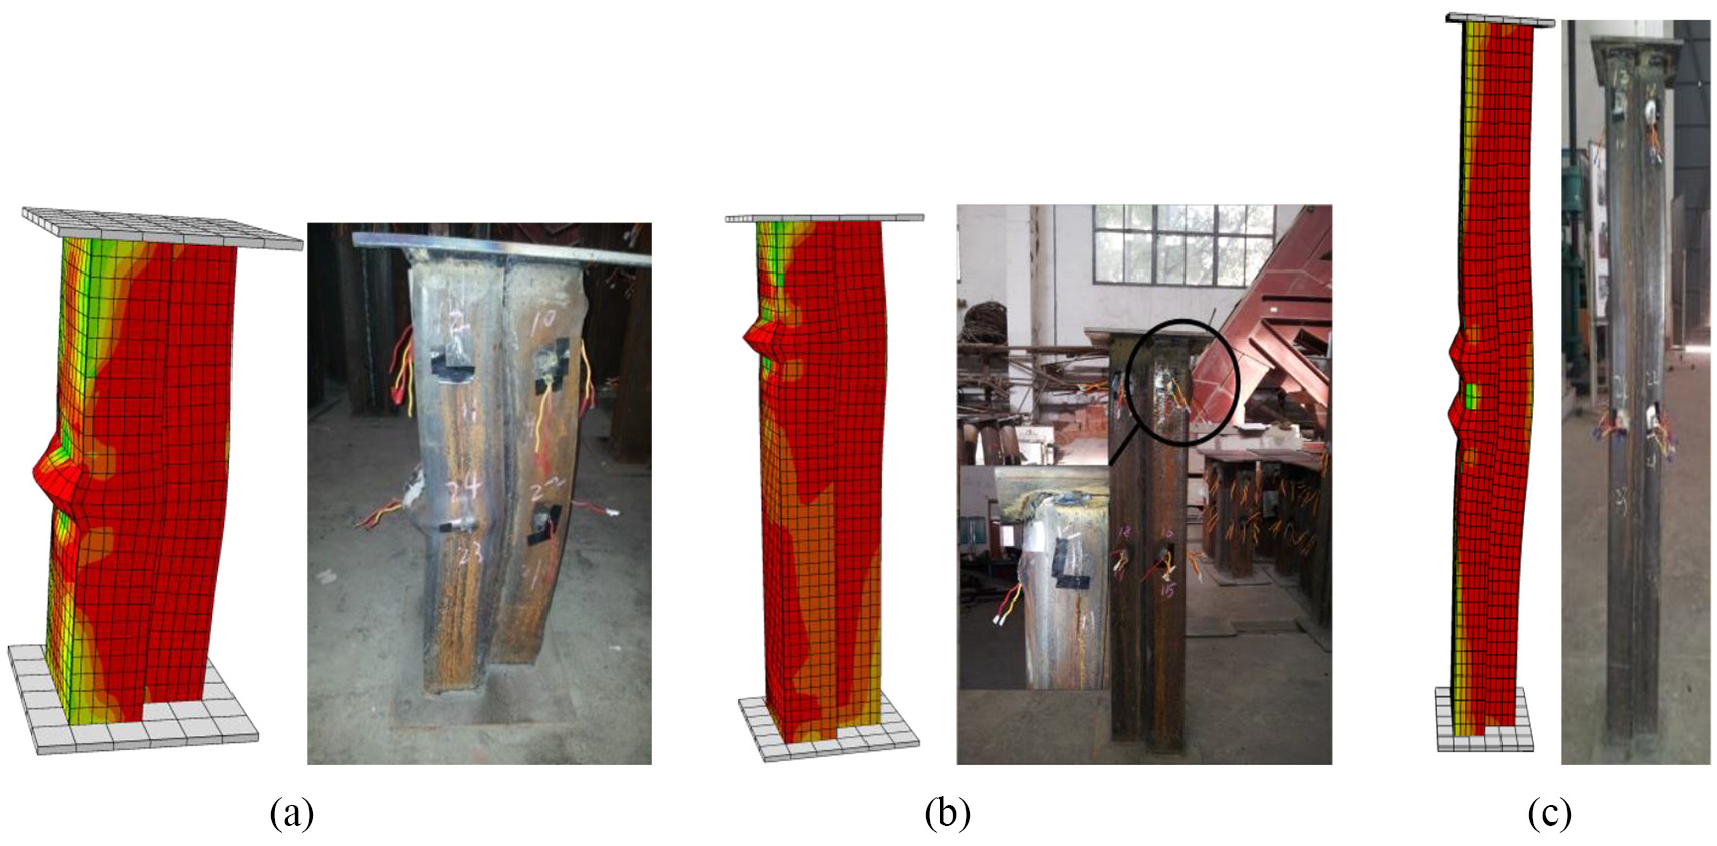
Comparison of typical failure modes of finite element to experiment: (a) middle buckling, (b) end local buckling, and (c) integral bending.
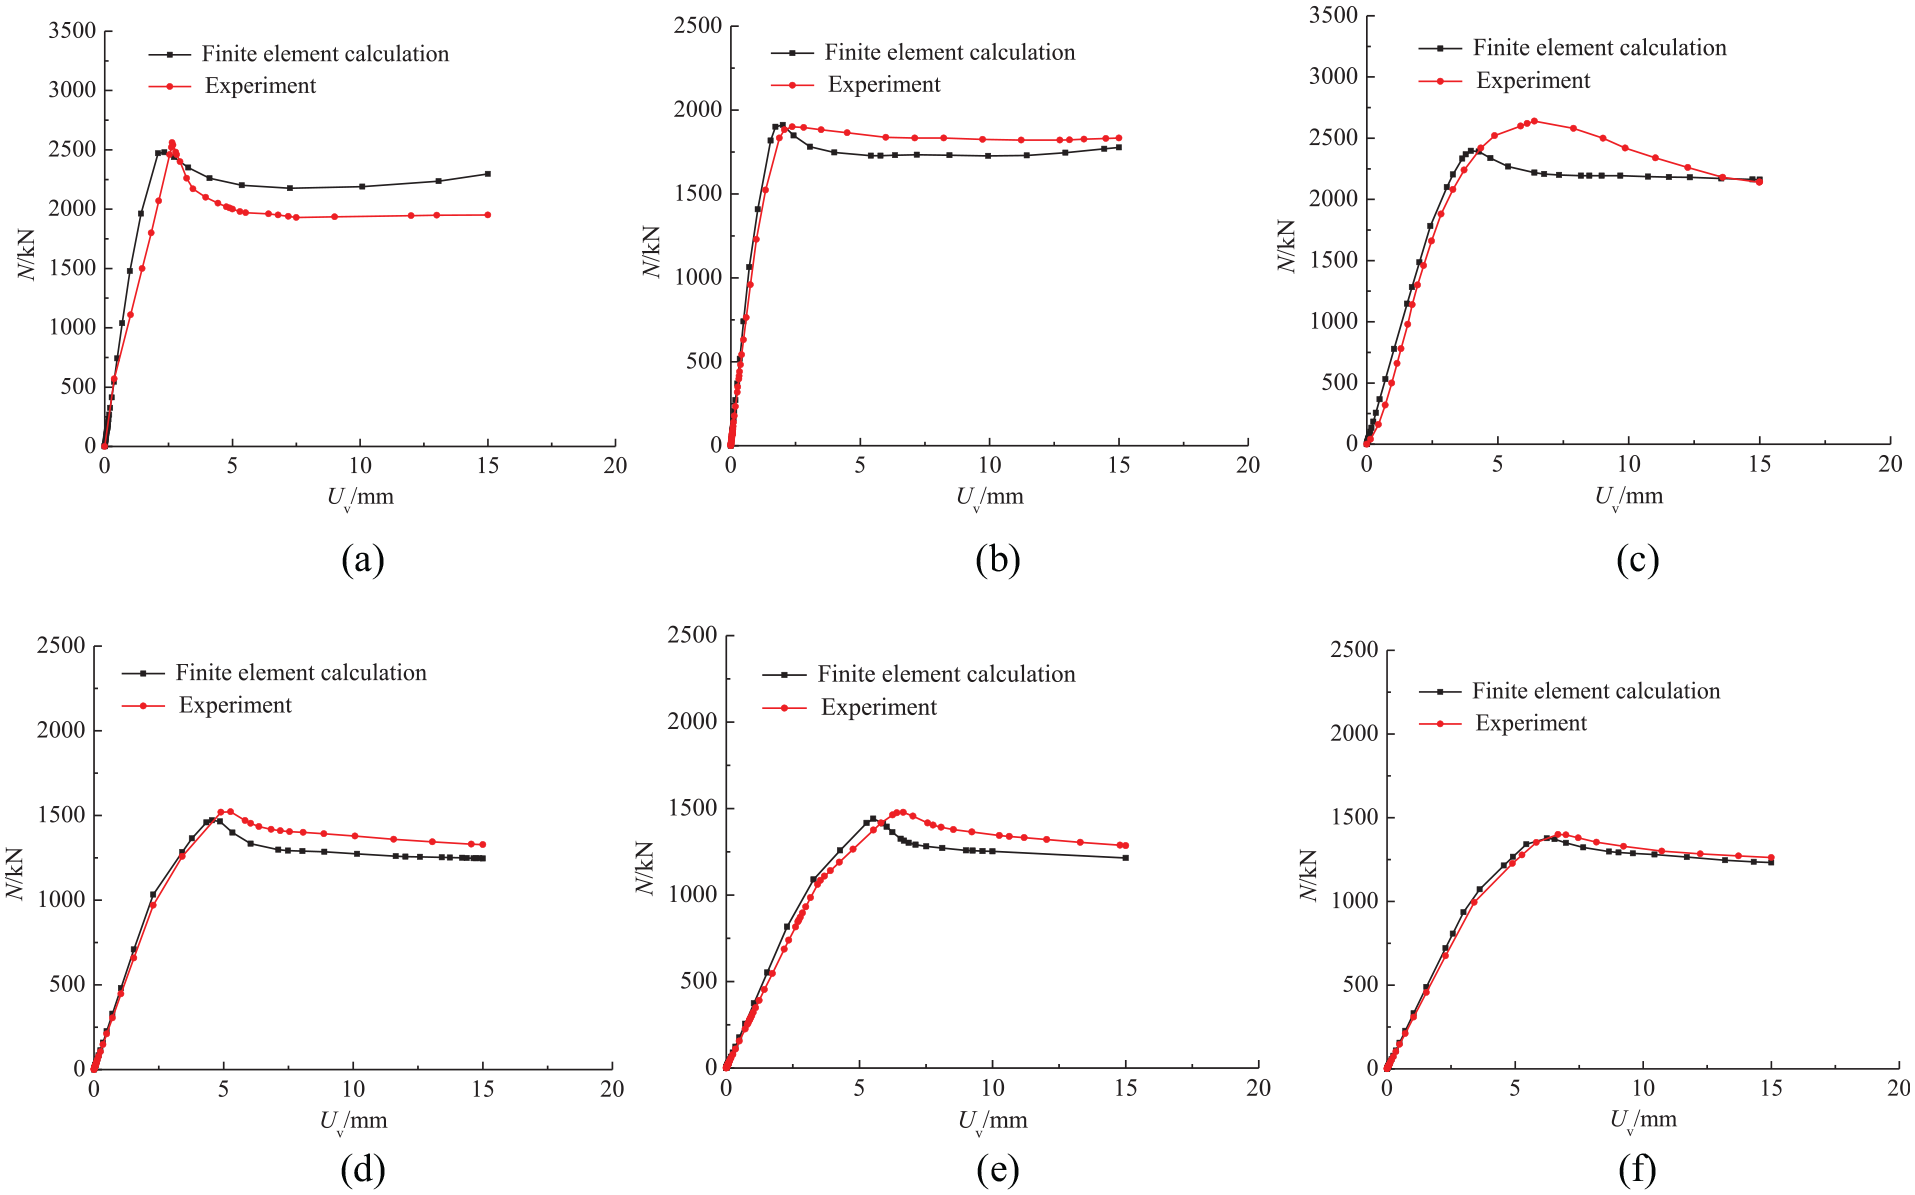
Comparison of curves of bearing capacity to vertical displacement of finite element to experiment: (a) WCTCd525C40H620, (b) WCTCd425C30H1020, (c) WCTCd525C50H1420, (d) WCTCd375C30H2820, (e) WCTCd375C30H3620, (f) WCTCd375C30H4420.
Analysis of finite element calculation
Axial stress analysis of steel
Figure 7 shows the comparison of axial stress of rectangular steel tube when axial compressive bearing capacity of WCT-CFST columns is reached. It can be seen from Figure 7 that when the thickness of steel and concrete strength are constant, the axial stress of rectangular steel tube gradually presents an uneven distribution state with the increase of slenderness ratio, and the axial stress in the middle area is obviously greater than that in the end area. Meanwhile, due to the bending deformation, there are tensile stress and compressive stress in rectangular steel tube. When the slenderness ratio λ increases from 41.569 to 304.841, the maximum axial stress of rectangular steel tube decreases from 362.76 to 222.41 MPa, and it decreases by 38.69%. At this time, the maximum axial stress of rectangular steel tube is lower than yield strength fy of steel, indicating the failure mode of rectangular steel tube is instability failure.

Comparison of axial stress of rectangular steel tube with different slenderness ratios: (a) t = 5.25 mm, fc = 31.6 MPa, λ = 41.569; (b) t = 5.25 mm, fc = 31.6 MPa, λ = 304.841.
Figure 8 shows the comparison of axial stress of rectangular steel tube when axial compressive bearing capacity of WCT-CFST columns is reached. It can be seen from Figure 8 that the axial stress distribution of U-shaped steel is basically similar to that of rectangular steel tube. When the slenderness ratio λ increases from 41.569 to 304.841, the maximum axial stress of rectangular steel tube decreases from 559.78 to 322.66 MPa, and it decreases by 42.36%. At this time, the maximum axial stress of U-shaped steel is lower than yield strength fy of steel, indicating that the failure mode of U-shaped steel is instability failure.

Comparison of axial stress of U-shaped steel with different slenderness ratios: (a) t =5.25 mm, fc = 31.6 MPa, λ = 41.569; (b) t = 5.25 mm, fc = 31.6 MPa, λ = 304.841.
Axial stress analysis of core concrete
Figure 9 shows the comparison of axial stress of core concrete 1 when axial compressive bearing capacity of WCT-CFST columns is reached. It can be seen from Figure 9 that when the thickness of steel and concrete strength are constant, the axial stress of core concrete 1 decreases with the increase of slenderness ratio, and the axial stress in the middle area is gradually greater than that in the end area. When the slenderness ratio λ increases from 41.569 to 304.841, the maximum axial stress of core concrete 1 decreases from 46.64 to 21.42 MPa, and it decreases by 54.07%. At this time, the maximum axial stress of core concrete 1 is lower than axial compressive strength fc of concrete, indicating that the failure mode of core concrete 1 is instability failure.

Comparison of axial stress of core concrete 1 with different slenderness ratios: (a) t = 5.25 mm, fc = 31.6 MPa, λ = 41.569; (b) t =5.25 mm, fc = 31.6 MPa, λ = 304.841.
Figure 10 shows the comparison of axial stress of core concrete 2 when axial compressive bearing capacity of WCT-CFST columns is reached. It can be seen from Figure 10 that when the thickness of steel and concrete strength are constant, the axial stress of core concrete 2 decreases with the increase of slenderness ratio, and the axial stress in the middle area is gradually greater than that in the end area. When the slenderness ratio λ increases from 41.569 to 304.841, the maximum axial stress of core concrete 2 decreases from 49.39 to 23.71 MPa, and it decreases by 51.99%. At this time, the maximum axial stress of core concrete 2 is lower than axial compressive strength fc of concrete, indicating that the failure mode of core concrete 2 is instability failure. Compared with the maximum axial stress of core concrete 1 shown in Figure 9, it indicates that the U-shaped steel has a stronger constraint on the core concrete 2 under the same conditions.

Comparison of axial stress of core concrete 2 with different slenderness ratios: (a) t = 5.25 mm, fc = 31.6 MPa, λ = 41.569; (b) t = 5.25 mm, fc = 31.6 MPa, λ = 304.841.
Bearing capacity analysis of steel and concrete
Figure 11 shows the comparison of bearing capacity of steel with different slenderness ratios. The standard bearing capacity in Figure 11 is defined as the product of yield strength fy of steel and its cross-section area. It can be seen from Figure 11 that when the thickness of steel and concrete strength are constant, the axial compressive bearing capacity of rectangular steel tube and U-shaped steel decreases with the increase of slenderness ratio λ, and the axial compressive bearing capacity of rectangular steel tube and U-shaped steel are lower than standard bearing capacity. When the slenderness ratio λ increases from 41.569 to 304.841, the axial compressive bearing capacity of rectangular steel tube decreases by 79.05%, and that of U-shaped steel decreases by 16.72%. It can be seen from Figure 11(a) that before reaching the axial compressive bearing capacity, the slower the bearing capacity of rectangular steel tube increases with the increase of slenderness ratio λ, the faster the axial deformation increases; after reaching the axial compressive bearing capacity, the faster the bearing capacity of rectangular steel tube decreases with the increase of slenderness ratio λ. It can be seen from Figure 11(b) that before reaching the axial compressive bearing capacity, the slower the bearing capacity of U-shaped steel increases with the increase of slenderness ratio λ, the faster the axial deformation increases; after reaching the axial compressive bearing capacity, the faster the bearing capacity of U-shaped steel decreases with the increase of slenderness ratio λ.

Comparison of bearing capacity of steel with different slenderness ratios: (a) rectangular steel tube, (b) U-shaped steel.
Figure 12 shows the comparison of bearing capacity of core concrete with different slenderness ratios. The standard bearing capacity in Figure 12 is defined as the product of axial compressive strength fc of concrete and its cross-section area. It can be seen from Figure 12 that when the thickness of steel and concrete strength are constant, the axial compressive bearing capacity of core concrete 1 and core concrete 2 decreases with the increase of slenderness ratio λ, and the axial compressive bearing capacity of core concrete 1 and core concrete 2 are lower than standard bearing capacity. When the slenderness ratio λ increases from 41.569 to 304.841, the axial compressive bearing capacity of core concrete 1 decreases by 63.94%, and that of core concrete 2 decreases by 42.97%. Compared with Figure 12(a) and (b), when the slenderness ratio λ is small, the axial compressive bearing capacity of core concrete 2 is significantly higher than the standard bearing capacity, which shows that the U-shaped steel has a stronger constraint on core concrete 2.
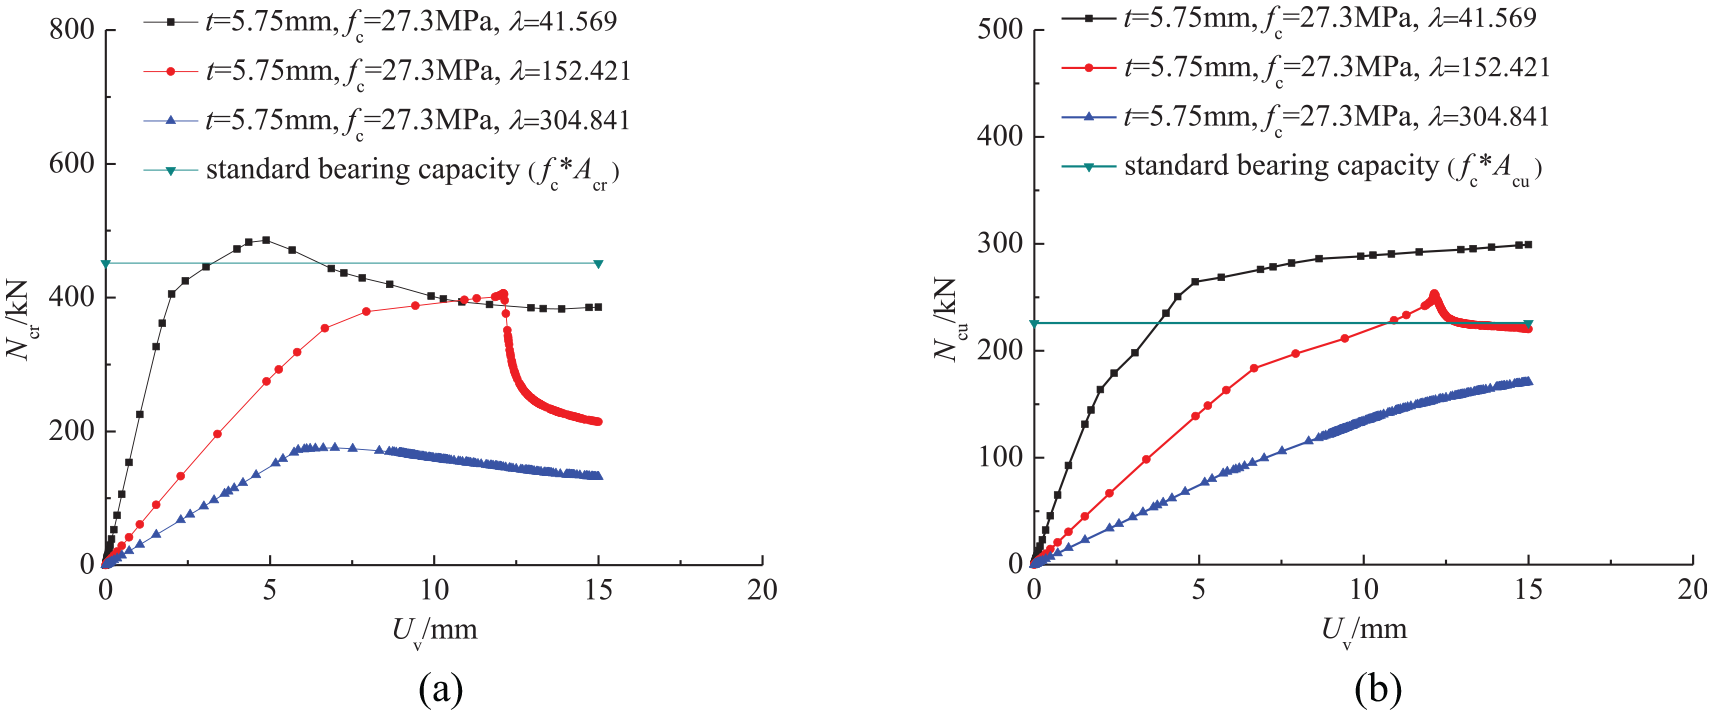
Comparison of bearing capacity of core concrete with different slenderness ratios: (a) core concrete 1 in rectangular steel tube, (b) core concrete 2 in U-shaped steel.
Parameters analysis of bearing capacity
Figure 13 shows the comparison of curves of bearing capacity to vertical displacement of WCT-CFST columns with different parameters. It can be seen from Figure 13 that when the thickness of steel and slenderness ratio are constant, the change of concrete strength has a little influence on the curves of bearing capacity to vertical displacement. When the concrete strength and slenderness ratio are constant, the thickness of steel has a great influence on the curves of bearing capacity to vertical displacement. When the thickness of steel and concrete strength are constant, the change of slenderness ratio has a great influence on the curves of bearing capacity to vertical displacement, and the larger slenderness ratio is, the lower axial compressive bearing capacity is. It can be seen from Figure 13(a)–(d) that when the thickness of steel and the slenderness ratio are constant, the concrete strength increases from 27.3 to 38.6 MPa, and its axial compressive bearing capacity increases. When the thickness of steel is 3.75 mm and slenderness ratio is 41.569, 152.421, and 304.841, respectively, the increase of axial compressive bearing capacity is 14.86%, 13.13%, and 1.99%, respectively. When the thickness of steel is 4.25 mm and slenderness ratio is 41.569, 152.421, and 304.841 respectively, the increase of axial compressive bearing capacity is 7.72%, 4.58%, and 1.44%, respectively. When the thickness of steel is 5.25 mm and slenderness ratio is 41.569, 152.421, and 304.841, respectively, the increase of axial compressive bearing capacity is 8.62%, 10.96%, and 1.49%, respectively. When the thickness of steel is 5.75 mm and slenderness ratio is 41.569, 152.421, and 304.841, respectively, the increase of axial compressive bearing capacity is 5.10%, 4.72%, and 1.46%, respectively. It is shown that the increase of concrete strength has a little influence on the axial compressive bearing capacity. It can be seen from Figure 13(e)–(g) that when the concrete strength and slenderness ratio are constant, the thickness of steel increases from 3 to 6 mm, and its axial compressive bearing capacity increases greatly. When the concrete strength is 27.3 MPa and slenderness ratio is 41.569, 152.421, and 304.841, respectively, the increase of axial compressive bearing capacity is 48.81%, 67.95%, and 65.83%, respectively. When the concrete strength is 31.6 MPa and slenderness ratio is 41.569, 152.421, and 304.841, respectively, the increase of axial compressive bearing capacity is 45.49%, 63.91%, and 65.30%, respectively. When the concrete strength is 38.6 MPa and slenderness ratio is 41.569, 152.421, and 304.841, respectively, the increase of axial compressive bearing capacity is 36.17%, 55.47%, and 64.95% respectively. It is shown that increasing the thickness of steel is more effective to increase the axial compressive bearing capacity.

Comparison of curves of bearing capacity to vertical displacement of WCT-CFST columns with different parameters: (a) t = 3.75 mm, (b) t = 4.25 mm, (c) t = 5.25 mm, (d) t = 5.75 mm, (e) fc =27.3 MPa, (f) fc =31.6 MPa, (g) fc =38.6 MPa.
Figure 14 shows the comparison of axial compressive bearing capacity of WCT-CFST columns with different parameters. It can be seen from Figure 14 that under different concrete strength, increasing the thickness of steel can effectively increase axial compressive bearing capacity, and when the concrete strength is low, increasing the thickness of steel has a greater effect on axial compressive bearing capacity. Under different thicknesses of steel, the effect of increasing concrete strength on axial compressive bearing capacity is small, and when the thickness of steel is large, the effect of increasing concrete strength on axial compressive bearing capacity is smaller. Under different concrete strength and steel thicknesses, the axial compressive bearing capacity decreases with the increase of slenderness ratio, and the decreasing trend is from small to large and then to small. It can be seen from Figure 14(a)–(c) that when the thickness of steel is constant and the strength grade of concrete is high, with the increase of slenderness ratio, the axial compressive bearing capacity decreases more obviously. When the concrete strength is constant and the slenderness ratio is large, the influence of thickness of steel on axial compressive bearing capacity becomes small. It can be seen from the Figure 14(d)–(g) that under different concrete strength, the larger the thickness of steel is, the smaller the decreasing trend of axial compressive bearing capacity is with the increase of slenderness ratio. Under different thicknesses of steel, the increase of concrete strength has a little effect on the decreasing trend of axial compressive bearing capacity with the increase of slenderness ratio. When the thickness of steel is constant, the influence of concrete strength on axial compressive bearing capacity becomes smaller with the increase of slenderness ratio.
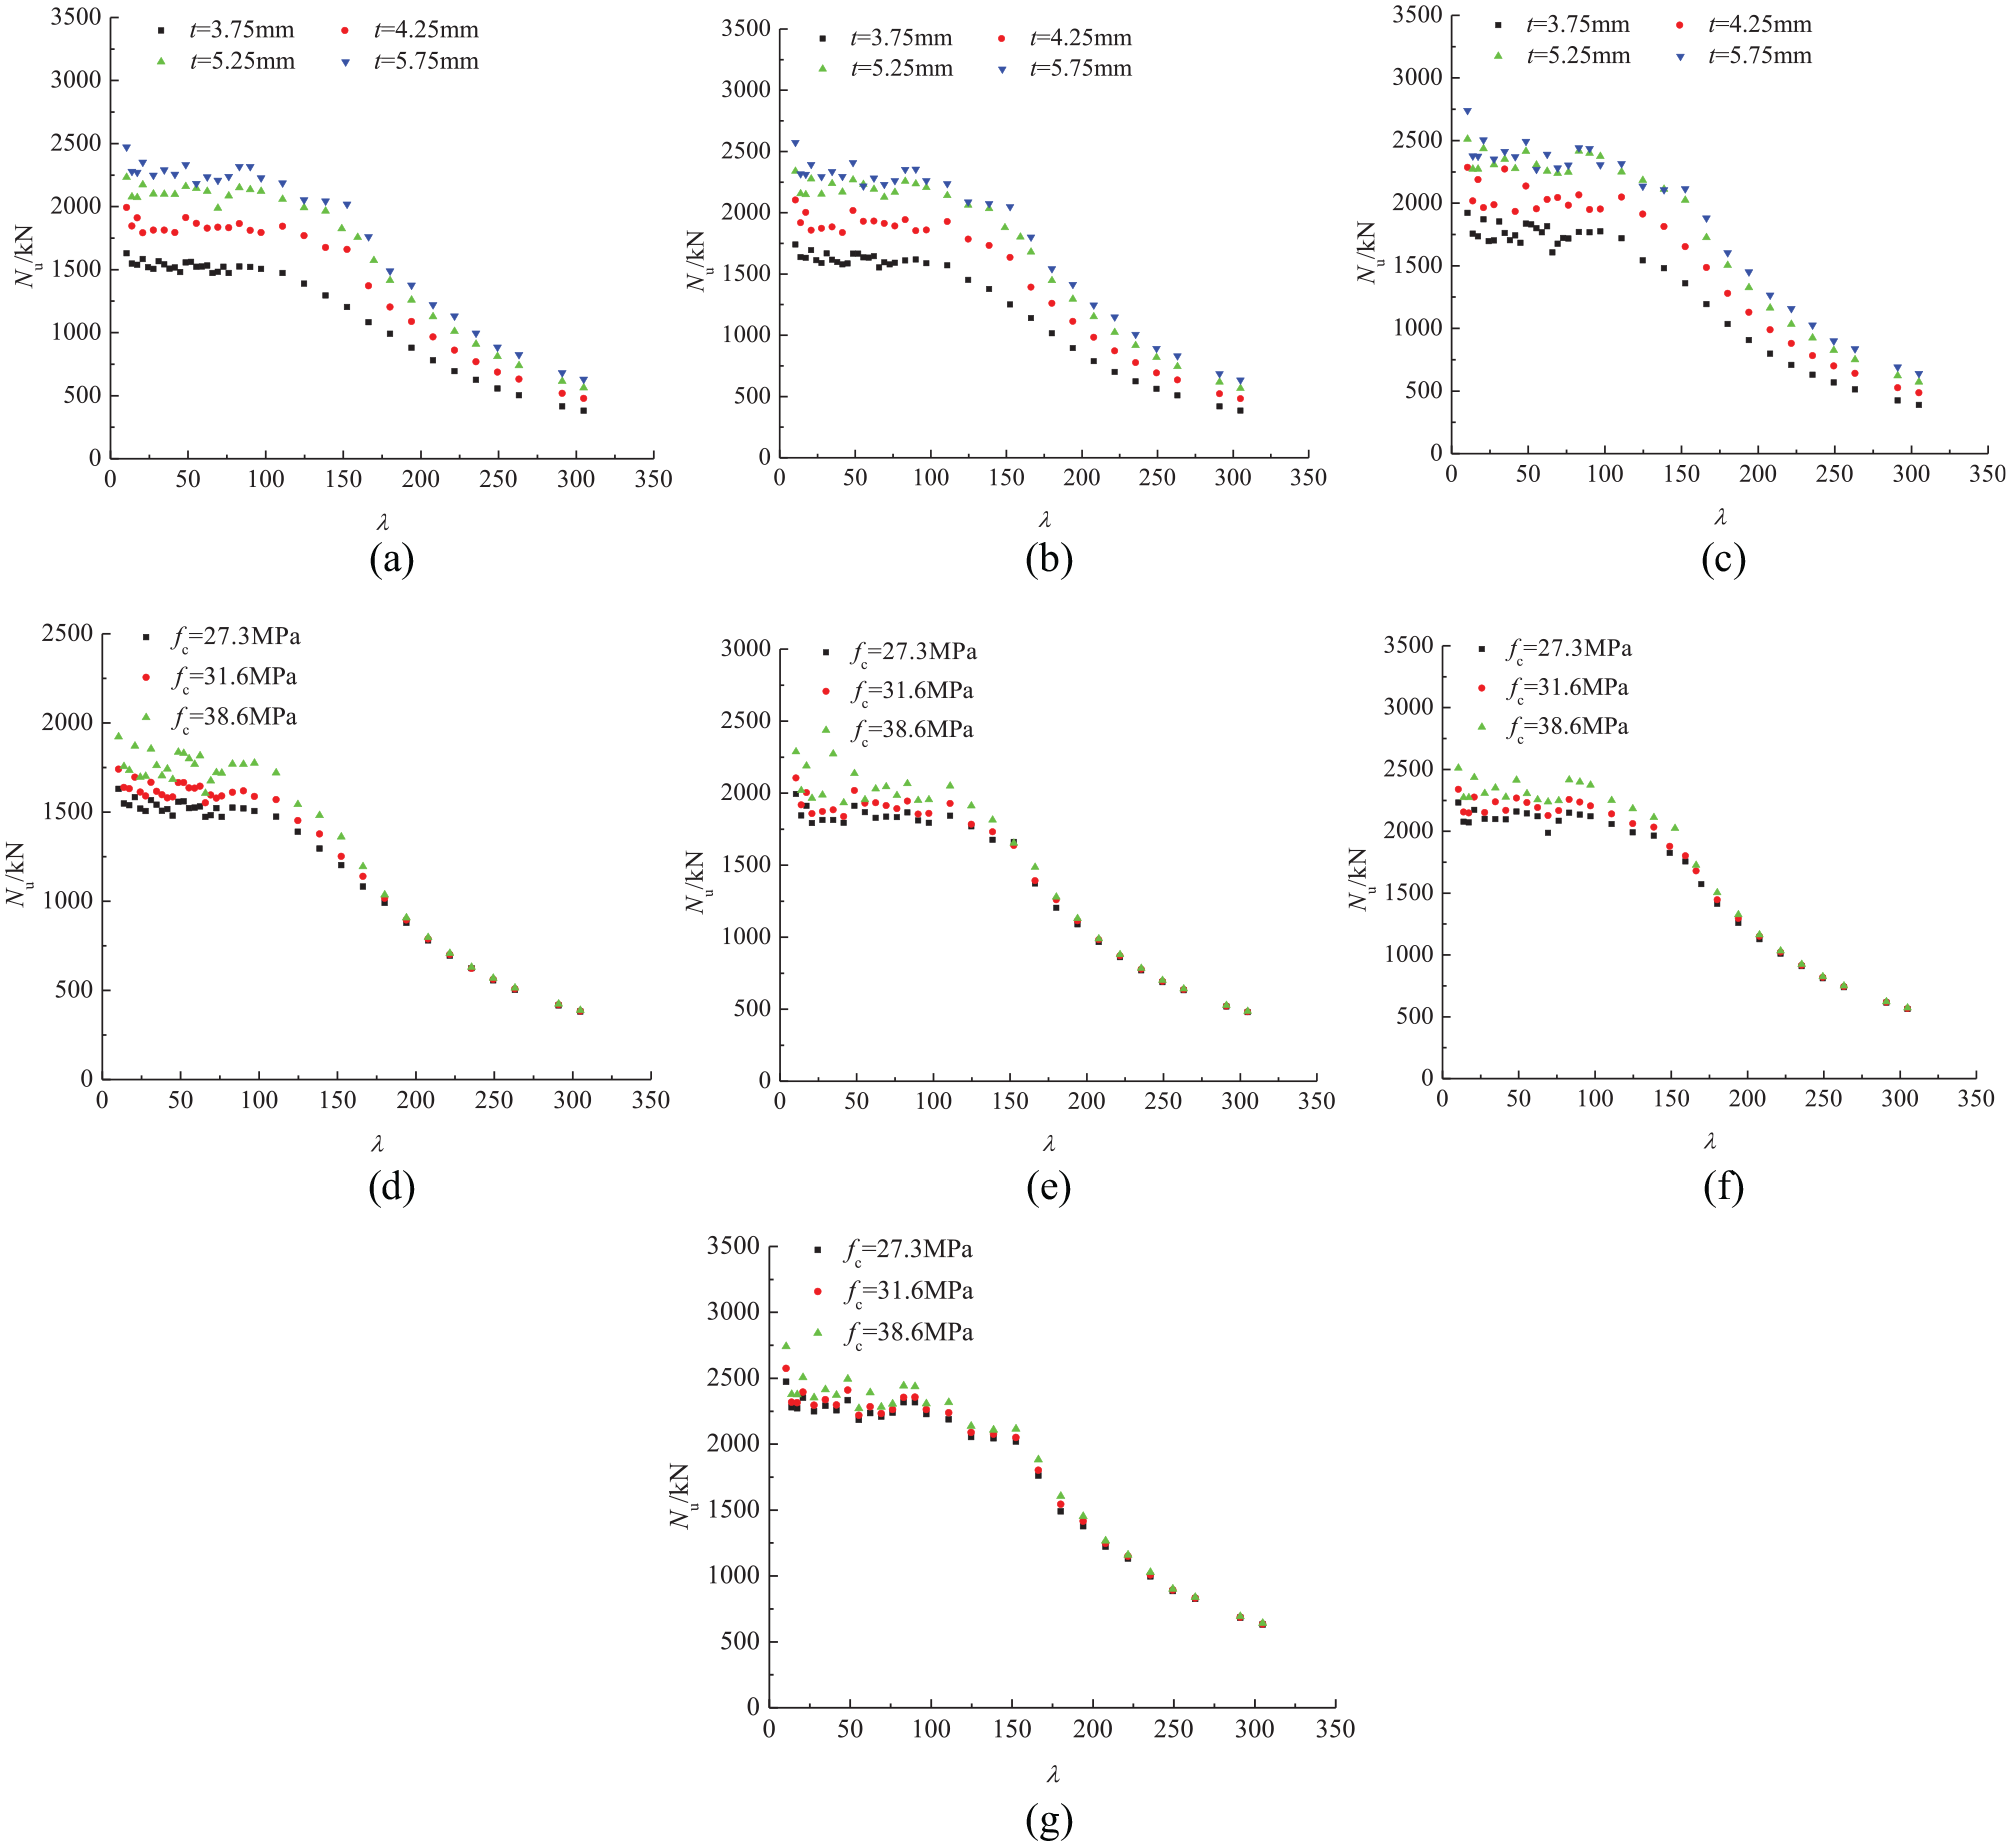
Comparison of axial compressive bearing capacity of WCT-CFST columns with different parameters: (a) fc =27.3 MPa, (b) fc =31.6 MPa, (c) fc =38.6 MPa, (d) t = 3.75 mm, (e) t = 4.25 mm, (f) t = 5.25 mm, (g) t = 5.75 mm.
Theoretical analysis of calculating method of axial compressive bearing capacity of WCT-CFST columns
Calculating method of axial compressive bearing capacity of WCT-CFST short columns
From the analysis in “Bearing capacity analysis of steel and concrete” section, it can be seen that due to the different constraining effects of rectangular steel tube and U-shaped steel on the core concrete, the axial compressive bearing capacity of core concrete 1 and core concrete 2 is different. Therefore, the axial compressive bearing capacity of WCT-CFST short columns is mainly composed of four parts: rectangular steel tube, U-shaped steel, core concrete 1 in rectangular steel tube, and core concrete 2 in U-shaped steel tube. According to the static equilibrium condition of cross-section, the calculating formula of axial compressive bearing capacity of WCT-CFST short columns is as shown in equation (1)

where σszr is the axial stress of rectangular steel tube; σszu is the axial stress of U-shaped steel; σczr is the axial stress of core concrete 1 in rectangular steel tube; σczu is the axial stress of core concrete 2 in U-shaped steel; Asr is the cross-sectional area of rectangular steel tube; Asu is the cross-sectional area of U-shaped steel; Acr is the cross-sectional area of core concrete 1 in rectangular steel tube; Acu is the cross-sectional area of core concrete 2 in U-shaped steel.
Multi-axial stress of WCT-CFST short columns
Basic assumption
The following basic assumptions shall be adopted for the calculation of axial compressive bearing capacity of WCT-CFST short columns:16–18 (1) Both rectangular steel tube and U-shaped steel obey Von-Mises yield criterion under multi-axial stress; (2) ignoring the influence of radial stress of rectangular steel tube and U-shaped steel, the stress state of rectangular steel tube and U-shaped steel is simplified as two-way stress state of axial compression and circumferential tension, and distributed uniformly along steel wall; (3) the core concrete is in the state of tri-axial stress under three-dimensional compression, and its stress is directly calculated by the calculating formula recommended in Mander model.
Axial stress of rectangular steel tube and U-shaped steel
Ge and Usami 19 show that the width thickness ratio of steel has a great influence on axial stress of steel. The calculating formula of width thickness ratio R is shown in equation (2)
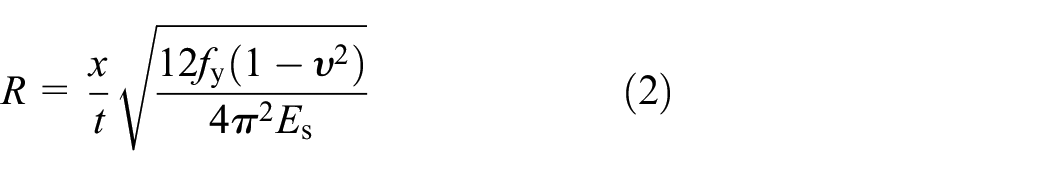
where x is the width of long side of rectangular steel tube (or U-shaped steel); t is the thickness of steel; fy is the yield strength of steel; Es is the elastic modulus of the steel; ν is the Poisson’s ratio of steel, approximately 0.28.
According to the research results of Ge and Usami 19 and Sakino and Nakahara 20 and the above-mentioned basic assumptions, when the WCT-CFST short columns reach the axial compressive bearing capacity, the calculating formulas of axial stress σsz and circumferential stress σsh of steel are shown in equation (3) and (4), respectively


Axial stress of core concrete
Due to the different constraining effect of rectangular steel tube and U-shaped steel on core concrete, the axial stress of core concrete is different when the axial compressive bearing capacity is reached. According to Mander model, the calculating formula of axial stress σcz of core concrete is shown in equation (5)

where σcz0 is the axial compressive strength of unconstrained concrete; fi, min is the minimum effective lateral constraining stress of rectangular steel tube (or U-shaped steel) to core concrete.
Effective lateral constraining stress fi
When calculating the effective lateral constraining stress of rectangular steel tube (or U-shaped steel) to core concrete, it is assumed that the effective lateral constraining stress is evenly distributed around steel wall, and the calculating formula of effective lateral constraining stress fi is shown in equation (6)

where, i = 1–2; ke is the effective lateral constraining coefficient of steel to core concrete;
Average effective lateral constraining stress
Figure 15 is a schematic diagram of the average effective lateral constraining stress of rectangular steel tube to core concrete 1. According to the static equilibrium condition, the calculating formula of average effective lateral constraining stress

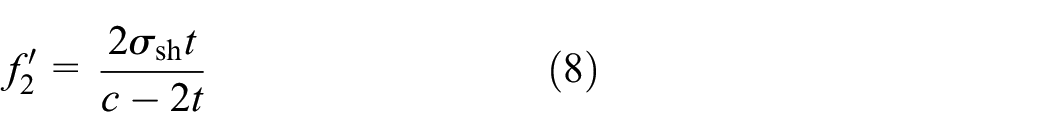
Similarly, the calculating formula of average effective lateral constraining stress
Effective lateral constraining coefficient ke
The constraint of rectangular steel tube and U-shaped steel to core concrete is divided into strong constraint area and weak constraint area. The starting angle of parabola in weak constraint area is θ, and the starting angle is not more than 15°, as shown in Figure 16. The effective lateral restraint coefficient ke is defined as the ratio of strong constraint area of core concrete Aqi and total area of core concrete Ai, and its calculating formula is shown in equation (9)

From Figure 16, the calculating formula of effective lateral constraining coefficient ke1 of core concrete 1 can be obtained, as shown in equation (10)

Similarly, the calculating formula of effective lateral constraining coefficient ke2 of core concrete 1 is shown in equation (11)

Average effective lateral constraining stress of rectangular steel tube to core concrete 1.

Constraint of rectangular steel tube and U-shaped steel to core concrete.
Calculating method of axial compressive bearing capacity of WCT-CFST long columns
It can be seen from the analysis in “Parameters analysis of bearing capacity” section that with the increase of slenderness ratio, the axial compressive bearing capacity of WCT-CFST columns decreases. Therefore, the equation for calculating the axial compressive bearing capacity Nul of a long column is shown in equation (12)

where φ is the stability coefficient of axial compressive bearing capacity of long column.
Scatter diagram of relationship between stability coefficient φ and slenderness ratio λ
Figure 17 is the scatter diagram comparison of φ–λ relationship of WCT-CFST columns under different parameters. It can be seen from Figure 17 that the thickness of steel and concrete strength influence the scatter diagram of φ–λ relationship. When the concrete strength is high, the thickness of steel has a greater influence on the scatter diagram of φ–λ relationship. When the thickness of steel is small, the concrete strength has a greater influence on the scatter diagram of φ–λ relationship.

Scatter diagram comparison of φ–λ relationship of WCT-CFST columns under different parameters: (a) fc =27.3 MPa, (b) fc =31.6 MPa, (c) fc =38.6 MPa, (d) t = 3.75 mm, (e) t = 4.25 mm, (f) t = 5.25 mm, (g) t = 5.75 mm.
Calculating formula of relationship between stability coefficient φ and slenderness ratio λ
In order to further analyze the calculating formula of relationship between stability coefficient φ and slenderness ratio λ, according to the change trend of the φ–λ relationship shown in Figure 17, the φ–λ relationship can be simplified to the curve shown in Figure 18. It can be seen from Figure 18 that the simplified φ–λ curve is mainly divided into three stages: when λ ≤ λo, it belongs to strength failure, stability coefficient φ = 1; when λo < λ ≤ λp, it belongs to elastic-plastic instability failure, and the cross-section is in elastic-plastic stage; when λ > λp, it belongs to elastic instability failure, and the cross section is in elastic stage.

Simplified φ–λ curve.
Through regression analysis of the experiment and finite element calculation, the calculating formula of relationship between stability coefficient φ and slenderness ratio λ is shown in equation (13)


where λo and λp are the limit slenderness ratios of WCT-CFST columns in case of elastic-plastic or elastic instability.
Comparison between theoretical calculation and experiment of axial compressive bearing capacity
In order to verify the accuracy of theoretical calculating formula of axial compressive bearing capacity of WCT-CFST columns, 395 WCT-CFST columns are calculated by the equations (1)–(21), and the theoretical calculation is compared with experiment and finite element calculation, as shown in Figures 19 and 20. The theoretical calculating results of axial compressive bearing capacity of the experimental specimens are shown in Table 2. It can be seen from Figure 19 and Table 2 that the theoretical calculation is in good agreement with the experiment. The average ratio of the theoretical calculation Nucal to the experimental Nuexp is 0.909, and the standard deviation is 0.075. It can be seen from Figure 20 that the theoretical calculation is in good agreement with the finite element calculation. The average ratio of the theoretical calculation Nucal to the finite element calculation Nufin is 0.951, and the standard deviation is 0.039. It can also be seen from Figures 19 and 20 that the theoretical calculation of axial compressive bearing capacity is safer than the experiment and finite element calculation. It shows that the theoretical calculating formula is suitable for predicting axial compressive bearing capacity of WCT-CFST columns.
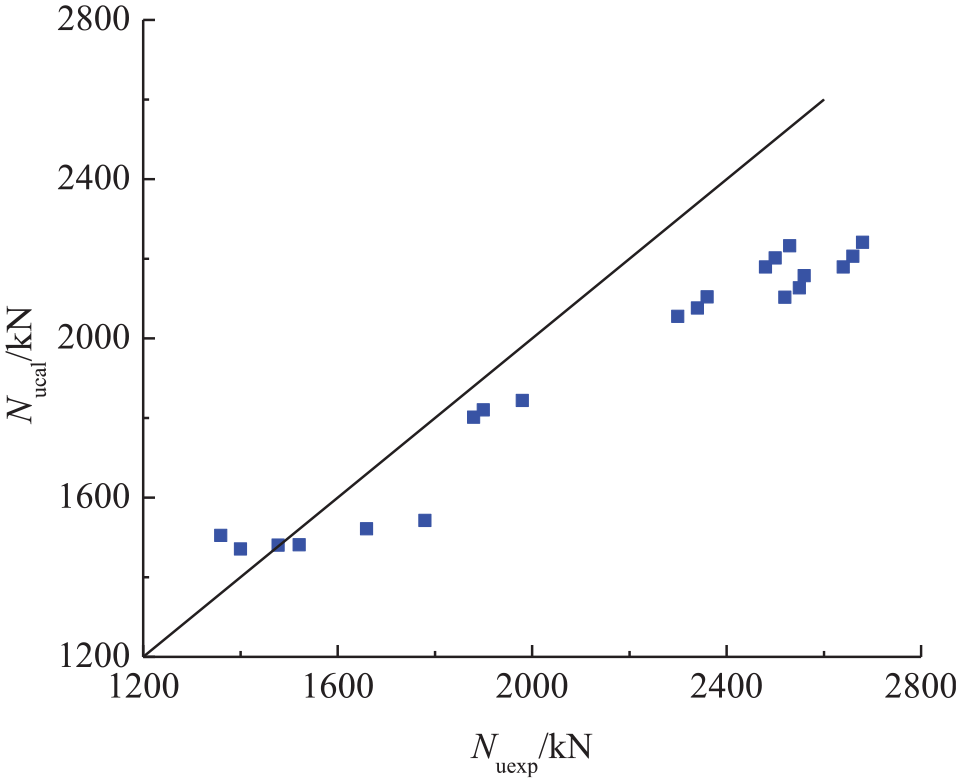
Comparison between theoretical calculation and experiment of axial compressive bearing capacity.

Comparison between theoretical calculation and finite element calculation of axial compressive bearing capacity.
Conclusion
In this article, on the basis of experimental research, first, the finite element parameters of axial compressive bearing capacity of WCT-CFST columns are calculated; second, the calculating formula of axial compressive bearing capacity is established through theoretical analysis, and the accuracy of theoretical calculating formula is verified. The following conclusions can be obtained:
Three typical failure modes were found in specimens: middle buckling, end local buckling, and integral bending.
The established FEM can effectively calculate axial compressive bearing capacity of the specimens. The average ratio of axial compressive bearing capacity of the finite element calculation to the experimental is 0.957, and the standard deviation is 0.045.
When the slenderness ratio λ exceeds the elastic instability limit λp, the axial stress of steel is lower than yield strength fy, and the axial stress of core concrete is lower than axial compressive strength fc.
Increasing the thickness of steel has a more obvious effect on increasing the axial compressive bearing capacity of specimen. With the increase of slenderness ratio λ, the axial compressive bearing capacity of specimens is decreasing, and the decreasing trend is from small to large and then to small.
The theoretical calculating formula is suitable for predicting axial compressive bearing capacity of WCT-CFST columns. The theoretical calculation of axial compressive bearing capacity is safer than experiment and finite element calculation. The average ratio of the theoretical calculation Nucal to the experimental Nuexp is 0.909, and the standard deviation is 0.075. The average ratio of the theoretical calculation Nucal to the finite element calculation Nufin is 0.951, and the standard deviation is 0.039.
Footnotes
Handling Editor: James Baldwin
Declaration of conflicting interests
The author(s) declared no potential conflicts of interest with respect to the research, authorship, and/or publication of this article.
Funding
The author(s) disclosed receipt of the following financial support for the research, authorship, and/or publication of this article: This study is funded by Anhui Natural Science Fund Project under Grant Nos. 1708085QE121 and 1808085ME147, Natural Science Research Project of Colleges and Universities in Anhui Province under Grant Nos. KJ2018A0118 and KJ2018A0108, National Natural Science Fund Pre Project of Anhui Polytechnic University under Grant No. 2018yyzr03, Anhui Polytechnic University Students Project under Grant No. 2017DZ32, National Innovation and Entrepreneurship Training Program Project for College Students under Grant No. 201910363085, and Anhui Province Innovation and Entrepreneurship Training Program Project for College Students under Grant No. 201710363271.