
Abstract
The concentration of wear debris in used lubricating oil is generally observed from spectral oil analysis. The element concentration data are one of the commonly used oil field data for degradation evaluation of power-shift steering transmission. However, in practical applications, the underlying degradation degree of the power-shift steering transmission is difficult to evaluate due to the complexity of element concentration data. To solve this problem, we propose a health index extraction methodology using a weighted average method to better characterize the underlying degradation, which leads to an accurate estimation of the residual life before the power-shift steering transmission needs to be maintained. The extracted health index not only maximizes the monotonic trend of underlying degradation but also minimizes the failure threshold variance between different power-shift steering transmissions. The method includes element concentration data modification, data selection, and data fusion steps that result in a reasonable power-shift steering transmission degradation model. Finally, a case study is provided to illustrate the proposed method. The results show that the extracted health index outperforms each selected element concentration data.
Introduction
Power-shift steering transmission (PSST) is one of the vital components that widely used in many heavy tracked vehicles. With PSST operating, metal wear debris spalling from each mechanical pair evenly mixed in lubricating oil and its concentration increase, which is a slow degradation process. Metal wear debris mixed in lubricating oil accelerates wear and tear of every mechanical components, consequently leading to the degradation of the PSST system.1,2 After a certain degree of degradation, the PSST system will fail to perform normal operations. For mechanical powertrains, faults caused by oil contamination are the primary failure modes, with more than 50% associated with metal wear debris. 1 Failure of the PSST will result in production downtime and delays, which often leads to economic losses and even safety problems that, in turn, may lead to catastrophic consequences. Thus, the PSST system should be regularly monitored, and the system soft failure occurrence time should be accurately estimated to perform predictive maintenance (PM). To address this issue, lubricant condition monitoring (LCM) technology has been used to observe oil field data for oil-lubricated machines.3,4 The purpose of this article is to address a health index (HI) extraction problem for PSST with the observed oil field data to determine the expected residual life (RL) before the PSST needs to be maintained.
In the literature of LCM,5–7 the amount of wear debris is one of the most common types of degradation data to assess the severity of system degradation. The amount of wear debris has been sampled from oil spectral analysis using MOA II (atomic emission spectroscopy) during the oil sampling period. 8 Using this method, 15 groups of element concentration data sample can be obtained. With the sampled element concentration data, prognostic analysis can then be performed to estimate the RL of an operating PSST.9,10 In the existing literature, many techniques and methods have been used to model the relationship between system degradation of oil-lubricated machines and its association with element concentration data.11–16 For example, Wang et al. described the analysis procedure of oil field data in the study of Wang and Burairah 17 and developed a machine degradation model using stochastic diffusion process in their study 18 by assuming the oil field data are a valuable condition indicator for characterizing the underlying degradation. In this article, the rationality of using element concentration data for degradation modeling was investigated. Recently, by modeling the increasing trend of wear particles in oil, Vališ and Žák 19 built a system degradation model for an internal combustion engine to determine the expected moment when a soft failure occurred. It is noted that the expected moment can be used as the system RL and further be set as the time to perform planned PM. In the most recent, Yan et al. 20 presented a condition-based maintenance (CBM) problem with selected oil field data to determine the optimal time of machine maintenance. In addition, the work of Yan et al. 20 presents a framework of using sampled oil field data for maintenance optimization. A review of the application of oil field data for LCM and CBM can be found in Wakiru et al. 21 and the references therein. Most of the existing literature simply use single-element data (e.g. Fe, Cu, and Mo9–12) in wear debris concentrations to establish degradation models. In practice, however, many studies have shown that using a single-element concentration, data-based degradation model is problematic,22,23 which may cause inaccuracy in system RL estimation.
To our knowledge, no HI extraction method has developed in the literature that can be utilized for the fusion of oil field data. Therefore, this article seeks to fulfill this gap by fusing multiple element concentration data to extract an HI to characterize system degradation process that can be used for RL estimation. To address this issue, a unified degradation model method has been proposed in our previous research 24 in which a copula function is utilized to deal with multiple oil field data. However, it is often challenging to determine an appropriate copula function, especially when dealing with more oil field datasets. Unlike the existing works, this article proposes an HI extraction methodology by developing a quadratic programming problem that can simultaneously maximize the HI monotonicity and minimize the failure threshold variance of different units. With the proposed efforts, we expected to attain more accurate RL estimation.
The remaining parts are organized as follows. The “Overview of the element concentration data” section describes the PSST system and the oil field data used in this article. The “Development of an HI extracting method” section describes the key steps associated with the preprocessing of selected oil field data, including element concentration modification for lubricating oil supplement and element concentration data selection, and develops explicit formulas for extracting an HI based on quadratic programming for degradation modeling and RL estimation. The “Case study” section provides an illustrative case study. Finally, the “Discussion and conclusion” section provides the conclusion and future research.
Overview of the element concentration data
System model description
This article considers a PSST system monitored using regular oil spectral analysis to implement LCM and predict its soft failure occurrence. The concerned PSST system combines a multi-speed shifting system with an infinite steering system, and is widely used in heavy industrial applications such as heavy-duty tracked vehicles. Figure 1 shows a sketch diagram of a PSST, and Figure 2 represents the configuration of the test-bed.7,8 The PSST was inspected every 5 motor-hour (Mh) during the operational life. The sample collection criteria are listed in Table 1, and detailed sampling principles can be found in Yan et al.7,8
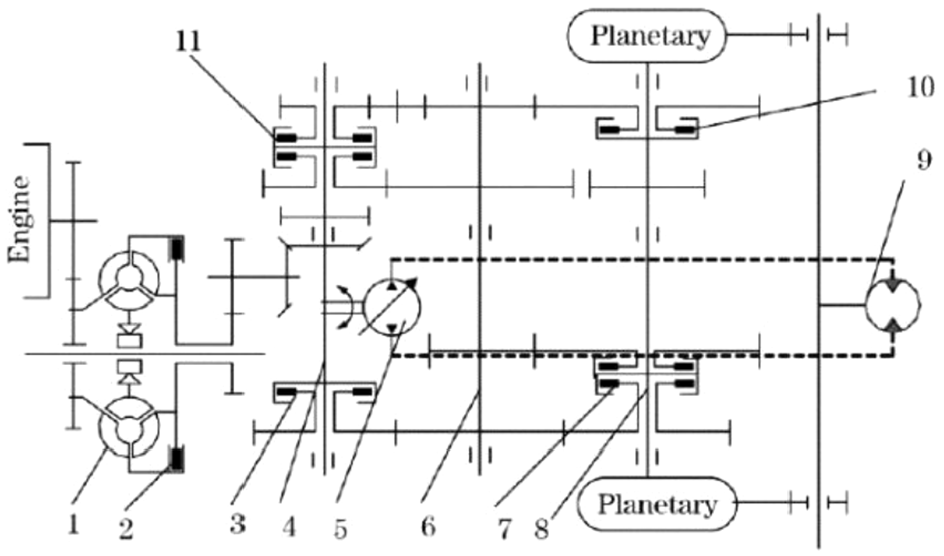
Sketch of the PSST.

Life cycle test-bed of PSST.
Criterion of sample acquiring.

Dataset description
The element concentration dataset used herein includes 20 training units and 5 test units. Each unit was run to failure due to severe wear under the same operating conditions. Time was measured in inspection periods, in this case, 5 Mh. All of the collected samples were analyzed immediately. The concentration data in parts per thousand of 15 types of element were obtained using MOA II, which are related to the degradation process of the operating PSST.7,8 The element concentration data of one unit are shown in Table 2.
Element concentration data of one PSST (unit: µg/g).
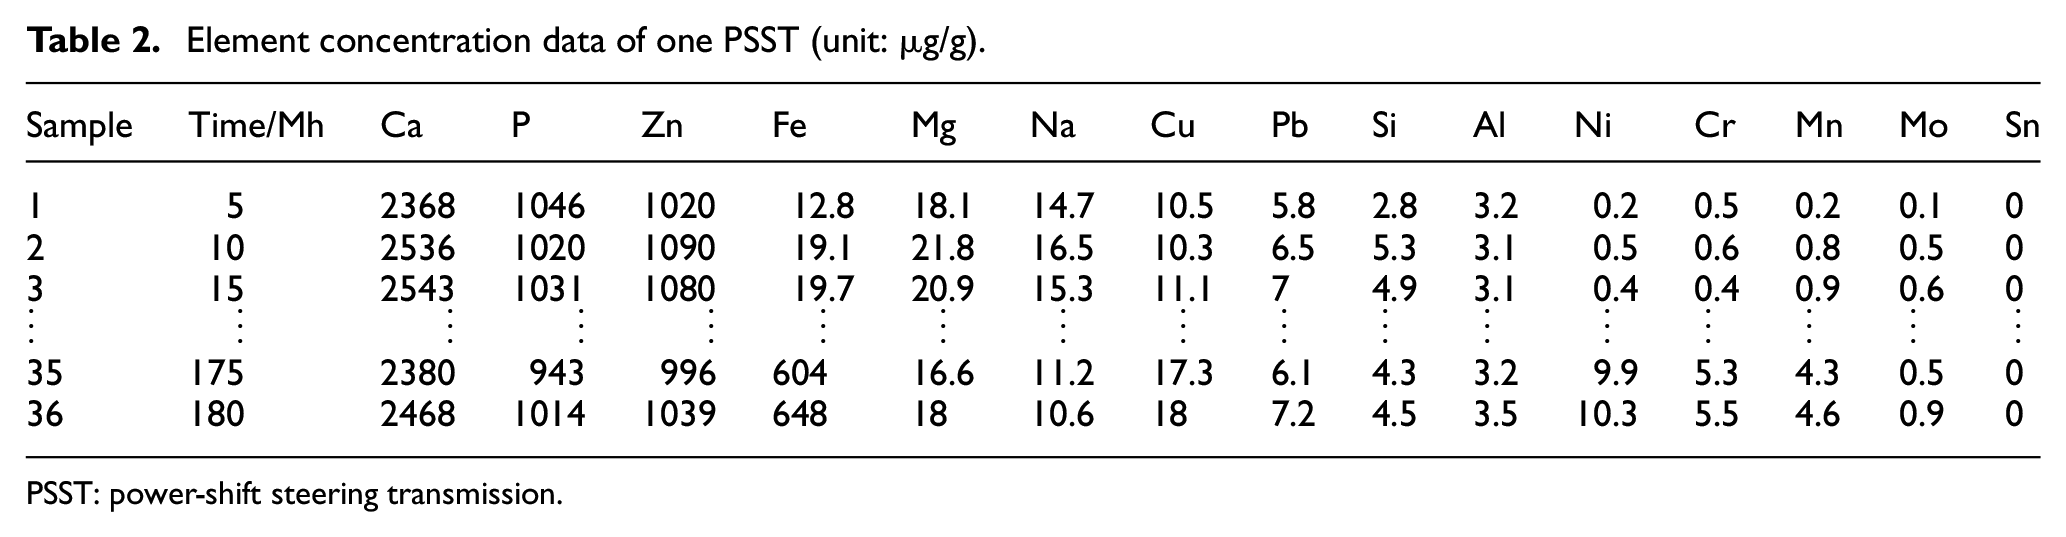
PSST: power-shift steering transmission.
As mentioned above, modeling the degradation mechanism and representing the degradation state of the operating PSST are difficult due to the information redundancy of multiple element concentration data. 20 Thus, to characterize the degradation level of the operating PSST, in the next section, a composite HI will be extracted based on the fusion of the element concentration data.
Development of an HI extracting method
In this section, several key steps associated with the preprocessing of the element concentration data and constructing of a composite HI are discussed.
Dataset preprocessing
Modification of element concentration
Since a certain volume of used lubricating oil is sampled for LCM, an equal amount of unpolluted oil is then injected. The concentrations of wear particle in the subsequent inspection periods are not ideal; specifically, it is less than the actual concentration. Thus, the first step to enable an accurate degradation condition characterization is to modify the original element concentration data during preprocessing. Thus, a function was proposed to modify the element concentration data

where
Selection of element concentration data
Recalled that 15 types of major element concentration data are obtained from oil spectral analysis using MOA II. Therefore, it is necessary to determine the element concentration data used as the input of our HI extraction method. In engineering practice, time-series data that exhibit a significant increasing or decreasing in trend during operation are of interest. Based on this criterion, if the last sample is larger or smaller than the initial sample, the element concentration data are selected. 25
Methodology development
Researchers usually use weighted average functions to fuse multiple time-series data and extract indicators that can characterize the implicit information.22,26 Therefore, to fuse the selected element concentration data, we use the weighted average function to formulate the HI extracting method, represented as

where
Desirable properties for extracting the HI
To guarantee the obtained HI is more suitable for LCM and RL estimation than the element concentration data, a few desirable properties for the HI are defined to enhance its effectiveness for reasonable degradation modeling and successful RL estimation.
The element concentration data are always nonmonotonic due to measurement errors; thus, an HI that has a monotonic trend should be extracted. Furthermore, for given element concentration data, the failure thresholds between different units are always different, so the obtained HI should have little variation in the failure threshold. Considering these two requirements, the two basic properties, which were proposed by Saxena et al. 27 to make the condition monitoring data have a better application in degradation modeling and RL prediction, are adopted for the extracted HI to have a better LCM application.
Property 1: The degradation trend of the extracted HI should be monotonic with the PSST system degradation.
Property 2: The variance in the failure threshold of different PSST systems should be minimal under the same unit and operating condition.
Methodology optimization
Since each PSST system is assumed to fail due to wear debris accumulation under the same operating condition, we expect to extract an HI that has a similar degradation pattern for all systems. Thus, the expectation can be achieved by jointly programming these two properties when extracting the HI. Therefore, the objective function should consist of two parts: the weighted amount of the nonmonotonicity of Property “1” and the variance of the failure threshold of Property “2.”
For Property “1,” a slack variable is used to compensate for monotonic conflictions. In the case where the value of HI is less than the previous inspection period, the difference between HI and the reasonable value is measured using a slack variable. Specifically,

where
For Property “2,” the variance of the failure threshold of the HI is measured using an unbiased inspection variance, which can be formulated as
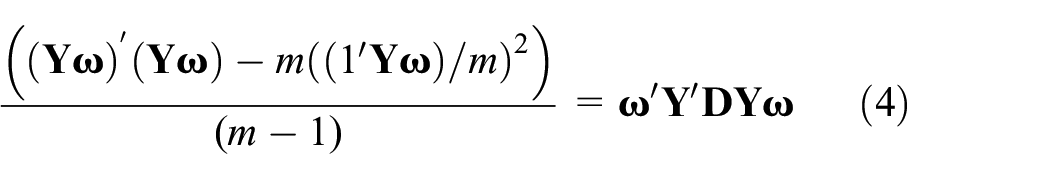
where
Above all, by maximizing the monotonic trend and minimizing the threshold variance between different units, the method optimization model is formulated as a quadratic programming problem, represented as

where r is a tuning parameter used to measure the relative importance of these two properties in the optimization model, and

where

Parameter setting
In this section, how the crucial parameters in our optimization model are set is discussed such that the obtained HI is reasonable for the operating conditions and degradation mechanism. Specifically, we focus on setting weight coefficients
Weight coefficient setting: Recalling the each slack variable

The value of weight coefficient

Since more weight is assigned to
2. Tuning parameter setting: The relative importance of the two terms in the optimization model in equation (5), that is, confliction in monotonicity and variance in the failure threshold, is controlled by the tuning parameter r. We can use cross-validation to obtain the optimal value of r. Details of the calculation process can be found in Kohavi. 28
Increasing r puts more emphasis on reducing the confliction of the monotonicity property of the extracted HI at the expense of increasing the variance of the failure threshold. This multi-objective optimization problem is often solved by plotting the efficient frontier with regard to these two items of the optimization function in equation (5). In practice, we set the optimal value of tuning parameter r based on the importance assigned to the two items of the optimization function.
Flowchart of the proposed method
Figure 3 shows the flowchart of the proposed HI extraction method. Using this method, the optimal values of

Flowchart of the HI extracting method.
Case study
In this section, we provide a numerical study using element concentration data collected for inspections from each PSST system in the “Overview of the element concentration data” section to illustrate the HI extraction procedure. To challenge the developed method, we further investigated the performance of our proposed method and compared it with the existing single-element concentration data-based degradation modeling method. Specifically, we compare the accuracy of the RL prediction by using the constructed HI and using each selected element concentration data based on the same Wiener process (WP)–based degradation model.
Dataset preprocessing and HI extraction
Concentration modification and data selection
After the wear particle concentration is modified using equation (1), the element concentration data used for extracting HI are then selected. The selection is based on the modified element concentration data showing a consistent decreasing or increasing trend for all units. Among the 15 types of element concentration data shown in Table 2, six (i.e.
Weight coefficient and tuning parameter setting
1. Weight coefficient setting: Since we assume that the weight coefficient increases linearly in the “Development of an HI extracting method” section, we adopt an arithmetic series for
2: Tuning parameter setting: In this case study, the tuning parameter was set as
Optimal value of

WP-based degradation modeling
Degradation model development
The PSST system initially operates in a healthy state with unpolluted oil and is subject to wear particles obtained from regular inspections. The selected six element concentration data are shown in Figure 4.

Curves for element concentrations in a training unit.
With the plots of element concentration data in Figure 4, the element concentration data show random diffusion forms. Therefore, the WP-based degradation model proposed in Si et al. 29 is utilized for evaluating the performance of the extracted HI when used for RL prediction. The degradation model is given by

where the degradation process
It is assumed that a PSST system is identified as failed and that needs to be replaced when

Based on the Markov property of the WP, the degradation track of PSST system after time

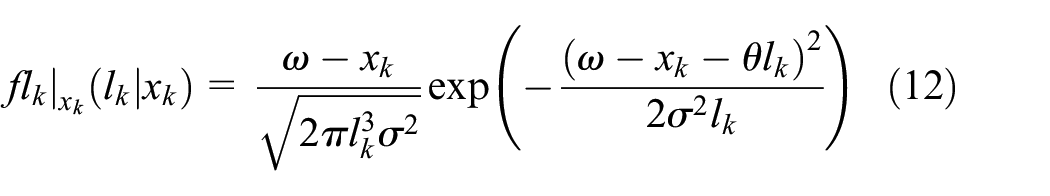
According to the above description of the degradation model, if time t is the FHT of the degradation process

Under the above construction, the FHT of the WP conforms to an inverse Gauss distribution. Thus, the RL of PSST system at time


Parameter estimation
To initialize the model defined in equation (8), we estimate the model parameter
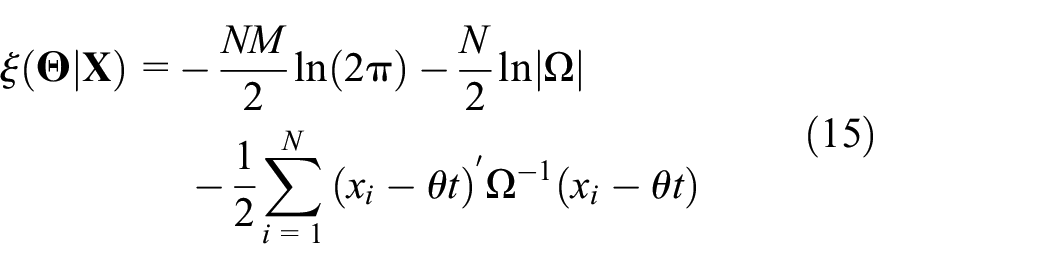
where
Table 4 shows the estimated value of
Estimated value of

The dataset of the last inspection period before failure in all training units for element concentration data k is denoted as
Calculated value of

Prediction results
Using the estimated parameters, the degradation model can be initialized to predict the RL of the testing units. Figure 5 shows the degradation state of a random testing unit. The FHT of the extracted HI is 180 Mh, which represents the failure period of PSST system degradation that provides a reference for the maintenance policy formulation. In addition, Figure 6 shows the predicted conditional distribution of the degradation state at several inspection periods, which characterizes the uncertainty degradation of the PSST system.

Degradation state for unit #21.
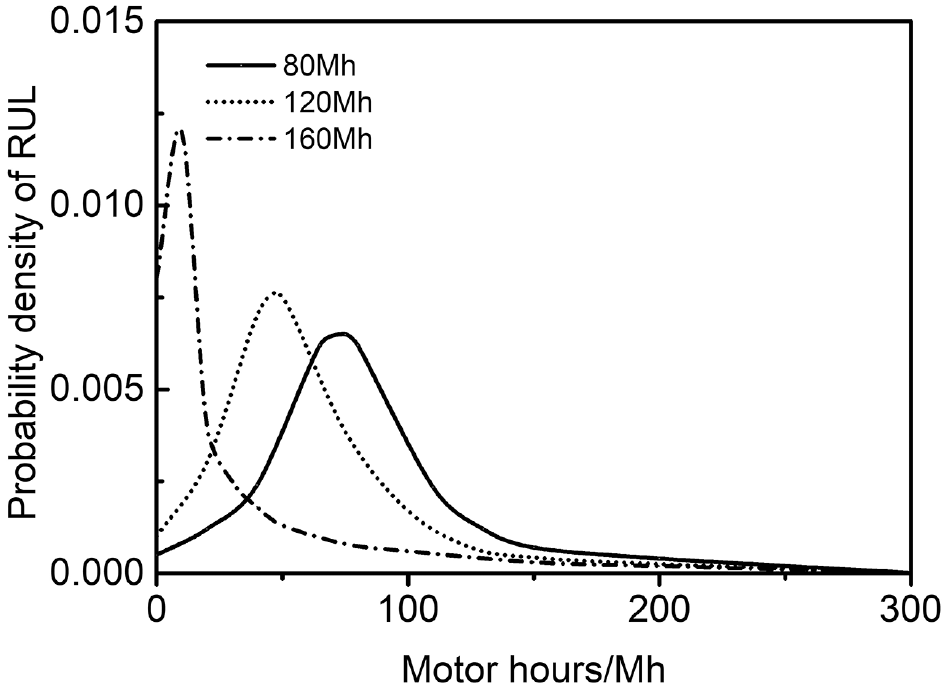
Predicted probability density function (PDF) for unit #21.
The relative error between the RL prediction and actual RL is calculated and the comparison considers two cases: (1) the RL prediction based on the extracted HI and (2) the RL prediction based on each selected element concentration data. Specifically, the relative error,

where
Figure 7 shows the absolute value of the relative error using each selected element concentration data and the extracted HI at different quantiles of the machine operating time.
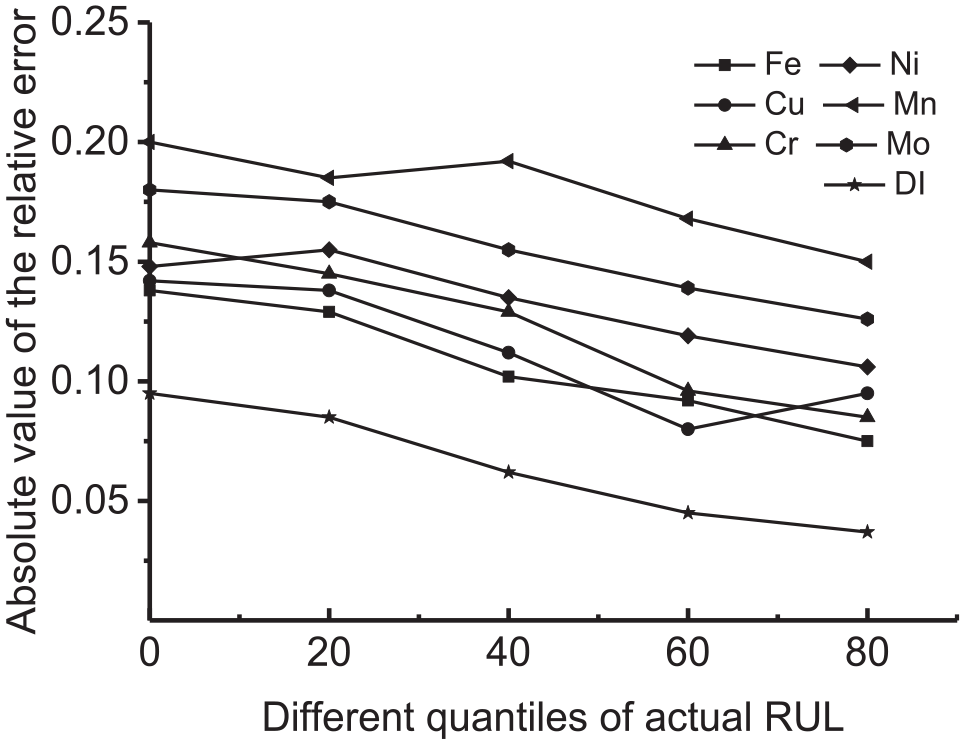
Relative error between predicted and actual RL.
Figure 7 shows that (1) compared with each selected element concentration data, the extracted HI provides the best prognostic result due to the control of the two desirable properties. In other words, the monotonic property is maximized and the variance in the failure threshold is minimized when extracting the HI. (2) The RL prediction using the extracted HI becomes increasingly accurate with the unit operating due to the control of the weight coefficient
In addition to the relative errors shown in Figure 7, researchers are often interested in comparing the root mean square error (RMSE) 31 of the RL predictions and actual RLs. A small RMSE indicates a better RL prediction with less absolute error. The RMSE value for all selected element concentration data and the HI is shown in Table 6. Based on Table 6, the HI extracted using our proposed method has the smallest RMSE compared with using each selected element concentration data. The extracted HI results in a more accurate RL prediction results, which provides a useful foundation for an optimal PM strategy for oil-lubricated systems.
Comparison of RMSE.
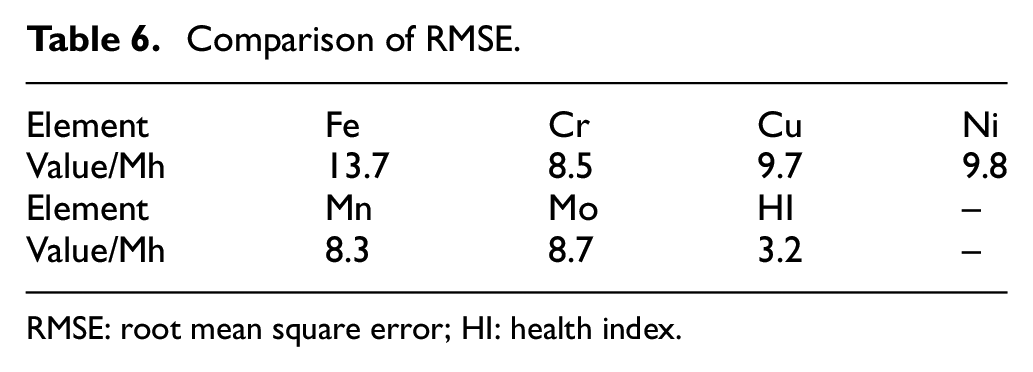
RMSE: root mean square error; HI: health index.
Discussion and conclusion
This article provides a systematic methodology that includes concentration modification, data selection, data generalization, and data fusion procedures combining element concentration data (e.g. Fe, Cu) obtained for inspections from a PSST system to extract an HI that accurately characterizes the system degradation condition. The novelty of this method is integrating multi-dimensional element concentration data in a unified HI. The constructed method is advanced in that it can maximize the monotonicity of the indicator and minimize the variance in the failure threshold simultaneously. The developed method was tested and validated using element concentration data from several PSST systems. The WP-based degradation model was utilized to evaluate the validity of the extracted HI by estimating the RL of each oil-lubricated system in time. The results show the improved performance of the extracted HI compared with each selected original element concentration data.
There are several important directions deserving further studies. First, more oil field data (e.g. ferrography, viscosity, and acidity) tailored to LCM are necessary. Second, kernel methods that can fuse nonlinear time-series data should be investigated. Third, an effective maintenance strategy optimization method based on the extracted HI should be developed.
Footnotes
Handling Editor: James Baldwin
Declaration of conflicting interests
The author(s) declared no potential conflicts of interest with respect to the research, authorship, and/or publication of this article.
Funding
The author(s) disclosed receipt of the following financial support for the research, authorship, and/or publication of this article: This work is partially supported by the National Natural Science Foundation of China (NSFC) under grant numbers 51475044 and 51975047, and partially supported by the China Scholarship Council under grant number 201806030083.