
Abstract
Non-axisymmetric endwall contouring techniques have been widely applied in gas turbines; numerous papers and experimental studies have shown that it can significantly improve the overall performance of the turbine. This article first presents the non-axisymmetric endwall profile construction and optimization both for the rotor hub and shroud of a turbine drilling hydraulic cascade in the presence of an axisymmetric rotor, in order to improve the performance and investigate non-axisymmetric endwall contouring’s influence laws on a hydraulic cascade. Rotor cascade endwall design is studied by confining the axisymmetric variation near hub, shroud, and both endwalls. Endwall surface is parameterized with control points of Bezier curve, and control points are considered as design variables having a height constraint of 10%, 12%, or 15% span to move in radial coordinate. This methodology also combines Latin hypercube sampling with NSGA-II algorithm to obtain optimum solution. Computational fluid dynamics simulation results show that the non-axisymmetric endwall contouring technology applied to hub and shroud all realize an improvement in efficiency, while the NEW_S_15% has the best comprehensive performance and it causes an improvement of 1.52% in efficiency and 5.1% in torque. Off-design experiment shows that NEW_S_15% improves the output torque and efficiency as well even it deviates from design working condition, which proves valuableness of the non-axisymmetric endwall contouring technology.
Introduction
Endwall loss, also known as secondary flow loss, is one of the main energy losses of the turbine cascade. It contributes significant amount 33% to overall losses of the impeller mechanical turbine cascade. 1 Scholars have done extensive research on the loss mechanism of secondary flow, and proposed the Langston model, 2 the Sharma–Butler model, 3 the Goldstein–Spores model, 4 and the Wang Hai-Pin model. 5 In addition, Liu and Lei 6 also studied the loss mechanism of the secondary flow (tip-leakage vortex (TLV)) between the clearance of blade and endwall in a pump turbine and they indicated that tip clearance has great influence on TLV and pump as turbine (PAT) cavitation performance. Same conclusions were summarized by Hao and Tan. 7 Although a unified and standard theory summarized to accurately describe the origin and development of the secondary flow is not available because the three-dimensional (3D) flow inside the impeller machinery is extremely complicated, there is still a general consensus that the secondary flow formed is caused by a horseshoe vortex situated at the upstream of the leading edge of the blade. As shown in Figure 1, the inlet endwall boundary layer is formed and entrained in the horseshoe vortex, which splits at the leading edge of the blade near the endwall, with one leg of the vortex (pressure side (PS)) in one airfoil passage and the other leg (suction side (SS)) in adjacent passage. The PS branch of the horseshoe vortex merges with the adjacent cascade SS under the cross-channel reverse pressure gradient of the cascade and rolls up far away from the endwall along the spanwise direction, forming a passage vortex and causing flow losses. 8

Endwall secondary flow. 9
Over the past several decades, the role of non-axisymmetric endwall contouring in reducing secondary flow losses has been widely demonstrated and proved, various profiling ways are presented as well. In order to reduce the reverse pressure gradient in cascade passage, mitigate the secondary flow turbulent energy loss, also improve the cascade efficiency, Rose 10 completely explained the basic principle of the non-axisymmetric endwall contouring of the turbine cascade for the first time, while proposing the circumferential and axial profiling ways of the endwall. He applied this method in a high-pressure turbine guide, and then successfully reduced the reverse pressure gradient in the Durham rotor cascade in cooperation with Hartland et al. 11 Harvey et al. 12 proposed the Fourier series endwall contouring method for reducing the reverse pressure gradient of the cascade. Subsequently, non-axisymmetric endwall shape based on this method was completed using a 3D linear design system. Finally, this method’s efficacy was fully proved by the experimental study of Hartland et al. 13 In 2001, Harvey and Rose applied non-axisymmetric endwall contouring technology to the stator and rotor endwall of Ruida-500 engine. The experiment result indicated a range of improvement from 0.34% to 0.84% in efficiency.14,15 Nagel Marc and Baier 16 first proposed an endwall modeling method, which realized the control of radial and axial height distribution of endwall surface by constructing a shape function and a decay function. Immediately, the non-axisymmetric endwall modeling method was applied in a 1.5-stage turbine, finally showed a 1% increment in efficiency of the whole machine.17,18 In 2002, Hartland and Gregory-Smith 19 implemented a new approach named “The Camber Line Non-axisymmetric Contouring Method,” whose philosophy was that blade curvature caused a cross passage reverse pressure gradient, thereby mirroring the blade curvature on the endwall would assist in canceling this effect. The experiment results showed that this method achieved substantial performance improvements in Durham Linear Turbine Cascade. Chinese research scholars G Li 20 and J Zheng et al., 21 respectively, conducted a SINE and polynomial function endwall profiling method and a parameterized ridge line function profiling method, while W Sun et al. 22 and XJ Tian et al. 23 proposed two-control-curves function endwall profiling method. All of them validated their approaches by detailed numerical simulation and experimental research.
The core idea of traditional method is to control endwall shape by function curves. This method has a limited influence on the geometric diversity of endwall profiles, and the modeling results do not represent an optimal contour. 9 Praisner proposed the matrix distribution method of the endwall control points to realize the non-axisymmetric contouring. It was a free parametric modeling method which gave floating upper and lower limits of the control points in radial direction, and then an optimization algorithm was used to choose a better shape. HM Tang et al., 24 GJ Zhao, 25 and XY Si et al., 26 respectively, adopted the matrix distribution method of control points to achieve endwall contouring. All of them achieved effective performance improvements.
Efficiency and output torque are two important performance evaluation indicators of turbine drilling hydraulic cascade. In order to improve turbine performance, many scholars have done a lot of research on the design and optimization of the turbine airfoil, and achieved good results. However, research studies on the non-axisymmetric endwall contouring of turbine drilling hydraulic cascades have not been published. A large number of studies have shown that non-axisymmetric endwall shape has an important influence on ameliorating internal flow and improving single-stage efficiency. At the same time, there are similar cascade structure and working principles between gas turbine and turbine drilling hydraulic cascade. Therefore, exploring the application of non-axisymmetric endwall contouring technology in hydraulic turbine cascades and investigating influence of non-axisymmetric endwall on hydraulic turbine performance are of great significance.
This article is aimed at improving efficiency and torque of turbine drilling hydraulic cascade using non-axisymmetric endwall contouring technology. Based on the non-axisymmetric endwall contouring approach mentioned above, the control point matrix distribution method of endwall modeling is selected to construct non-axisymmetric endwall of the turbine drilling hydraulic cascade. In the first step, approximation model of the Ф175-type turbine drilling hydraulic cascade is parameterized. In the second step, statistical tool Latin hypercube sampling is combined with 3D computational fluid dynamics (CFD) flow field calculation solver to systematically alter a free-form parameterization of the endwall. Based on the validated trend accuracy of the solver for predicting the effects of endwall contouring, the magnitude of predicted single-stage turbine output torque, efficiency, and total pressure loss from the objective function (OF) for the endwall design methodology is obtained. Finally, NSGA-II multi-objective genetic optimization algorithm is used to obtain the optimum solution and analyze the effect of the axisymmetric endwall. The reliability of the application of non-axisymmetric endwall in turbine drilling hydraulic cascade is verified by detailed numerical analysis and experimental results.
Reconstruction of turbine drilling hydraulic cascade
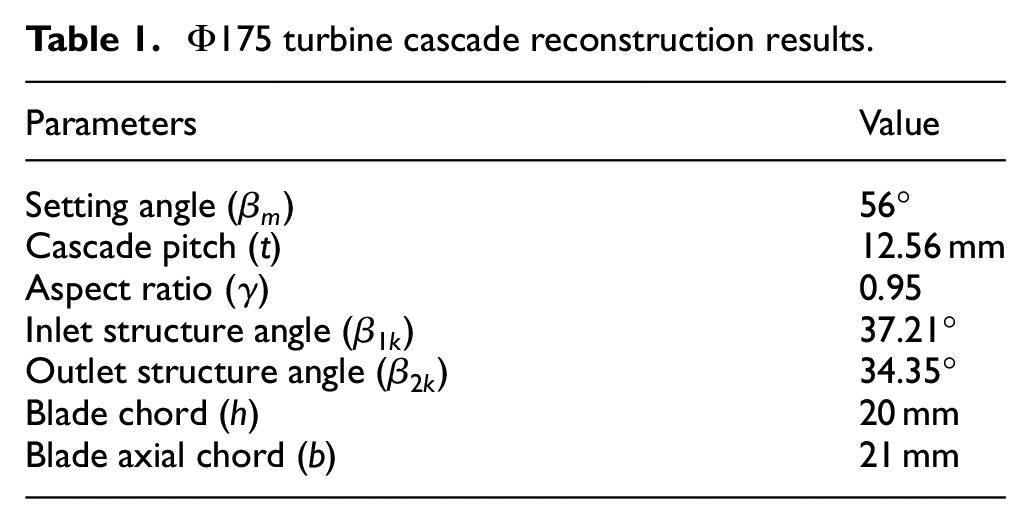
Approximation model of Ф175 turbine drill hydraulic cascade is obtained by professional equipment. The MC003-Daisy686 automatic bridge coordinate measuring machine and AC-DMIS™ data processing software are used to obtain multi-section point cloud distribution of the blade, then UG™ software is utilized to complete the 3D reconstruction of blade through non-uniform rational basis spline (NURBS) surface modeling. Finally, parametric approximation cascade model is obtained. The processing results are shown in Table 1 and Figure 2.
Ф175 turbine cascade reconstruction results.

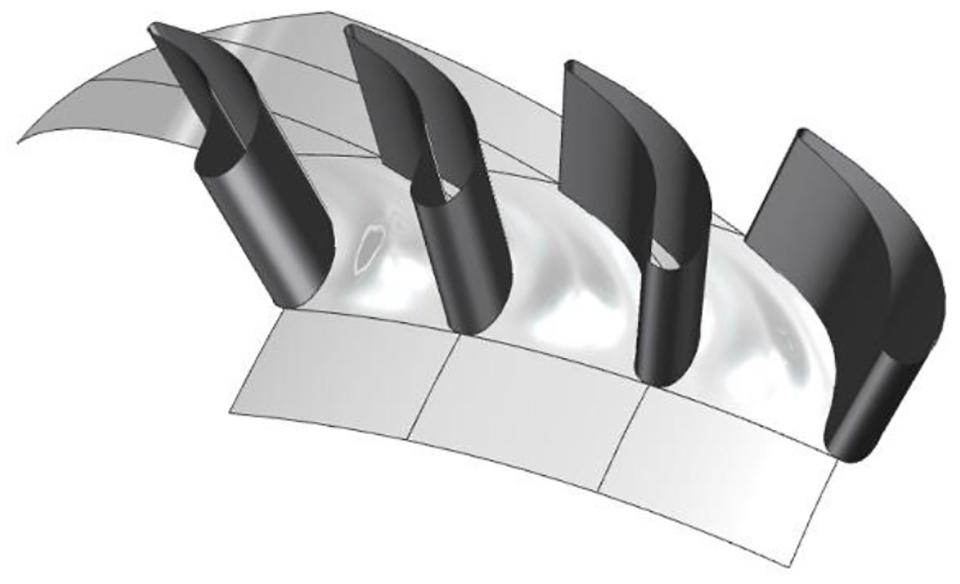
Original turbine cascade and reconstruction model.
Non-axisymmetric endwall parametric contouring method
Non-axisymmetric endwall contouring strategy
In this section, a parametric profiling method for the rotor cascade is established, which was introduced in detail by Praisner et al. 9 As shown in Figure 3, five equally spaced streamlines are taken from a single-channel endwall along the pitchwise direction. To simplify the modeling process, the streamlines which are named cut line are identical with the blade mean camber line. There are eight control points distributed uniformly along the each cut line. Six control points of them (green points) are only of single degree freedom while the remaining two points (red points) situated at the both ends of cut line are frozen, because the control points on both sides must meet the geometric first-order G1 continuity, this means that the endpoints of the two curves coincide, and the angles of the tangents of the two curves at this point are zero degrees, and the normals of the two curves are the same at this point, thereby it ensures a smooth transition between two endwall surfaces at the joint. Six points mentioned above are optimization variables, and they are restricted to move only in the radial direction with a perturbation height limit of 10%span, 12%span, or 15%span. Finally, we can observe that each single-period passage endwall shape is modeled by four cut lines.

Parametric definition of the endwall.
The Bezier curve is widely used in engineering design and has good characteristics. 25 The Bezier curve function is used to limit the radial deflection of the endwall control points. It could be expressed by the following

where

A seventh-order Bezier curve can be constructed by setting eight control points. As shown in Figure 4, referring to the height fluctuation range of the gas turbine endwall control points in contouring process, 24 perturbing height of each point ranges from 10%span to 15%span. Endwall contouring case is shown in Figure 5.
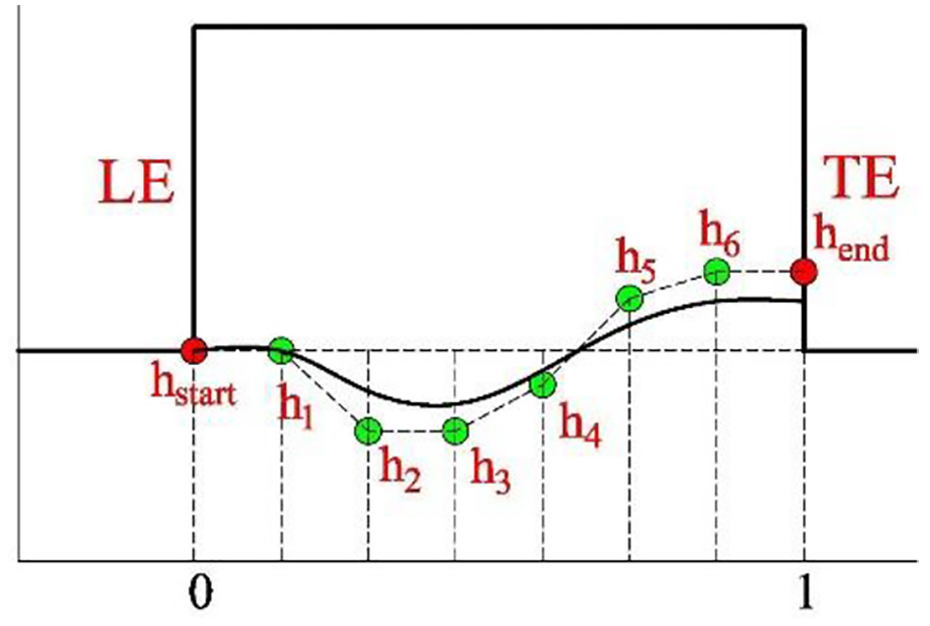
Perturbation law of control points.
Hub endwall contouring case.
Multi-objective optimization design
Multi-objective genetic optimization algorithm based on back propagation (BP) artificial neural network (ANN) (NSGA-II) is one of the most popular multi-objective optimization methods. It reduces the complexity of non-inferior sorting genetic algorithm (GA), and has advantages of fast running speed and good exploration ability. It can effectively avoid the trap of optimizing into local optimization and become the benchmark compared with other multi-objective optimization algorithms; thereby, this algorithm is recommended to optimize the endwall shape in present work. After the Ф175-type turbine drilling hydraulic cascade is reconstructed, an approximation parametric model is established. There is 6 × 4 matrix of single-degree-of-freedom points controlling the endwall shape. Each control point variable can fluctuate along the radial direction. Due to large number of optimization variables, the samples generated by design of experiment (DOE) are huge, so this article adopts the Latin hypercube sampling statistics tool to produce endwall sample models, while providing 70 basic optimization samples for the BP ANN to predict the approximation function relationship model between control point variables and OFs. Then, the GA seeks an optimal solution of the OFs and reverses to generate the optimal non-axisymmetric endwall shape.
In the optimization process of this article, if the turbine cascade with non-axisymmetric endwall generated by optimization algorithm is not belong to basic sample database and the corresponding parametric model does not satisfy the optimization targets, then this model will be added to the search samples; at the same time, the ANN prediction accuracy of the relationships between design variables and OFs will be further improved. The optimization process is shown in Figure 6.

Optimization procedure.
As hydraulic turbine manufacturers strive to develop machines that are more efficient and more power, one area of focus has been the improvement of macro-performance. The optimization goals of this article are to achieve a higher single-stage turbine efficiency, a larger output torque, and a lower total pressure loss as possible as it can. However, in consideration of the complexity of relationship between those output characteristics of turbine drilling hydraulic cascade, we observe that it is impossible to obtain a best result for each performance parameter. Concerning the performance requirements of turbine drilling tool in a real working condition, improving the efficiency and torque is a priority target. The hydraulic turbine cascade performance parameters are defined as follows


where
Establishing an OF which is the summation of three penalty terms, the OF transforms the non-linear constrained problem into an unconstrained one, and could be defined as follows


where
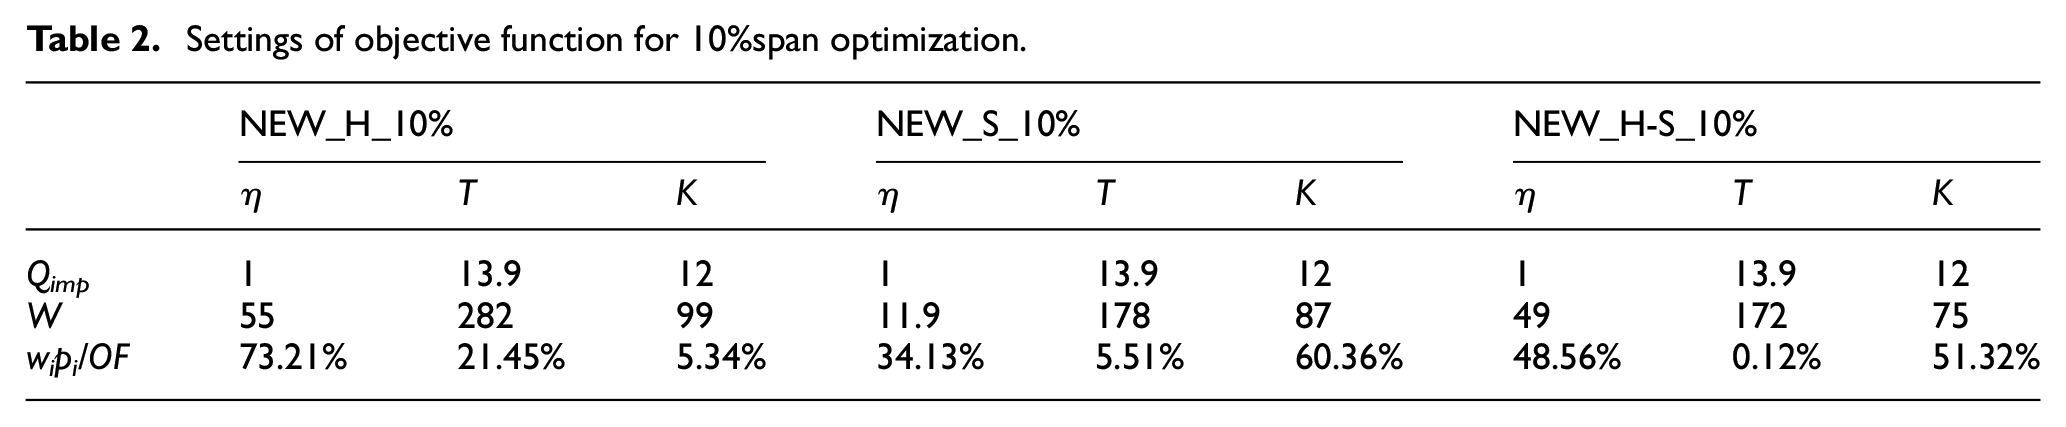
The optimized non-axisymmetric endwall shapes obtained in three conditions of hub contouring, shroud contouring, and both endwall contouring are discussed in detail, respectively. Under each condition, investigations on the modeling of three perturbation heights (10%span, 12%span, and 15%span) are included. The original axisymmetric endwall obtained by MC003-Daisy686 automatic bridge coordinate measuring machine is defined as AEW_D (Axisymmetric Endwall Datum Sample); the same definitions are applied to hub contouring, shroud contouring, and both endwall contouring, such as NEW_H_“Number,” NEW_S_“Number,” NEW_H-S_“Number,” where “Number” corresponds a ratio of fluctuation height to the blade chord (h). Three kinds of endwall modeling optimization settings based on different weights and optimization results are shown in the following Tables (Tables 2–4).
Settings of objective function for 10%span optimization.
Settings of objective function for 12%span optimization.

Settings of objective function for 15%span optimization.

Grid topology and boundary condition
As shown in Figure 7(a), the numerical calculation domain is divided into a stator domain and a rotor domain, the interface of the stator and rotor is set as a rotational boundary, and the circumferential interface is a periodic boundary. As shown in Figure 7(b), the mesh topology consists of five blocks, and the O-topology technology is applied on skin block around the blade. The inlet, outlet, upper, and lower blocks use a H-topology. The flow domain is divided as 73 sections, the grid points of each section are set as Figure 7(c). The multi-structured meshing technique is used to divide the datum model whose grid number is 800,082. As shown in Figure 8, the grid-independent verification results show that when grid number is greater than 750,000, the calculation error is within 5% in efficiency and output torque, and the calculation results tend to be steady. As shown in Table 5, the variation of mesh density has minimal effect on the turbine head (H), outlet velocity (vout), and S1 stream surface flow angle (β) in Meshes 1–5, especially when the rotor mesh number exceeds 743,310.
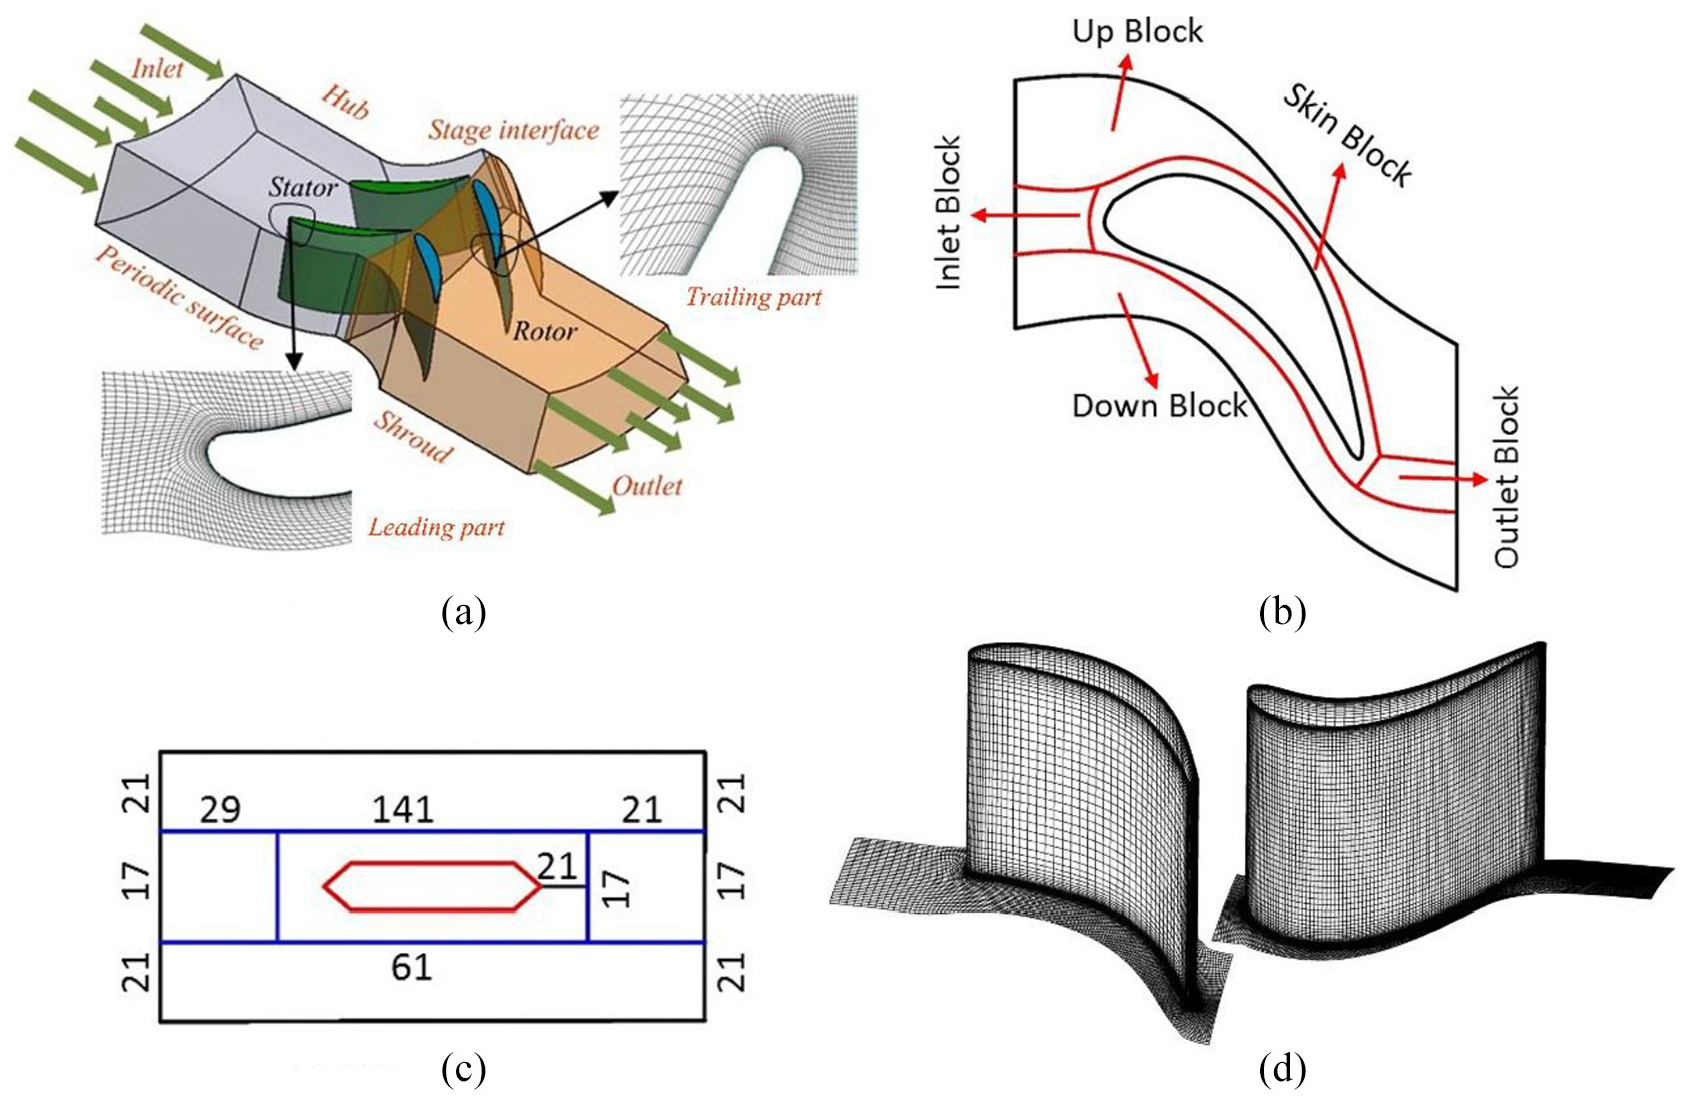
Boundary conditions and meshing: (a) boundary conditions, (b) mesh topology, (c) grid points, and (d) meshing result.

Grid independence: (a) efficiency and (b) torque.
Cases with different mesh elements.

The relative changes from Mesh 1 to Mesh 5 are estimated to be within 5%. Therefore, the grid number 800,082 satisfies the numerical simulation requirements. The non-dimensional value y+ of the first layer grid on the wall is less than 1. CFD software is used to solve the 3D N–S equation, and the Spalart–Allmaras equation model is selected as the turbulence model, which has a good convergence. Three-dimensional steady-state simulations are performed according to the following condition. The working condition of the last stage of the hydraulic turbine cascade is simulated, and the boundary conditions are shown in Table 6.
Boundary condition.

Results and discussion
In this section, the optimized results of non-axisymmetric endwall contouring are compared with the original axisymmetric endwall AEW_D. Their flow field characters are analyzed in detail. The performance parameters are also measured at off-design conditions in order to analyze the non-axisymmetric endwall’s impacts on turbine in the whole working conditions.
Optimum endwall profiles
Figure 9 shows the optimization results of different non-axisymmetric endwall shapes, and Figure 10 shows the height deviation distribution with respect to axisymmetric endwalls. In the contours, a positive height value represents the convexity of the endwall, this convex endwall is supposed to accelerate the flow. A negative height value represents the depression of the endwall, this concave endwall is supposed to decelerate the flow. The positive and negative variations help for minimum variation in the flow area. In this article, the concavity and convexity of hub surface and shroud surface are relative to the flow channel and have different geometrical meanings. The radial height at the convex position on the hub surface is greater than the radius value, and the radial height at the convex position on the shroud surface is smaller than the radius value. The same law can be used to explain the change in radius at the concave position of the hub surface and the shroud surface.

Non-axisymmetric endwall optimum profiles: (a) 10% high perturbation, (b) 12% high perturbation, and (c) 15% high perturbation.
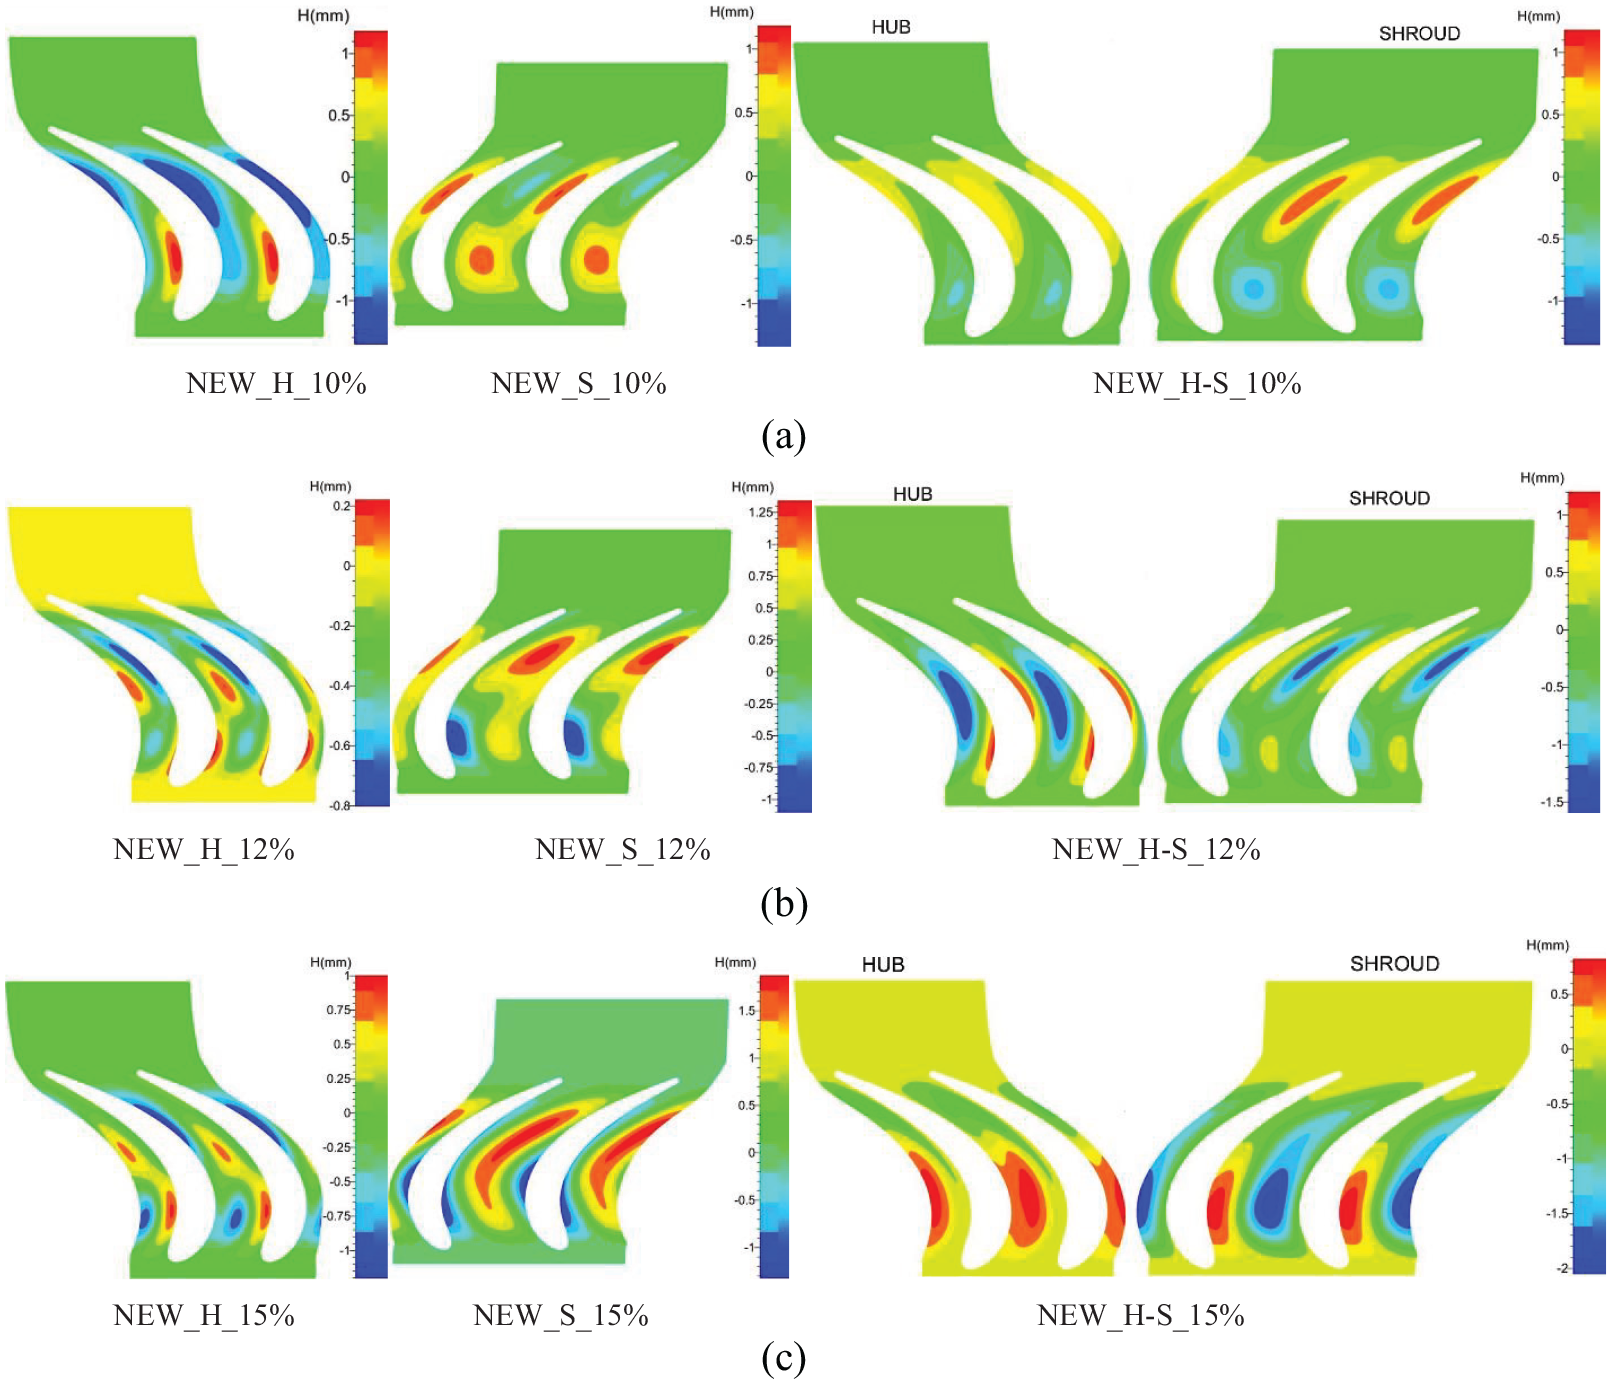
Height distribution contours of optimum profiles: (a) 10% high perturbation, (b) 12% high perturbation, and (c) 15% high perturbation.
Many scholars have shown that the non-axisymmetric endwall contouring of gas turbine tend to form a convex area near the pressure surface and a concave area near the suction surface. They call it typical “S” shape. However, the hydraulic turbine optimization results in this article do not fully comply with the above rules. It can be seen that NEW_H_10% has an obvious convexity area (increasing the radius) from the inlet to the outlet at the hub endwall surface near the PS of the blade, and a concave area (decreasing the radius) appears near the SS of the blade, extending to the trail edge. NEW_S_10% has a slight concave area (increasing the radius) on the shroud endwall near the SS of the blade, while an obvious convex area (decreasing the radius) appears near the middle of the cascade passage and extends to the trailing edge of the suction surface along the streamline direction. NEW_H-S_10% means that non-axisymmetric endwall contouring optimization is applied on hub surface and shroud face simultaneously. It can be observed that endwall curvature of NEW_H-S_10% is smaller than that of NEW_H_10% and NEW_S_10%. Simultaneously, an interesting phenomenon in Figure 9(a) is that the concave and convex distribution of the NEW_H-S_10% are almost opposite to NEW_H_10% and NEW_S_10% except the shroud area of NEW_H-S_10% where it is close to the suction surface at downstream of passage. The similar phenomenon also occurs in Figure 10(b) and (c). However, comparing NEW_H_10% and NEW_H_12%, and NEW_S_10% and NEW_S_12%, respectively, it is observed that the fluctuation height distribution patterns are not exactly same, and the local area is evenly reversed such as the height distribution of NEW_S_10% and NEW_S_12% at upstream of the flow passage close to the pressure surface. All the phenomena mentioned above also occur on NEW_H_12% and NEW_H_15%, and NEW_S_12% and NEW_S_15%. Making further comparisons between Figure 10(a)–(c), it is found that the concave and convex depth of the non-axisymmetric endwall does not increase continuously with the raising of the radial fluctuation upper and lower limits of the endwall control variables at same optimization condition, this may attribute to some reasons which are that the multi-objective optimization is a balancing process for performance improvement of all target objects, rather than a nearly linear functional relationship between variables and OF like single-objective optimization and there is always an optimal range of fluctuation height.
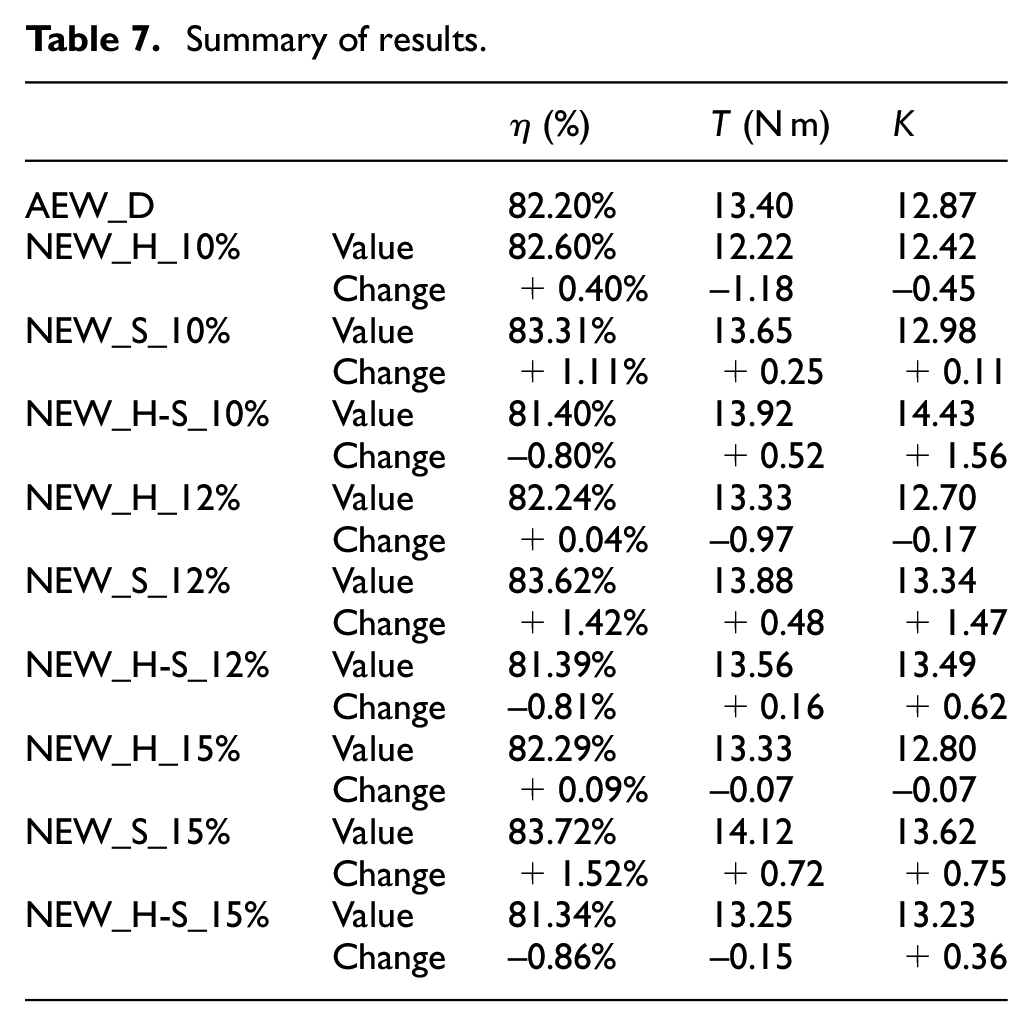
All the obtained optimization results of performance characteristics are shown in Table 7, where
Summary of results.
Static pressure distribution
Due to limited space, this section only selects five optimum endwall shapes, NEW_S_10%, NEW_S_12%, NEW_S_12%, NEW_H_15%, and NEW_H-S_15%, as objects to do a further research in order to investigate the influences of various perturbation heights and various profiling surfaces (hub, shroud, or both endwalls) on flow field.
Figure 10 shows the effects of NEW_S_10%, NEW_S_12%, and NEW_S_15% on the pressure distribution at different span heights. According to Figure 11(a)–(c), it is found that the influence of the non-axisymmetric shroud endwall shape on the pressure distribution is weaker when blade section is more and more close to the hub surface (0%span) and only a little faint changes happened at 5%. At the same span height, a higher perturbation height results in more significant impacts on pressure distribution. NEW_S_15% showed the most tremendous change in blade loading distribution. The pressure on the PS of the blade declines sharply from 0.3 to 0.55 Cax, while the pressure on the SS rises obviously, which makes cross passage pressure gradient decreased. However, the prominent pressure changes occur in the range from 0.55 to 0.9 Cax on the SS, this is caused by more rugged endwall surface near the SS. Further analysis from a geometric perspective, the primary reason is that the contraction flow channel throat makes flow area shrunk with the result of suddenly accelerating the speed of fluid flow, and this impact is also superimposed with the effect caused by non-axisymmetric endwall configuration.

Static pressure distribution on rotor surface with different perturbation heights: (a) 5%span, (b) 50%span, and (c) 95%span.
The area integral of the pressure distribution curves on the PS and SS can be used to obtain the acting force imposed on the blade. The force is multiplied by the distance between the centerline of the shaft and the force to obtain output torque. Therefore, the area enclosed by the SS pressure curve and the PS pressure curve represents the magnitude of the output torque. From Figure 11(a)–(c), a conclusion can be summarized that the output torque of turbine increases steadily with the fluctuation height ranging from 10%span to 15%span. This phenomenon coincided with the increase in values of 0.25, 0.48, and 0.72 is shown in Table 7. It is vital to note that there is a significant pressure mutation in the range from 0 to 0.2 Cax. This is reasonable to assume that the fluid impacts the leading edge of the blade close to suction surface under a high-speed rotation, causing an abrupt change in blade loading and making the pressure distributed on the PS near the leading edge of blade decreased and the pressure distributed on the SS near the leading edge of blade increased. The rotor blade’s setting angle (
Figure 12 shows the effect of NEW_H_15%, NEW_S_15%, and NEW_H-S_15% on blade loading distributions at different span heights. It was observed that NEW_S_15% has an obvious influence on the pressure distribution at 95%span, and NEW_H_15% merely has a weak impact at 5%span (near the hub). On the 50%span and 95%span height intersection planes, the effect of NEW_H_15% on pressure distribution almost can be ignored. NEW_H-S_15% affects blade loadings on the whole blade. All of those phenomena depicted above indicate that for a small size hydraulic turbine cascade with low aspect ratio, the effect of the non-axisymmetric endwall shape on the flow field is only noticeable near the contouring position. It can also be found that the pressure curve changes do not show some regularities with the raising of the radial fluctuation upper and lower limits of the endwall control variables at same optimization condition.

Static pressure distribution on rotor surface with different contouring ways: (a) 5%span, (b) 50%span, and (c) 95%span.
Distribution of total pressure loss coefficient
Differing from the definition of the total pressure loss coefficient of the gas turbine, the hydraulic turbine cascade total pressure loss coefficient Cp is defined as follows

where
Figure 13 shows the pitchwise mass-averaged total pressure loss coefficient distribution along the blade chord (h) (spanwise direction) at rotor cascade exit.

Pitchwise mass-averaged total pressure loss coefficient at rotor exit: (a) shroud profiles and (b) hub, shroud, and both endwalls profiles.
The S is defined as a proportional parameter which is used to evaluate the effect of profiled endwall on loss coefficient. S can be calculated by the following

where
Comparing the curves in Figure 13(a), it is quite obvious that near the shroud (from about 0.8 to 1 span), the exit total pressure loss coefficient is significantly reduced due to the optimized endwall. But, when it is far away from the shroud endwall (from about 0 to 0.8 span), the total pressure loss is slightly increased. At the same time, the exit total pressure loss coefficient of NEW_S_15% is higher than that of others. From the overall point of view, the shroud endwall contouring optimization achieves a partial improvement in the total pressure loss coefficient where all of them decrease the peak value, and when it is far away from the profiling position, it has a significant negative effect as well. This negative effect continues to increase with the radial fluctuation upper and lower limits of the endwall control variables ranging from 10%span to 15%span. The S value of NEW_S_15%, NEW_S_12%, and NEW_S_10% is 0.64%, 0.021%, and −0.123%, respectively. This indicates that NEW_S_15% and NEW_S_12% have a negative effect on efficiency except NEW_S_10%. However, it is not surprising that the total pressure loss coefficient is not improved in the entire span because the OF and constraints are applied to the efficiency at the stage condition, not individually for rotor row only. That is why all of them achieve an obvious improvement in efficiency according to the data in Table 7. Figure 13(b) shows the pitchwise averaged total pressure loss of hub profiling, shroud profiling, and both endwalls profiling measured at rotor cascade exit. The S value of NEW_S_15%, NEW_H-S_15%, and NEW_H_15% is 0.64%, 0.264%, and 0.069%, respectively. This means that all cases when profiled endwalls are applied show loss increase at whole span regions. However, NEW_S_15% improves the stage efficiency by 1.52%, NEW_H_15% improves the stage efficiency by 0.09%. Something can be observed that the profiled endwall when an efficiency optimization is applied may not show amelioration for total pressure loss at rotor exit according to Figure 12, because efficiency is not only related to pressure loss, but also related to torque.
NEW_S_15% gives the most significant performance improvement to the cascade. Therefore, this part focuses on comparing it with AEW_D to investigate the effect of optimum profile on the flow field characteristics. Figure 14 shows the total pressure loss coefficient distribution contours comparison at outlet cross section between the AEW_D and the NEW_S_15%. After optimization, the total pressure loss coefficient distribution near the shroud endwall is significantly improved, and the peak loss value at the trail edge of blade where it was close to the shroud endwall (the high loss region between PS and SS) is descended, it is supposed to ascribe a lacunose surface of shroud. This reveals a truth that an optimized endwall can ameliorate the Cp distribution of outlet.
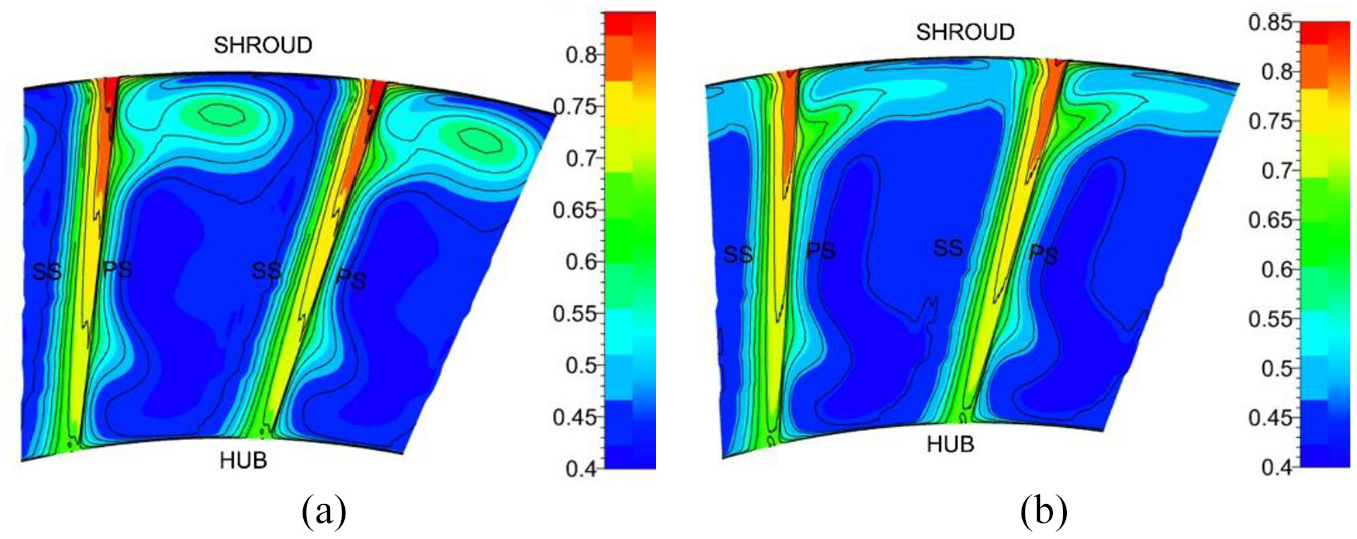
Cp distribution on the exit plane: (a) AEW_D and (b) NEW_S_15%.
Absolute kinetic energy
Flow field absolute kinetic energy (E) in hydraulic turbine is defined as follows 27

where

Distribution of absolute kinetic energy: (a) AEW_D and (b) NEW_S_15%.
Flow field distribution
The pressure distribution of the AEW_D and the NEW_S_15% along turbine cascade passage is further analyzed. Figure 16 shows the pressure distribution ranging from 5%Cax to 95%Cax in the axial direction. It is found that the circumferential reverse pressure gradient of NEW_S_15% on the cross sections of 25%Cax, 75%Cax, and 95%Cax all show some obvious mitigation compared to AEW_D, and the pressure distribution is more uniform. The NEW_S_15% reduces the peak value of pressure distribution near the PS boundary at 25%Cax and shrinks the low pressure distribution district approached the shroud endwall at 75%Cax. Meanwhile, it significantly reduces the high pressure distribution area in the middle of the passage from the range of 0%span to 80%span with the result of alleviating the circumferential reverse pressure gradient. In terms of the conditions at 5%Cax, it is found that NEW_S_15% produces a little change on pressure distribution. In fact, alleviating the circumferential reverse pressure gradient is vital for a cascade to reduce secondary flow loss and improve stage efficiency. It is noticeable that the optimum endwall profiles and flow field characteristic contours all show that the flow field physical model of the hydraulic turbine cascade in present article is not completely consistent with the gas turbine, it is necessary to do a further depict through limiting streamlines contours. Figure 17 shows the limiting streamlines contours of the cascade passage at different span. Compared with the contours shown by Kaliyaperumal et al., 28 it can be seen that there is no obvious observable horseshoe vortex and passage vortex in the stator or rotor flow field, and no boundary layer separation phenomenon can be recognized. The flow model in present turbine drilling hydraulic cascade is depicted in Figure 18.

Pressure distribution at different passage cross: (a) AEW_D and (b) NEW_S_15%.

Velocity and limiting streamlines distribution at different span heights.

Turbine drilling hydraulic cascade flow model.
The possible reasons why there are apparent differences between present cascade and gas turbine cascade are that the fluid medium is an incompressible fluid (here is water) in present case; at the same time, the size of turbine drilling hydraulic cascade is far smaller than that of gas turbine. Those distinguishing features cause the boundary layer in hydraulic turbine too thin to form a significant passage vortex as shown in Figure 1, and it can also give a reasonable explanation why the unevenness law of optimum profiles shown in this article are not completely identical with the gas turbine cascade. However, it doesn’t mean that there are no secondary flows in hydraulic cascade because the circumferential reverse pressure gradient is still exiting.
Off-design performance experiment
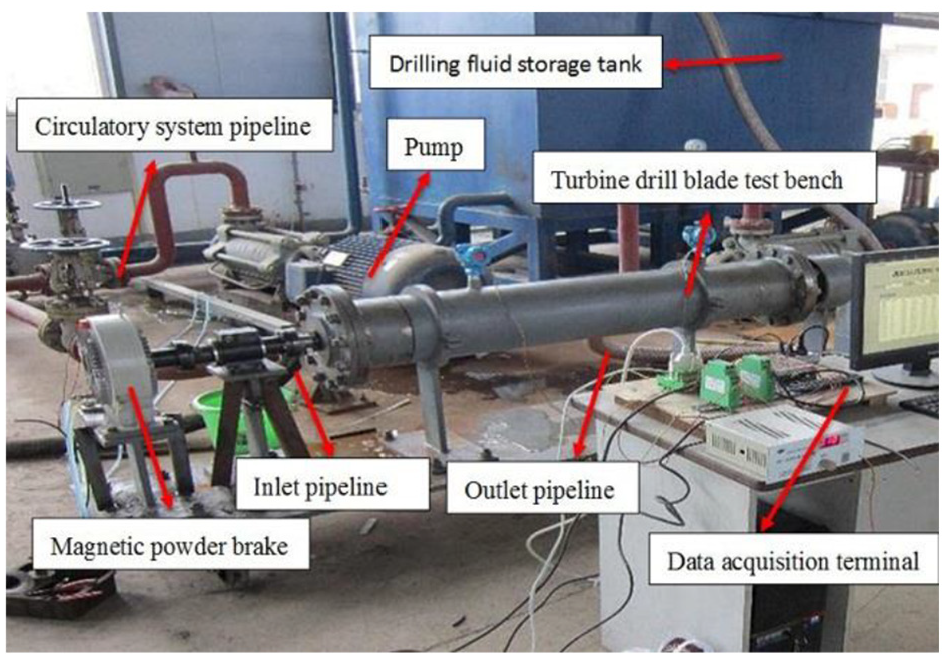
In the last investigation part of this article, the experimental performance of optimized endwall is discussed. Due to the small size of the hydraulic turbine cascade, it is very difficult to observe the internal flow field changes in detail through experimental equipment. The turbine drill designers tend to pay more attention to the macroscopic output characteristics of the hydraulic cascade. Therefore, only the macroscopic characteristic parameters can be measured by present experiment equipment in order to confirm the superiority of optimum profiles. As shown in Figure 19, the water-loop of the facility is quasi-closed and it includes a turbine drill blade test bench where 10-stage hydraulic cascade is installed in a pump to pressurize the drilling fluid, inlet/outlet pipelines, and data acquisition terminal for performance parameters measurement and processing.
Experiment equipment.
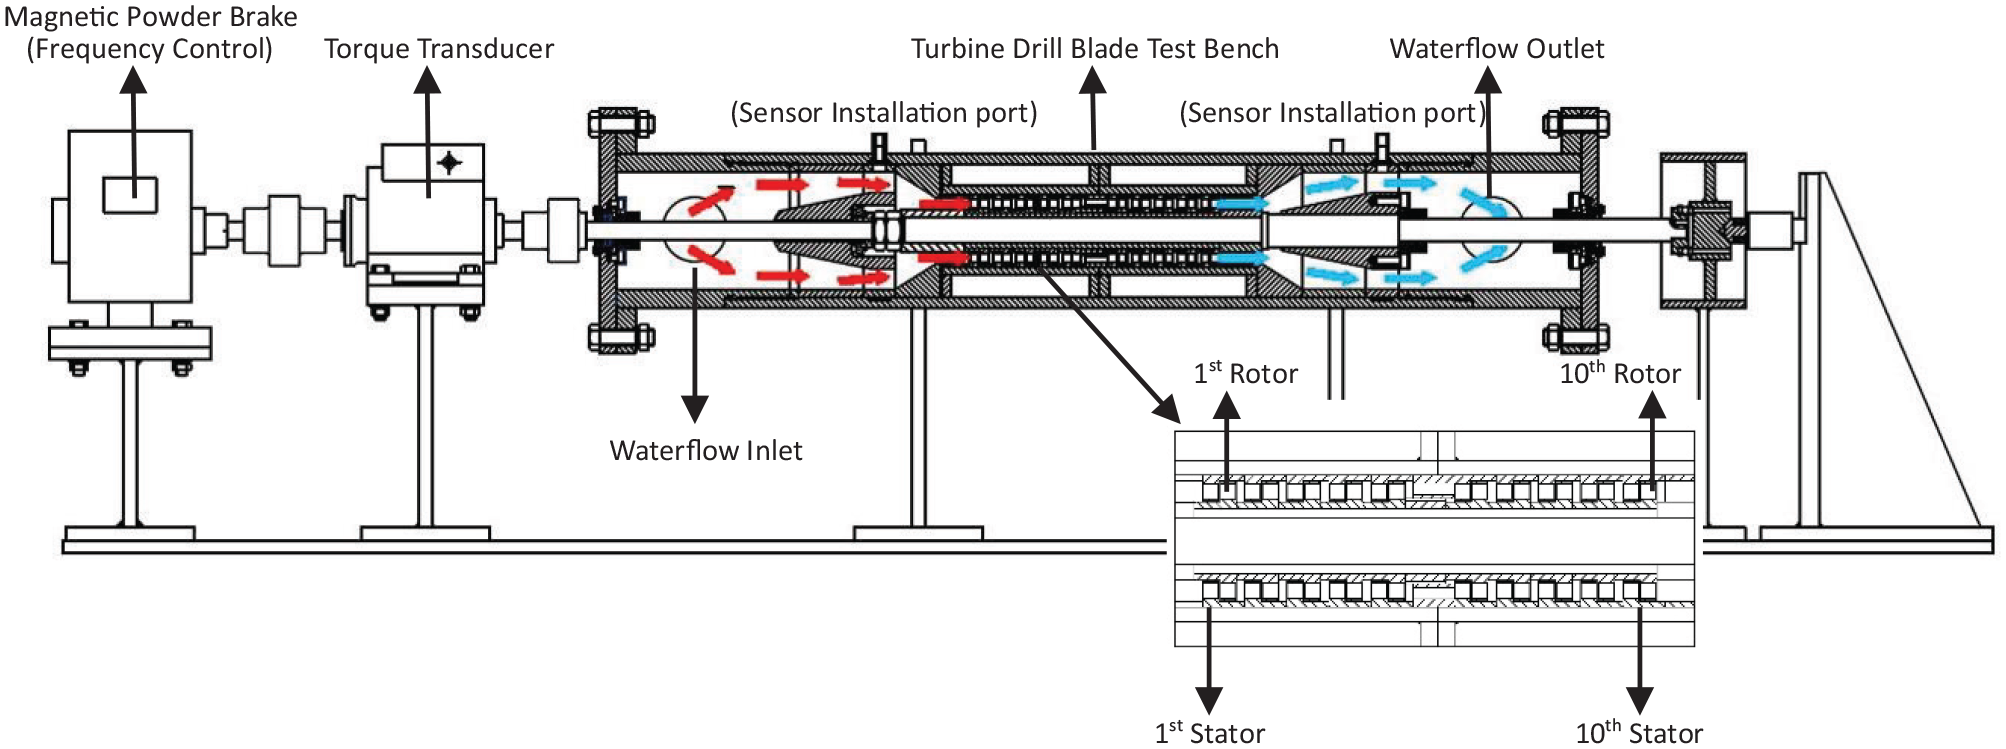
The test bench shown in Figure 20 is designed according to the installation state of the turbine in a turbine drill. Ten-stage hydraulic turbine (NEW_S_15% turbine or AEW_D turbine) is installed in the turbine drill blade test bench. Pressure and flow sensors are installed at the port as shown in Figure 20. During operation period, the pump transports the drilling fluid (here replaced by clean water) to the waterflow inlet via inlet pipeline, and then high-pressure drilling fluid impacts the turbine rotor inside the bench to drive the center shaft. Magnetic powder brake controls the shaft’s rotational frequency to simulate the working conditions under different loads (i.e. off-design operating condition). Finally, the drilling fluid flows out the bench and returns to the circulatory system pipeline via outlet pipeline. The data acquisition terminal processes the sensors’ data and calculates the output performance parameters of the turbine.
Experiment equipment.
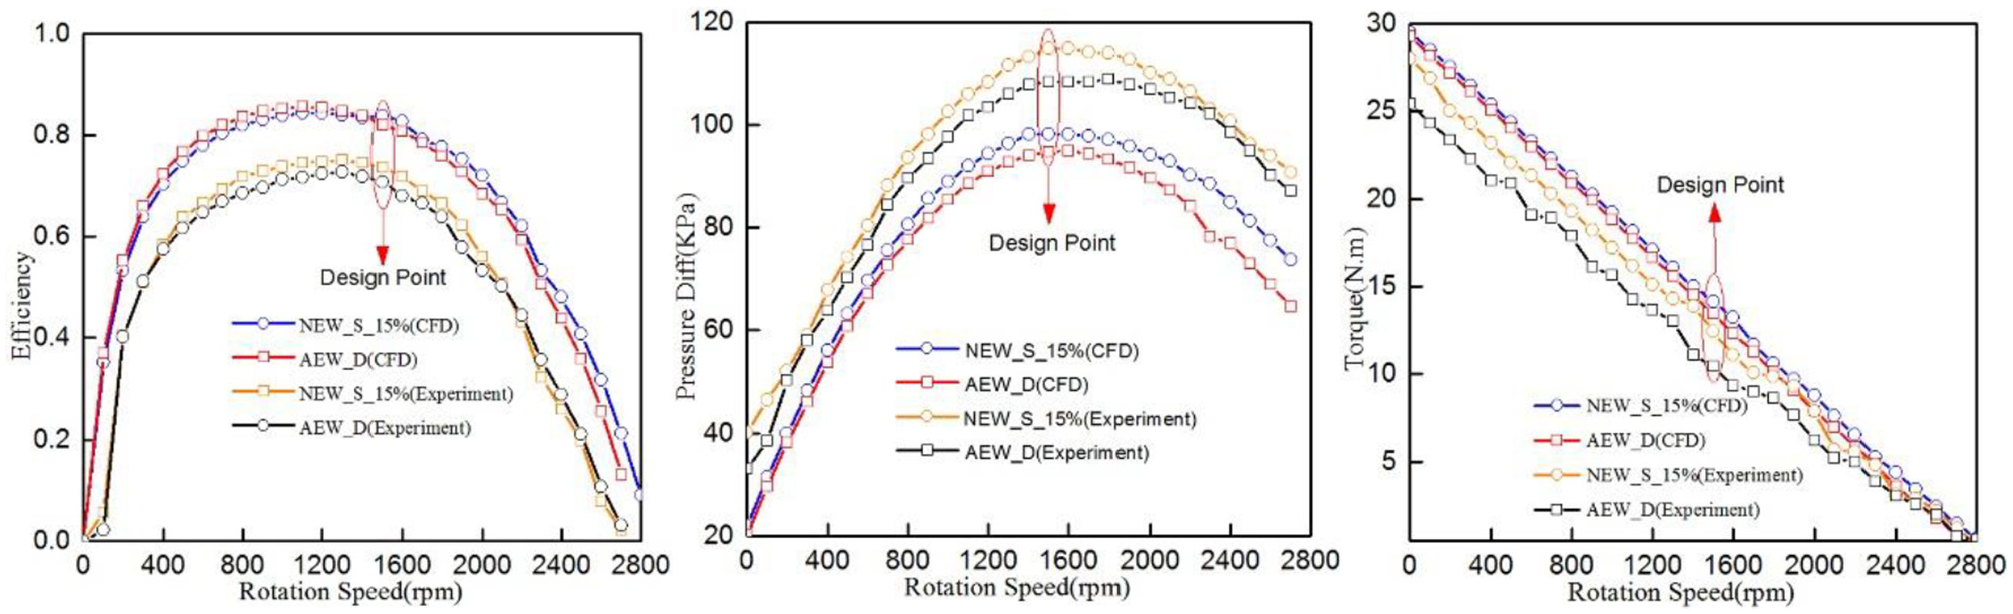
As shown in Figure 21, CFD simulation shows better performance results than that of experiment without concerning the pressure leakage loss and friction loss between turbine stages in a real working condition. Consequently, the value of stage efficiency and output torque is lower than CFD simulation, and the stage pressure difference is higher than CFD simulation. Compared with the AEW_D, NEW_S_15% causes an improvement of 3.93% in efficiency and 5.37% in torque at design point condition (experiment results). When it deviates from design point condition, NEW_S_15% also realizes an average improvement of 1.32% in efficiency and 5.27% in torque in whole conditions. All of those results indicate that a hydraulic turbine with an appropriate non-axisymmetric endwall shape can really improve turbine performance.
Off-design characteristic curves.
Conclusion
In this article, the non-axisymmetric endwall contouring method is first applied to the hydraulic cascade of the turbine drilling tool and achieves good results. The AEW_D turbine parameters obtained by the automatic bridge coordinate measuring machine are used to reconstruct an approximate model. This is the first step. The second is that a design–simulation–optimization method of non-axisymmetric endwall contouring applied on hydraulic turbine cascade is established. The third step is to discuss the effect of optimum profiles on flow field characteristics in detail. Finally, the feasibility of this method is verified by experiment.
Nine optimum profiles are obtained by multi-objective genetic optimization algorithm (NSGA-II). They all show an irregular endwall shape which differs from the typical “S” shape of an optimized gas turbine cascade. The following detailed flow field analysis show that the flow field physical model of the hydraulic turbine cascade in present article is not completely consistent with the gas turbine, there is no obvious observable horseshoe vortex and passage vortex in the stator or rotor flow field, and no boundary layer separation phenomenon can be recognized by CFD calculations. This may explain why the optimum profiles of hydraulic turbine are different from the one of gas turbine.
CFD simulation solutions show that the non-axisymmetric endwall contouring technology applied on hub endwall and shroud endwall all realize an improvement in efficiency in present work. Among all optimum profiles mentioned above, NEW_S_15% has the best comprehensive performance and it causes an improvement of 1.52% in efficiency and 0.72 N m in torque with respect to the original axisymmetric endwall (AEW_D). At the same time, when working condition deviates from design point, NEW_S_15% also exploits significant advantages to improve the output torque in whole conditions and increase the efficiency in partial working conditions when rotation speed is lower than 1400 r/min. The reliability of the non-axisymmetric endwall applied on hydraulic turbine cascade is fully verified by off-design performance experiment.
A further comparison between NEW_S_15% and AEW_D shows that the optimized non-axisymmetric endwall mainly improves the pressure distribution in the passage, and reduces the reverse pressure gradient which results in secondary flow loss; consequently, it causes an improvement in efficiency and torque.
Footnotes
Handling Editor: James Baldwin
Declaration of conflicting interests
The author(s) declared no potential conflicts of interest with respect to the research, authorship, and/or publication of this article.
Funding
The author(s) disclosed receipt of the following financial support for the research, authorship, and/or publication of this article: This study is supported by National Key R&D Program Funded “Development of Double-layer Continuous Tube Double Gradient Drilling Lifting System” (No. 2018YFC0310201) and Key Laboratory of Deep Geodrilling Technology, Ministry of Land and Resources Funded (No. KF201807). Such supports are greatly appreciated by the authors.