
Abstract
Health condition monitoring through comprehensive monitoring, incipient fault diagnosis, and the prediction of impending faults allows for the promotion of the long-term performance of wind turbines, particularly those in harsh environments such as cold regions. The condition monitoring of wind turbines is characterized by the difficulties associated with the lack of measured data and the nonstationary, stochastic, and complicated nature of vibration responses. This article presents a characterization of the vibrations of an operational wind turbine by spectrogram, scalogram, and bi-spectrum analyses. The results reveal varied nonstationary stochastic properties and mode-coupling instability in the vibrations of the tested wind turbine tower. The analysis illustrates that the wind turbine system vibrations exhibit certain non-Gaussian stochastic properties. An analytical model is used to evaluate the nonstationary, stochastic phenomena and mode-coupling phenomena observed in the experimental results. These results are of significance for the fault diagnosis of wind turbine system in operation as well as for improving fatigue designs beyond the wind turbulence spectral models recommended in the standards.
Keywords
Introduction
Wind energy has become an important type of sustainable energy, and with the increased demand for wind energy, its maintenance has become very important. The application of cost-effective fault diagnosis techniques as well as fatigue design is crucial to achieving this goal. The implementation of structural health condition monitoring allows for the promotion of system long-term performance through comprehensive monitoring, incipient fault diagnosis, and the prediction of impending faults.1–7 Fault diagnosis evaluates the current system health condition based on the sensor measurement,8,9 and a prognosis procedure predicts the system’s future health condition based on its current state.10,11 Many challenges still remain in performing wind turbine condition monitoring, including the nonstationary, stochastic, and nonlinear features of the aerodynamics of such systems. Conventionally, wind turbine system fatigue designs have been based on the assumption of Gaussian processes of wind turbulence load, which may be substantially different from the real wind load.
The difficulties associated with wind turbine condition monitoring include the lack of measurable excitation, the nonstationary, and stochastic features. The vibration of wind turbine is nonstationary, stochastic, and complicated because of the nature of the wind excitations and the system’s complex vibration characteristics. Despite its importance and influence on the wind turbines, there is limited study published on wind turbine vibration testing in cold and remote areas; most previous wind turbine vibration research projects have mainly focused on computer models based on the first principles, simulation, and verification, and the computer models are validated by field testing.12–25
Wind turbines often exhibit nonstationary stochastic vibrations due to variable wind loads. However, to comprehensively characterize the nonstationary stochastic properties, various kinds of tools have to be used. A time–frequency analysis can characterize the patterns of nonstationary stochastic signals in a joint time–frequency domain. However, the time–frequency representations, such as spectrograms, suffer from either time–frequency smearing or cross-term interferences. Continuous wavelet transforms or scalograms have been suggested to have the merits of fine time–frequency resolution and the suppression of cross terms. Moreover, spectrograms are based on the linear system assumption, which is unable to characterize complex nonlinear systems. The contemporary dynamics approach of higher order statistics offers a new tool to tackle the complex features of the nonstationary dynamic system. In the family of higher order spectra, the generally used is the bi-spectrum or tri-spectrum, which contain information that standard power spectral analysis methods cannot provide.26–29 Different from a fast Fourier transform (FFT) analysis, which allows the decomposition of a signal into individual periodic frequency components and can establish the relative intensity of each component, the bi-spectrum can be viewed as a decomposition of the third moment (skewness) of a signal over frequency and is able to detect nonlinear interactions between frequency components and nonstationary characteristics. And, higher order spectra can indicate the phase information of a signal and suitable for analyzing non-Gaussian processes. Wind turbines are complex systems that generally possess varied vibration properties and are commonly subject to uncertain nonstationary flow. To perform condition monitoring using output data, it is necessary to characterize the nonstationary stochastic vibrations of the wind turbine. It is, therefore, crucial to assess the complex system vibrations to build a connection between an input of wind flow excitation and a system output as vibrations, thus helping to assess loads and vibrations in different working conditions.
This study presents the dynamic response recorded by a wind turbine monitoring system in Alaska for varied seasons. The nonstationary properties are illustrated using spectrograms and scalograms. In particular, the stochastic features are characterized using the bi-spectrum, which indicates that the wind turbine vibrations are non-Gaussian processes with nonstationary stochastic features. The higher order spectrum analysis is a useful method to characterize complex stochastic processes and distinguish varied processes from various conditions. The method helps advance the understanding and characterization techniques for identifying nonstationary, stochastic vibrations of wind turbine.
Wind turbine monitoring
The monitoring system was installed on a wind turbine located in Alaska. The place is underlain by warm permafrost between −0.4°C and −0.1°C. The horizontal axis turbine uses a rotor with a 21 m diameter and three fixed-pitch blades. The tubular steel monopole’s hub height is 37 m. The tower has a mass of 13,800 kg, and the cut-in and cut-out speeds are 3.5 and 25 m/s, and the maximum wind speeds are 56 m/s. A steel pile group foundation with thermal siphons was used to maintain a frozen condition of the soil and the safety of structure.
Six accelerometers were installed on the wind turbine tower’s inner surface. Two accelerometers in the north-south and east-west directions were placed at just below the nacelle, the tower’s midpoint, and approximately 1.5 m above the tower base, respectively. Figure 1 indicates the wind turbine tower and sensor locations. The data was collected from September 2013 to September 2014.

Wind turbine and accelerometer locations.
Both field decay testing and numerical modeling were conducted to identify low frequencies related to the tower and rotor blade. 24 A tower decay test was conducted to measure the wind turbine free decay response. Table 1 shows the frequencies of the wind turbine based on the field test and finite element model (FEM). The tower modal frequencies were 0.79, 3.38, and 3.53 Hz, and the blade flapwise modal frequency was 4.00 Hz from the FEM; additionally, the wind turbine system modal frequencies were at 0.80, 2.50, 3.60, and 3.90 Hz as determined via field testing data. Based on the FFT analysis results, the wind turbine fundamental frequency changed between 0.77 and 0.84 Hz in a year. The tower modes at 3.38 and 3.53 Hz approach to the blade flapwise mode, which may lead to mode-coupling instability as the rotation speed increases.
Identified modal frequencies of the wind turbine.
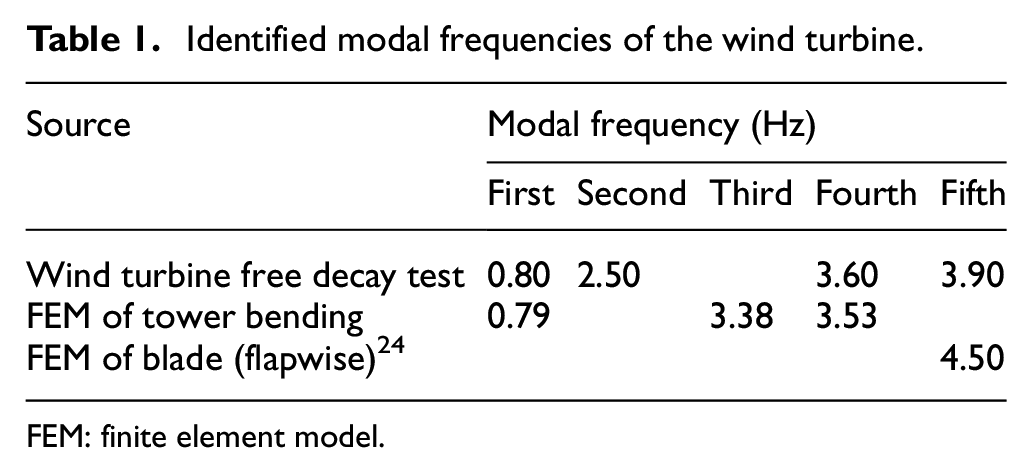
FEM: finite element model.
Vibration spectrum analysis
To evaluate the influence of extreme environmental conditions on the turbine vibration response, the representative vibration signal collected in February 2014 is investigated. Figure 2 shows the recorded N-S direction acceleration time histories just below the nacelle in February 2014. Using FFT analysis, the fundamental frequency, rotor speed frequency, the three blade–passing frequency, and multiple of three of the rotor’s frequency are calculated, which are 0.80, 0.98, 2.94, and 5.88 Hz, respectively.
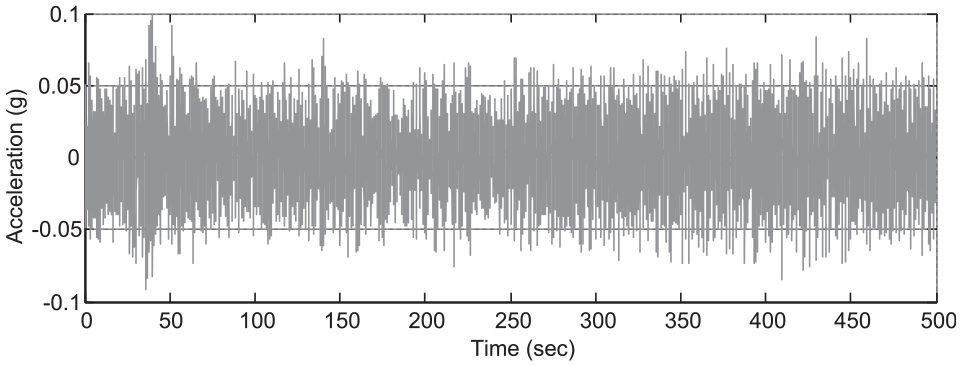
Acceleration on tower top in February 2014.
Figure 3 shows the spectrogram of the acceleration signal in February 2014 with the amplitude plotted in dB. According to Figure 3, the corresponding frequency lines are 0.80, 0.98, 2.94, and 5.88 Hz modes, with visible time-varying features. Figure 3 shows the vibration response for time-varying modulations in frequency and amplitude. Figure 4 shows the scalogram of the acceleration signal in Figure 2, which is a diagram displaying the results of a wavelet transform that has axes for time, scale, and coefficient value. The characteristic instantaneous frequencies in the time–frequency domain are clearly demonstrated in Figure 4.

Spectrogram of the acceleration signal in February 2014.
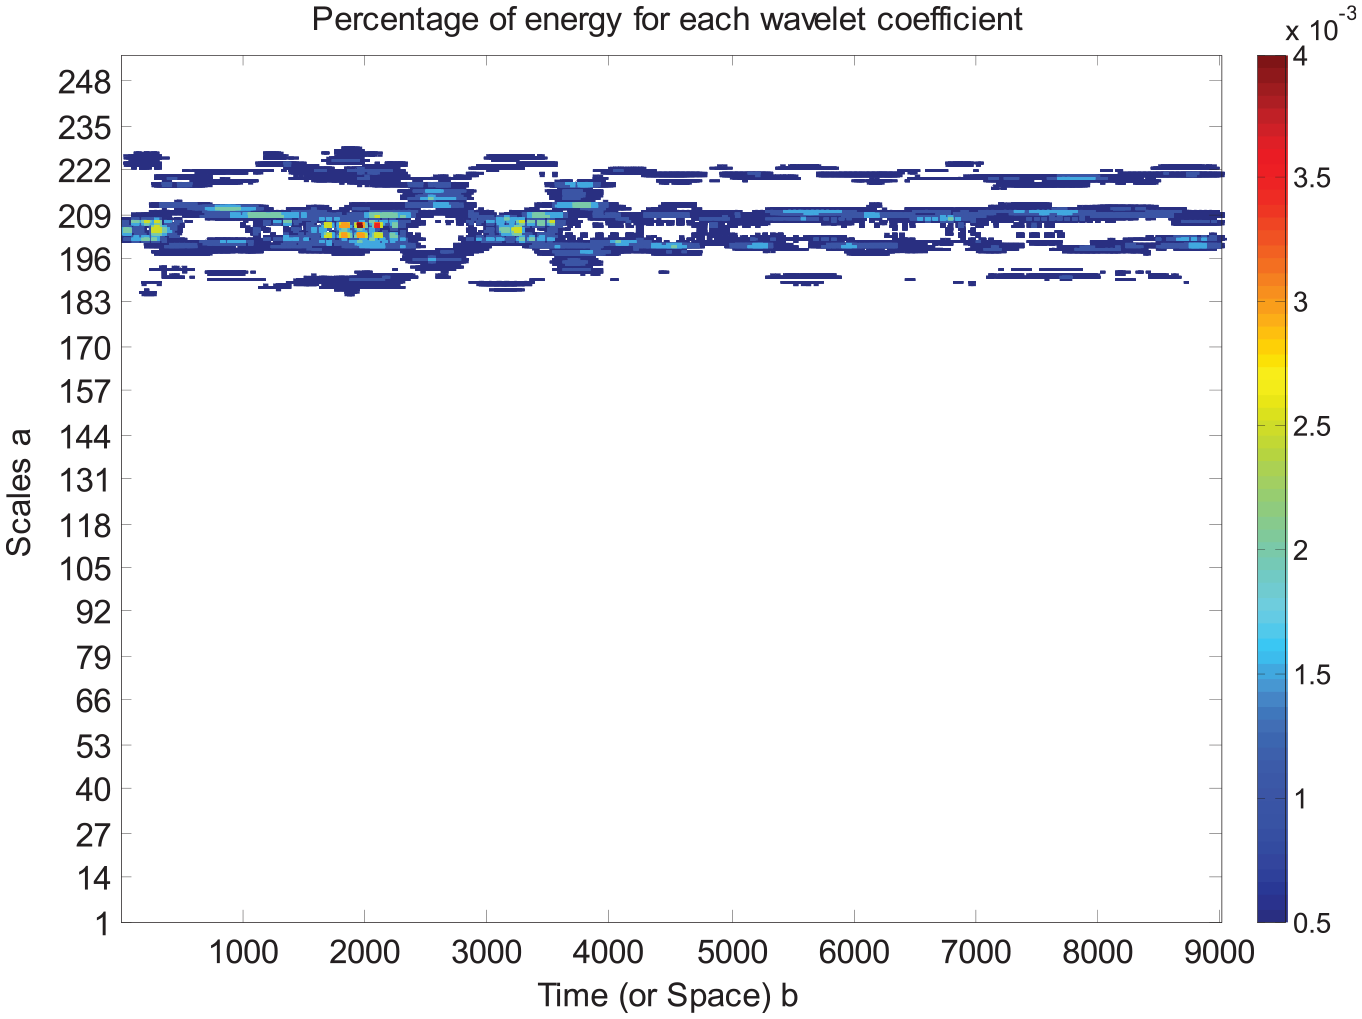
Scalogram of the acceleration signal in February 2014.
The higher order spectra of wind turbine vibrations
The bi-spectrum
The higher order statistical method is developed in recent years. As one of these higher order statistical methods, the bi-spectrum is an effective signal processing technology to detect complex vibrations and non-Gaussian properties.26–28 Higher order spectra can be established as follows. Let {x(n)} be a real, discrete time series with high-order cumulant

The higher order spectrum is specified as a Fourier transform of the cumulant

Let cxx(τ1, τ2) be the third-order cumulant of a real, discrete, zero-mean stationary process {x(n)} defined as

where E is the operator. Then, its Fourier transform is called the third-order spectrum or bi-spectrum

where

Then

where “*” stands for the conjugate. The bi-spectrum is the double Fourier transformation of the second-order moment of a time signal that involves amplitudes and phases. Higher order spectra are not sensitive to Gaussian processes, and this feature can be used to restrain noise. Higher order spectra can also be used to identify the complex mode-coupling property of signals. The bi-spectrum provides an insight into the coupling between frequencies of a signal compared to the conventional power spectrum density that only provides the content of frequencies and their amplitudes. The higher order spectra reveal the coupling between the frequencies at
Application of the bi-spectrum to wind turbine vibrations
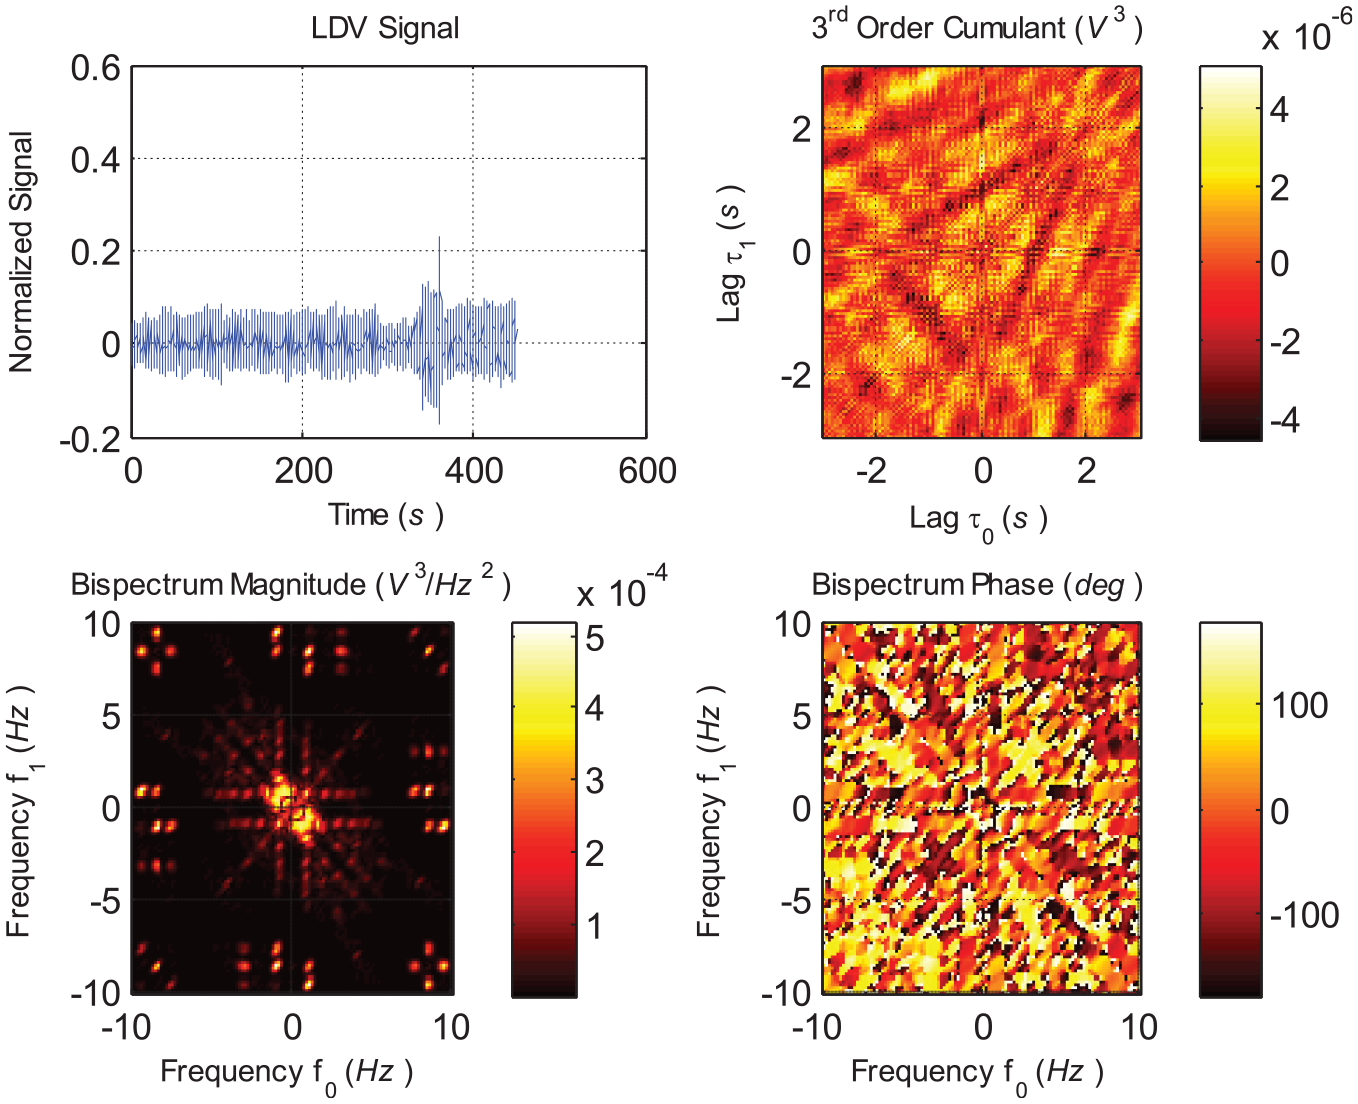
Nonstationary, nonlinear increments lead to the development of time-varying frequencies and new frequencies that may or may not correspond to the fundamental frequencies and harmonics. Figure 5 shows the normalized acceleration signal collected in February 2014, its cumulant, and the amplitude and phase of its bi-spectrum. Figure 6 shows the three-dimensional (3D) bi-spectrum and the spectral contour of the acceleration signal recorded in February 2014. The color represents the relative change in amplitude of the bi-spectrum: red indicates the greatest increase, and blue indicates the greatest decrease. The cross-bispectrum terms as specific terms for a high quadratic phase coupling are not visible, suggesting that the system exhibited linear and Gaussian statistics.26–29

Normalized acceleration signal in February 2014, its cumulant, and bi-spectrum.
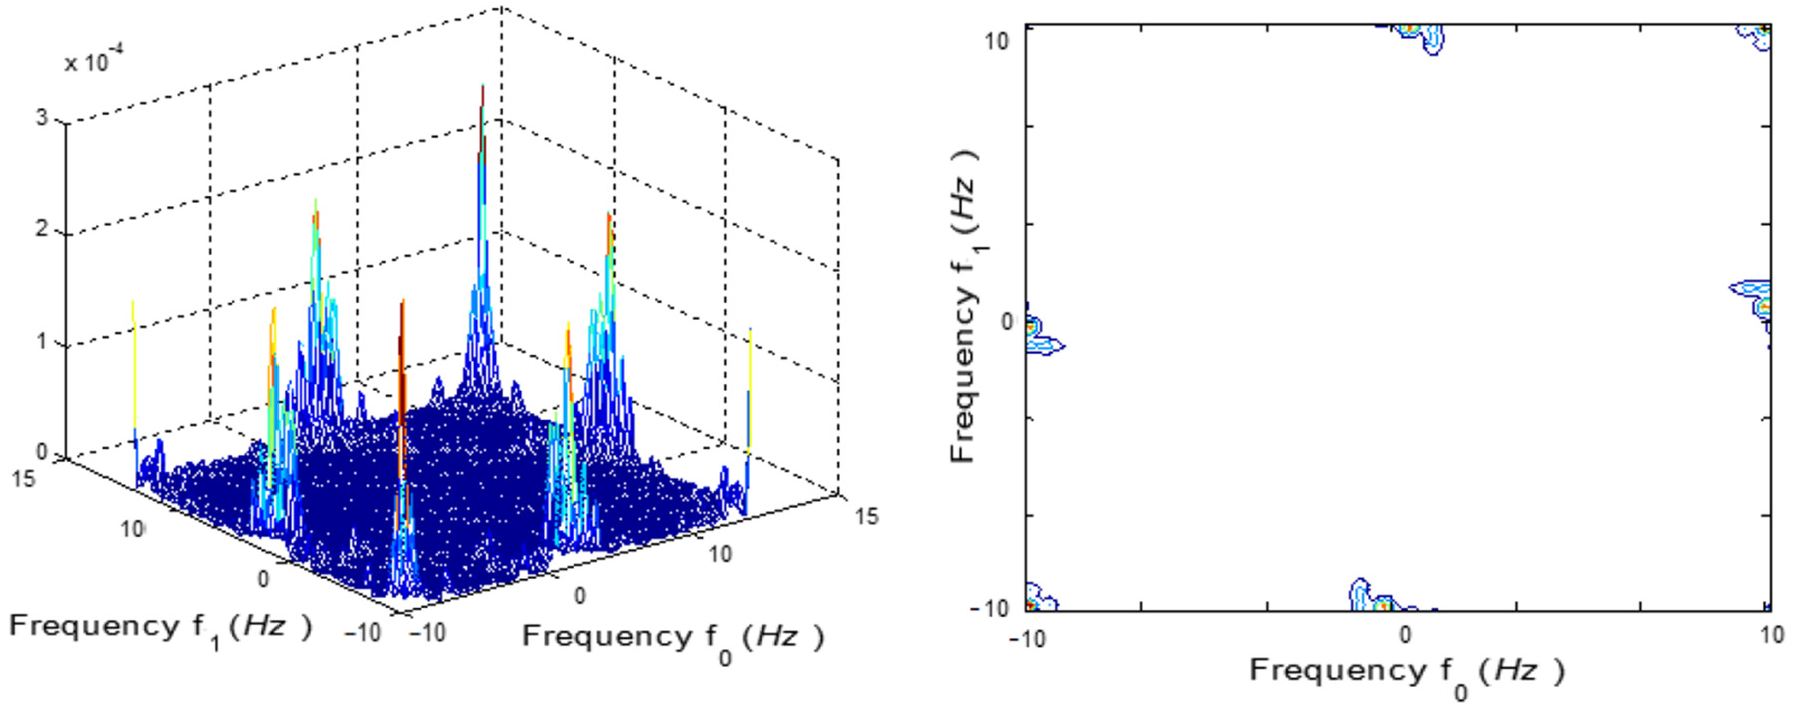
3D bi-spectrum of the acceleration signal in February 2014 and its contour.
Figure 7 shows the normalized acceleration signal recorded in March 2014, its cumulant, and the amplitude and phase of its bi-spectrum. Figure 8 shows the 3D bi-spectrum and the spectral contour of the acceleration signal recorded in March 2014. Similarly, Figure 9 is the normalized acceleration signal recorded in September 2014, its cumulant, and the amplitude and phase of its bi-spectrum, and Figure 10 shows the 3D bi-spectrum and the spectral contour of the acceleration signal recorded in September 2014. In Figures 7–10, the large value of the cross-bispectrum indicates a high quadratic phase coupling and interaction of different modal frequencies. In addition to specific frequencies and harmonics, the bi-spectrum provides additional details about the spectral content of the vibration signal and how different harmonics interact with one another, as shown by the parallel bands in the diagonals of the bi-spectrum. The parallel bands suggest the energy transform from one frequency to another, which is a unique mode-coupling phenomenon that is not revealed using conventional spectral methods. This feature of higher order spectra can be used to identify various operational conditions in which the behavior couples multiple modes and to find transitions and interactions among multiple activities associated with nonstationary mode interactions occurring in the observed vibrations. Figures 7–10 offer phase and phase coupling details caused by nonlinearity, which can be further utilized to correlate with simulations.
Normalized acceleration signal in March 2014, its cumulant, and bi-spectrum.

3D bi-spectrum of the acceleration signal in March 2014 and its contour.

Normalized acceleration signal in September 2014, its cumulant, and bi-spectrum.

3D bi-spectrum of the signal in September 2014 and its contour.
Wind turbine vibration signals often have nonstationary stochastic features in addition to complex mode coupled vibrations and are often corrupted by the noise from the wind turbulence. Many models for wind turbulence-related simulation developed assume a Gaussian distribution. Higher order spectra are identical to zero for a Gaussian process, and as such, the nonzero higher order spectra can be used to assess the existence of non-Gaussian responses. Figures 7–10 clearly show the existence of nonzero higher order spectra in the acceleration responses of the wind turbine, indicating the presence of non-Gaussian processes.
Discussion of results
For complex systems, the subsystems’ natural frequencies should have enough separation to prevent coupling and instability. Moreover, the structural system’s natural frequency should have enough separation from the turbine’s operational frequencies to prevent excessive vibration and fatigue failures due to resonance. However, the steel pipe pile foundation of this wind turbine is substantially softer than a concrete slab foundation. According to Table 1, the third and fourth tower modes approach to the blade flapwise mode. It is possible that the fundamental frequency may close to the natural modes of another subsystem, such as the rotor, the operational frequency in the starting or braking case, or during normal operation. As a result, coupled instabilities and resonance may happen.
Wind turbine vibrations can be characterized by complex nonstationary, stochastic vibrations.1–5,18,19 The blade model considers a variable mass and stiffness, and the influences of gravity and centrifugal stiffening caused by the time-varying rotation of the blades and wind turbulence load can be given as follows

In equation (7),
There are quasi-periodic and instability effects in the system matrices due to the system modal coupling mentioned above. And, there also has a nonstationary stochastic excitation caused by the time-varying wind excitation and turbulence represented by
Many modes of other subsystems are speed-independent such as rotor whirl modes.31–33 Particularly in wind turbine applications, the aerodynamic force of the wind turbulence on the blades or turbulent velocity have been characterized by Gaussian probability density functions, such as the Kaimal, von Karman, and Mann models, as recommended in the previous IEC guidelines.34,35 Currently, stochastic wind turbine analyses are mostly based on these idealized turbulence input models that assume a Gaussian distribution for atmospheric turbulence and a normal distribution for the magnitude of velocity. These models may not be able to account for the temporal variation of the stochastic wind field or to preserve spatial coherence, which is a very important feature that describes turbulence structure. The non-Gaussian characteristics of wind speed fluctuations have been recognized.36–38
The above analysis demonstrated that the higher order spectrum based–detection helps exhibit complex vibrations such as mode interaction instability, provides phase information, and makes the quantification of intrinsic non-Gaussian processes in wind turbine systems. These findings are important for developing strategies and thresholds for health condition monitoring implementation and are also helpful for developing design criteria for future wind turbine structural systems. It is noted that correct turbulence modeling is important for fatigue load estimation for wind turbine design. The conventional turbulence models recommended for wind turbine design in standards are all Gaussian statistics-based, which may not be representative of actual wind conditions. The higher order spectral techniques are suitable for the accurate and complete characterization of complex vibration signals. In fact, some exploratory models based on non-Gaussian statistics have been explored.39–41 More work is needed for developing and validating appropriate turbulence models for wind turbine design.
Conclusion
This article uses acceleration data collected from a wind turbine founded in warm permafrost on the west coast of Alaska to characterize nonstationary stochastic wind turbine vibrations using a spectrogram, scalogram, and higher order spectral methods. This work demonstrated the increasing capabilities of these spectral methods and shows that the bi-spectrum is capable of revealing complex vibrations, such as mode interaction and instability, providing phase information and enabling the quantification of intrinsic non-Gaussian processes in wind-induced vibrations. These results are very useful in understanding nonstationary, stochastic vibrations and instability, providing insights into the nature of the complex vibrations, and helping improve health condition monitoring and the future fatigue design of wind turbines.
Footnotes
Handling Editor: James Baldwin
Declaration of conflicting interests
The author(s) declared no potential conflicts of interest with respect to the research, authorship, and/or publication of this article.
Funding
The author(s) disclosed receipt of the following financial support for the research, authorship, and/or publication of this article: This work was supported by the Nanjing University of Science and Technology, Start-up, grant number: AE89991.