
Abstract
The unified strength theory can account for the influence of intermediate principal stress using a specified parameter b, with which the determination of the values and influences of b is significant. In this research, a physical model test was carried out in combination with the numerical simulations to explore the effect of b on a sand foundation loaded by a shallow strip footing. Variation of parameter b would produce significant effect on the deformation characteristics, stress response, failure model, as well as bearing capacity of the sand foundation. In general, a larger b could be adopted to yield smaller magnitudes of stress. The calculated ultimate bearing capacity Pult increases linearly with increase in b, and an increment of 470% can be obtained using b = 1.0 relative to b = 0.0. The comparison of the bearing capacities of physical model test and numerical simulation suggests that b = 0.89–0.99 is the appropriate value for the experimental sand foundation, that ultimately results in a capacity increase in 420%–465% relative to the result of Mohr–Coulomb failure law.
Keywords
Introduction
The function of the foundation is to transfer the load of the structure to the soil on which it is resting, and a properly designed foundation is the precondition of safety for the structure. Consequently, the assessment of safety for a foundation is always an important issue, and many researchers have devoted themselves to study the characteristics and evaluation methods of the deformation, settlement, stability, and bearing capacity of foundations over the past decades. In 1921, Prandtl published the results of his study on the penetration of hard bodies into a softer material. Terzaghi 1 extended the theory of Prandtl and proposed a method to assess the bearing capacity of soils for shallow strip footings, which was commonly referred to as the “Terzaghi” method. Since many simplifications and assumptions have been made, many shortcomings have emerged during the applications of the Terzaghi method. Many developments have been proposed to overcome these shortcomings, such as the use of the wedge limiting equilibrium theory,2–6 rigid-block mechanisms,7–10 and slip-line and numerical simulations.11–15 All the developments have been satisfactorily applied in stability assessment of practical foundation engineering.
The function of strength theory is to judge the yield states of materials, with which the deformation and stability of foundations could be assessed. Considerable effort has been devoted to the formulation of strength theories, failure criteria, and yield criteria. Many versions of these models have been developed, such as the Tresca, von Mises, Mohr–Coulomb, Drucker–Prager, and Hoek–Brown criteria, 16 among which the Tresca and von Mises criteria could be more suitable for the materials that have identical strength both in tension and compression, and the Mohr–Coulomb failure law, Drucker–Prager criteria, and Hoek–Brown criteria can be used for geotechnical materials. Because of its simplicity and practicability, the Mohr–Coulomb failure law is extensively adopted in practical foundation engineering to assess the failure of geotechnical materials, with which most of the analytic solutions presented above were proposed.
The Mohr–Coulomb failure law was proposed based on the maximum principal shear stress and does not consider the effect of the intermediate principal stress σ2 or the effect of intermediate principal shear stress τ12 or τ23 (if σ1 > σ2 > σ3). The effect of intermediate principal stress is one of the most significant mechanical issues for research of strength theory. Many researchers17–27 conducted a large number of true triaxial tests on geotechnical materials to study their behavior under true triaxial conditions, and the existence of the effect of the intermediate principal stress has been confirmed. Many versions of strength theory which could consider the influence of intermediate principal stress have been proposed, among which the unified strength theory is the most comprehensive.
The unified strength theory proposed by Yu and colleagues28–30 considers the influence of the intermediate principal stress using a parameter b. The unified strength theory is a system, which could be adopted to deduce a series of linear convex yield criterion using various values of parameter b, and most of the sophisticated models are its special cases or approximations. The lower border could be deduced by adopting b = 0.0 and the upper limit can be derived by adopting b = 1.0, which is corresponding to the classical Mohr–Coulomb failure law and Twin–Shear strength theory, respectively. Strength of material in complex stress condition will greatly increase when considering the influence of intermediate principal stress.
The parameter b is one of the key parameters for the application of the unified strength theory, and the determination methods of b constitute a difficulty for applications of the theory. Until recently, the b value could be determined from various approaches, such as element mechanics test considering complex stress path, anti-inference methods using physical experiments in combination with simulations, and others. Many researchers conducted tests on sand with complex stress condition, which indicated that the strength behavior of sand could be properly depicted adopting the unified strength theory under condition of appropriate value of b was determined. A famous test regarding value of b for the sand soil was conducted by Green and Bishop, 31 with which the value of b was suggested to be 1/2. The experimental results of Toyoura sand conducted by Nakai and Matsuoka 32 were close to the results elicited by the unified strength theory with b = 3/4. The loose and dense Ottawa sand soil was tested by Dakoulas and Sun, 33 and the value of b was, respectively, given as 1/2 and 3/4. The experimental results of Zhang and Shao 34 were situated in the region elicited by the unified strength theory with b = 1/2 and b = 1. Many investigators were devoted to predict the failure and stability characteristics of the foundation, and estimated the potential ultimate bearing capacity adopting the unified strength theory. 35 The unified strength theory has been receiving considerable attentions, and extensively applying in various fields.36–41
The unified strength theory with appropriate b could be used to maximize strength potential of a material in the case of safety assurance. Consequently, determination of the value and estimation of the influence of parameter b are significant for the application of the unified strength theory. In this research, a physical model test was carried out in combination with numerical simulations to explore the effect of b on a sand foundation loaded by a strip footing. First, an experiment was designed according to a physical model of sand foundation, and the response of stresses, deformation characteristics, and failure characteristics in the foundation were then explored. Subsequently, a simulation model which is identical to the physical model in strata structure, physical and mechanics parameters, as well as boundary conditions was built, and the effect of b was explored through the numerical simulation analysis. Finally, the appropriate value of parameter b for the experimental sand foundation was then determined by the comparison.
The unified strength theory expression
In 1991, Yu and colleagues28,29 proposed the unified strength theory. The expression can be given as follows
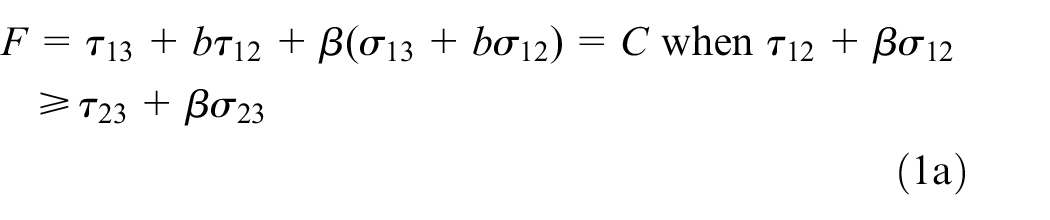
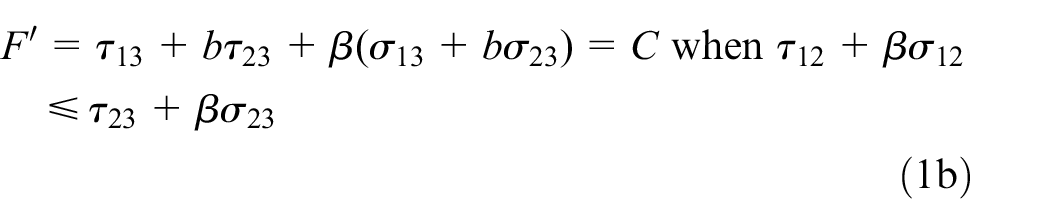
In equation (1), σ13, σ12, and σ23 are the principal normal stresses, where σ13 = (σ1 + σ3)/2, σ12 = (σ1 + σ2)/2, and σ23 = (σ2 + σ3)/2; τ13, τ12, and τ23 are the principal shear stresses, where τ13 = (σ1 − σ3)/2, τ12 = (σ1 − σ2)/2, and τ23 = (σ2 − σ3)/2; and parameters σ1, σ2, and σ3 are the principal stresses. β is the coefficient that represents the effect of the normal stresses on the yield of materials, b is a choice parameter which may be referred to as the unified strength theory parameter, and C is the strength parameter of material. Variable b is also the parameter that reflects the influence of σ2 on the yield of materials. The unified strength theory can be expressed in terms of the principal stresses, cohesive strength C0, and internal friction angle

The unified strength theory is a system, with which a series of linear convex yield criterion could be deduced and most of the sophisticated models are its special cases or approximations. The code of the unified strength theory was written using the language of C++ and the program can be called by FLAC3D, with which the influence of b on the failure of sand foundation loaded by a shallow strip footing could be explored. The failure loci of the unified strength theory are presented in Figure 1.

Failure loci of the unified strength theory.
Physical model experiment of sand foundation acted by a shallow strip footing
Physical model test design
To study the distribution characteristics of deformation, stresses, and failure zone of the foundation and determine the bearing capacity, we considered a physical model test of a sand foundation acted by a shallow strip footing. The strip footing was designed at top center of the foundation, and a uniformly distributed load of P per unit area was applied to the footing.
The dimensions of physical model experiment are generally determined according to the specific conditions of project, financial budget, geometric similarity, and so on. In this study, the focus is for the discussion of general mechanism but not for certain project. Consequently, the experiment was considered as a plane strain problem, length of the footing was designed depending on the width of foundation box, and width of footing was designed less than 1/3 length of the footing considering the influence of boundary conditions and experiment budget. The dimensions of the foundation and strip footing were, respectively, chosen as 2.4 × 1.1 × 0.55 m3 and 0.5 × 0.3 × 0.15 m3, where the sizes of 0.55 and 0.15 m are the widths of the foundation and footing, respectively. The width of testing box is a little bit larger than the length of footing, which is designed to avoid the deformation and failure of box sides due to rigid contact triggered by uneven settlement of footing under loading. The physical model box of the foundation was welded using profile steel and plexiglass. In order to provide greater stiffness, three hoops were set around the model box and, respectively, located at the top, middle, and bottom of the model box. A concrete block was used as the strip footing, and the uniform load of P was provided using four ground anchors with a jack (Figure 2).

Design of the physical model for proposed experiments.
The foundation was constructed using sand soil excavated from the Ba He river bed near Xi’an, China. Figure 3 shows the particle size distribution curve of the sand soil, from which we obtained the following uniformity coefficients


where d10 is the soil diameter at which 10% of the soil weight is finer; d30, d50, and d60 are the corresponding values at 30%, 50%, and 60%, respectively; uc is the uniformity coefficient; and Cc is the coefficient of curvature.

Particle size distribution of the experiment sand.
Orthogonal grids with sizes of 5 × 5 cm2 were signed on the longer sides of the plexiglass, based on which the foundation was designed to include 22 layers by height. Lime powder was distributed evenly over every layer, and white chalk was set at the corners of orthogonal grids with which sedimentation of the foundation soil could be observed easily. To obtain a proper density for the foundation soil, a uniformly distributed load of 5.7 kPa was achieved by applying many bags of sand on the top surface of the foundation that lasted for 48 h. After the compaction, the unit mass ρ, water content w, and internal friction angle
Two extensometers with accuracy of 0.1 mm were diagonally installed at the strip to measure the z-displacement. Three layers of pressure cells were embedded symmetrically on both sides of the axis of symmetry to monitor the states of stresses in the foundation. The pressure cells were designed along the central cross section of the foundation, and embedded vertically and horizontally to monitor the horizontal and vertical stresses, respectively. Since the horizontal additional stresses decrease significantly with the increase in depth in the foundation, the vertically embedded pressure cells were only considered in the upper two layers. The spatial position of pressure cells was determined according to the orthogonal grids on the model box combining with the foundation filling process. The pressure cells were buried by hand, contacted well by the surrounding soil, and maintained the designed dip angles by professional tools. Considering the difficult of collection pressure data wirelessly, we choose the fine wires along the short path to reduce the influence of wires. The distribution of pressure cells in the central cross section of the foundation is presented in Figure 4.

The distribution of pressure cells in the central cross section of the foundation.
The loading steps of the experiment are presented in Table 1. After the application of an incremental load, enough time was allowed for settlement to occur. When the settlement of the bearing plate became negligible, another incremental load was applied. The negligible magnitude was defined as the settlement that occurred within 30 min within a distance that was less than 0.05 mm. The loading process was finished if the soil around the footing failed, or when the settlement of the footing increased abruptly, or in the case a steady state could not be reached within 2 h.
Loading steps of the experiment.

Deformation characteristics of the foundation
A camera was set facing the longer side of the experimental box of the physical model, and a series of photos were taken to record the deformation process of the foundation under loading. On the basis of the collected photos, vertical displacements of a lime line at a certain step could be obtained by comparing the current location of the lime line and the corresponding gridline marked on the sides of the box. The deformation range in the foundation was denoted as a colored area. Depth, width, and extending process of the deformation zone in the foundation could be obtained by analyzing the characteristics of the colored areas.
Figure 5 presents the distribution of the colored areas at steps S10, S18, and S23. According to the figures, the colored areas mainly distributed at depths that ranged from 10 cm ((2/3)B) to 15 cm (1.0B) at step S10, from 10 cm ((2/3)B) to 30 cm (2.0B) at step S18, and from 0 to 110 cm (7.3B) at step S23, where the parameter B indicates the strip footing width. Obviously, the maximum deformation depth in the sand foundation increased gradually as P increased. Apparent deformation was not observed in a depth range that was less than (2/3)B in most loading steps. This finding should be attributed to the shorter of footing than the width of model box, which induced part of soil located outside the load-affected area. Furthermore, the maximum width of the deformation zone was approximately 7.0B and the colored areas observed in different steps almost distributed with a constant width. This indicated that the width of the deformation range in the experiment was much less dependent on the magnitude of the load that acted on the footing.

Distribution of vertical deformation in the foundation.
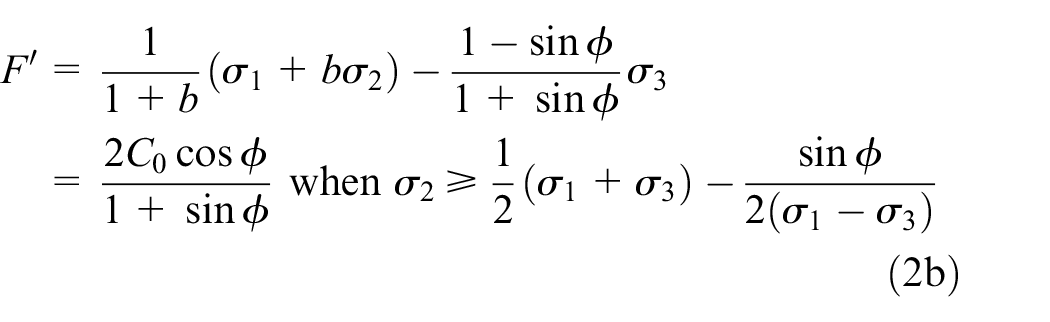
Many fissures gradually appeared on the top of the foundation during the loading. The distribution of the fissures at step S12 is presented in Figure 6. All the fissures originated from the edges of the footing and were approximately symmetrically distributed on both sides of the footing. The fissures were approximately perpendicular to the footing, and the lengths of each of the four longer fissures were approximately 45 cm (3.0B). Upward deformation phenomena on the foundation top surface were not observed during the experiment.
Fissures distributed at the sand foundation top surface.
Stresses distribution in the sand foundation
When a vertical load acted on the strip footing, additional stresses appeared in the foundation. The magnitudes and redistributions of the additional stresses had a great influence on the deformation and failure of the foundation. Figure 7 presents the variation of stresses for certain points, and Figure 8 provides the stresses distribution in the experiment sand foundation.

Variation of stresses: (a) load versus σzz and (b) load versus σxx.

Distribution of stresses in the foundation: (a) layer 1, (b) layer 2, (c) layer 3, and (d) stress diffusion angle.
According to Figure 7, the relationship of the load versus σzz was approximated as a straight line for point 19, and as a curved line for points 20 and 21, while the magnitude of σzz decreased at increasing depths. The curved line indicates that the region above the measurement point reached the plastic state and that greater stress transfer to the measuring point, which results in an abrupt increase in the curve. The straight line indicates that the region around the point may be always in an elastic state. A greater curvature magnitude generally means a closer proximity to the plastic zone. Consequently, according to the variation of the stresses, point 19 may be always sited to exist outside the plastic zone. In addition, the magnitude of σxx also decreases with increasing depths and shows fluctuation with increasing load. The fluctuation of the curves may relate to the redistribution of stress in the foundation induced by the failure of the soil.
According to Figure 8, the region of the stress redistribution increases with loading and the degree of stress concentration decreases with increasing depth. The width of the stress redistribution region on either side of the symmetry axis could be estimated to be equal to 30 cm at a depth of 25 cm, 40 cm at a depth of 38 cm, and 50 cm at a depth of 70 cm. The stress diffusion angle could be approximately determined to be equal to 65°.
The bearing capacity and failure model
Figure 9 presents the load–settlement relationship of this experiment. According to the figure, the curve was approximated as a straight line before S7 and became nonlinear after S7. The maximum curvature appeared near S21 and S22. This indicates that the first yield probably appeared at S7, and local shear failure occurred at S21 or S22. The ultimate bearing capacity might be considered as 485 kPa according to S21, 506 kPa according to S22, and 535 kPa, adopting the load–settlement curve asymptote.

Load–settlement curve of the test.
The experiment was conducted using loose sand, and an upward deformation phenomenon on the top surface of the foundation was not observed during the experiment. The load–settlement relationship of the experiment satisfied the characteristics of local shear failure. Consequently, the mode of the bearing capacity failure for the experiment should be identified as the local shear failure.
Influence of parameter b on the assessment of sand foundation
Simulation and model conditions
To analyze the influence of intermediate principal stress on stress distribution, bearing capacity, and failure characteristics of the foundation, we built a three-dimensional (3D) numerical model to carry out numerical simulations. The simulation and physic model of the study were designed same in the dimensions and strata. Consequently, the dimensions of the sand foundation and strip footing were, respectively, designed as 2.4 × 1.1 × 0.55 m3 and 0.5 × 0.3 × 0.15 m3. The sand was determined as a perfect elastoplastic material. The associated flow law and unified strength theory were used in this simulation. The calculation parameters of sand soil, including the bulk modulus (K), shear modulus (G), unit mass (ρ), acceleration of gravity (g), cohesion strength (C0), and angle of internal friction (
The strip footing was set as a rigid body. The boundary condition between the strip footing and soil mass was set as a contact interface, and properties of the interface were considered to be the same as the sand soil. The displacement boundary condition includes the normal constraints around the model sides and fixed constraint of the model bottom. A series of uniformly distributed loads of P per unit area were applied to the footing to trigger settlement of the foundation. The magnitude of the load was set to be the same as that used for the physical model experiment (Table 1).
Effect of parameter b on stress distribution
The state of stress and its redistribution are the key factors inducing the failure of the soil in the foundation, which could affect the range of the yield, magnitude of deformation, and stability of the foundation. Figures 10, 11, and 12, respectively, present the relationships of σzz, σxx, and σyy versus load P obtained adopting various b.

Relationships of σzz versus load P calculated using various b.

Relationships of σxx versus load P calculated using various b.

Relationships of σyy versus load P calculated using various b.
Figure 10 presents the curves of σzz for points 1, 21, 7, and 20, which shows that value of b significantly affects the state and redistribution of σzz for these points. For points 21 and 20, the upper bounds were generally calculated using b = 1, and the lower bounds were obtained using b = 0. This indicates that a smaller stress σzz can be calculated adopting a larger b for these points. For point 7, an opposite regularity was obtained. The influence of b on σzz of point 1 is complex, and the lower bound could be calculated using b = 1 when P < 140 kPa, and using b = 0 when P > 140 kPa. The calculated results indicate that a greater range of soil in the foundation could be considered to afford the σzz using a greater b. The values of parameters b also have a considerable influence on the distribution of σxx and σyy, and the degree of their influence increases with increasing magnitudes of load P. According to Figures 11 and 12, curves calculated using a smaller b value were generally located underneath the curves generated using a larger b value, while smaller σxx and σyy values could be calculated in general using a larger b value. The fluctuation of curves for points 20 and 21 should be induced by the redistribution of failure zone above these points.
Consequently, b has a considerable effect on the distribution of stresses in the sand foundation. In general, a greater b value could be used to obtain a smaller magnitude for σxx and σyy, and to allow a broader range of soils to share σzz.
Influence of b on the assessment of bearing capacity
To compare with the sand foundation physical model test, we carried out a series of numerical simulations, and a series of load–settlement curves using various values of parameter b was obtained, as presented in Figure 13. According to the figure, a load–settlement curve calculated using a larger b value generally showed a higher load of knee point. The ultimate bearing capacities of the sand foundation were determined based on the knee points of the computational load–settlement curves, which were, respectively, obtained as 115, 178, 280, 415, and 540 kPa, corresponding to b = 0.00–1.00, respectively. Figure 14 shows the relationship of calculated ultimate bearing capacity versus parameter b. The results indicate that bearing capacity of the sand foundation increases linearly with the increase in b, and an increment about 470% can be calculated using b = 1.0 more than b = 0.0.
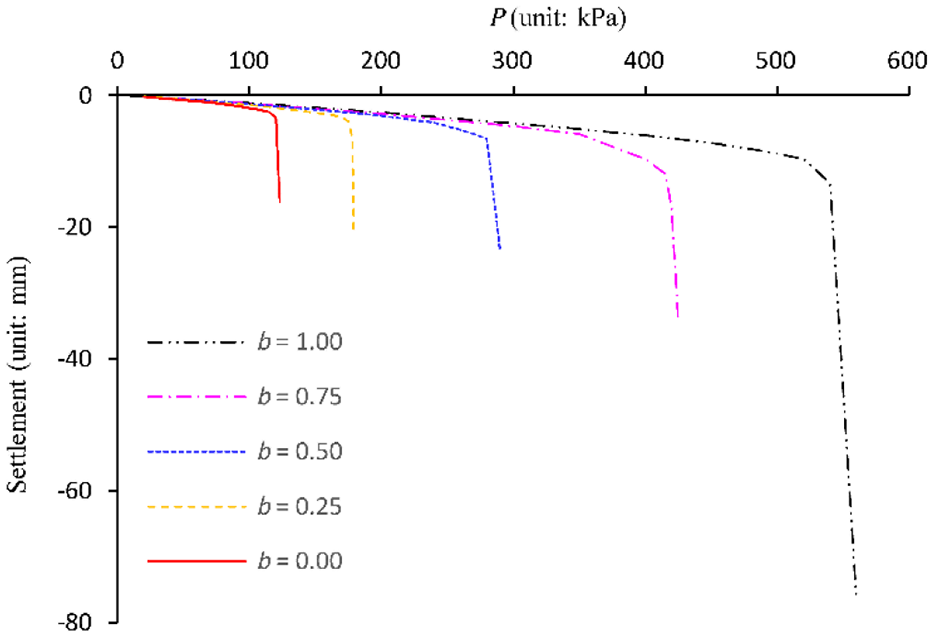
Relationships of load P versus settlement.

Variation of bearing capacity versus value of b.
Based on the relationships of load P versus settlement curve of the test, the ultimate bearing capacity of the experimental model was comprehensively analyzed to be in the range of 485–535 kPa, which is consistent with the simulated result using b = 0.89–0.99, and shows an increase in 420%–465% compared to the results of b = 0.00.
Influence on failure characteristics of the foundation
The developments and distribution of the failure zone are generally dominated by the state of stresses, and then further affect the redistribution of stresses in the foundation. Consequently, failure characteristic of the foundation soil is a dominant factor which could be used to assess the foundation stability. In general, a foundation with a larger failure zone indicates a more unstable state. The failure of sand foundation loaded by a strip footing was studied, based on which the effect of b was then explored.
Figure 15 presents the variation of the failure zones in the experimental sand foundation, which were calculated, respectively, using the unified strength theory with b = 0.0, b = 0.5, and b = 1.0 under the load conditions of P = 60, 120, 180 kPa, and P = Pult, respectively. In case of P = 60, 120, and 180 kPa, the calculated results show that the inner and outer yield boundaries were, respectively, obtained using b = 1 and b = 0. In contrast, the calculated results of P = Pult present an opposite regularity. The computational results indicate that a smaller failure zone of the sand foundation under a certain constant load P could be obtained using a larger b value if P < Pult, but a greater failure zone would be calculated using a larger b value under the condition of P = Pult. Consequently, a broader range of soils was considered to share the load when a larger b value was adopted, which might be the reason for the greater bearing capacity calculated using the larger value of parameter b.

Distributions of the sand foundation failure zones for various values of parameter b.
Discussion
In this research study, the selection of appropriate parameter b for the sand foundation was used in combination with the physical experiment model and numerical simulations to determine its influence on the sand foundation that supported a strip footing under loading. Findings were consistent with results published in the previous literature.31–34 However, b is a mechanics parameter of material which could be dominated by the structure of soil, unit mass of sand, particle size distribution, pore ratio, saturation degree, mineral composition, and so on, and it may thus vary from sand to sand. In addition, the results were obtained from a simplified physical model, and the applicability to an actual engineering construction with complex foundation strata, structure of footing, load, and displacement boundaries is envisaged to be studied in the future.
Nevertheless, a greater bearing foundation capacity could be calculated using the unified strength with a greater parameter b, with which a higher potential failure and instable risk of the foundation may be induced. Consequently, a tradeoff between instable risk and construction cost savings for a foundation engineering can be further evaluated based on a careful parametric study. A combination of the hollow cylindrical torsional shear tests or true triaxial tests for the element samples, and physical model experiments and numerical simulations for the engineering with detailed boundary conditions, as well as risk assessments considering the variation of expected environment, is recommended for the actual engineering to determine the appropriate parameter b. Consequently, the unified strength theory with appropriate value of b could be employed in the sand foundation engineering to take full advantage of foundation soil strength and to reduce the foundation treatment cost greatly.
Conclusion
The unified strength theory could deduce to various formations of convex linear strength theories at various b values. The calculated bearing capacity value and failure range of the sandy foundation which was acted by a strip footing under loading depended on the value of parameter b significantly. According to the experiment and analysis results, the effects of parameter b on the experimental sandy foundation could be summarized as follows:
The calculated ultimate bearing capacity for the experimental sandy foundation increased linearly with parameter b. An increment about 470% could be obtained using b = 1.0 relative to b = 0.0.
Value of b affected the distribution of stresses in the sandy foundation greatly. In generally, a greater b can be adopted to calculate a smaller σxx and σyy, and to allow a broader range of soils to share the stress σzz.
Under the condition of P < Pult, the failure zone calculated using larger parameter b is broader, but in the case of P = Pult, the opposite conclusion can be obtained. The results indicated that a broader range of soils was considered to share the load when a greater b value was adopted, which might constitute the reason of the larger bearing capacity calculated using the larger b value.
The bearing capacity of the given sandy foundation determined according to the load–settlement curve of the physical model experiment was consistent with the results calculated using b = 0.89–0.99, which shows an increase in 420%–465% relative to the result of b = 0.
Up until the present, few research studies adopting the large-scale physical model tests to explore the influence of strength theory. In this article, the unified strength theory was extended and applied to assess the stability of sand foundation adopting the physical model experiment and numerical simulation, with which the influence of strength theory on the deformation characteristics, stress field, plastic strain, and bearing capacity of the foundation was determined. On this basis, the range of unified strength theory parameter b for the sand foundation under a strip footing was recommended. The research could pave way for the application of the unified strength theory in the field of foundation engineering, and provide typical case study for the influence of strength theory on evaluation of stability and bearing capacity of the foundation.
Footnotes
Acknowledgements
The authors thank the National Natural Science Foundation of China which sponsored the research.
Handling Editor: James Baldwin
Data availability
The data used to support the findings of this study are included within the article (Figures 2–15).
Declaration of conflicting interests
The author(s) declared no potential conflicts of interest with respect to the research, authorship, and/or publication of this article.
Funding
The author(s) disclosed receipt of the following financial support for the research, authorship, and/or publication of this article: This study was sponsored by the National Natural Science Foundation of China (grant numbers: 41877245 and 41630634).