
Abstract
Fatigue cracks developed on subway train bogie frames before reaching the designed lifetime, which poses great challenges to operational safety. This article presents a structural fatigue reliability assessment method combining both the in-service measurement of dynamic stress and probabilistic approach for lifetime prediction. It was found that curved interval with rail corrugation can induce the elastic vibration and the modal stress on the frame, which caused the accelerated accumulation of the fatigue damage. The predicted failure mileage for the welding joint with 99% reliability was only 340,000 km, which agreed well with the real operation situation.
Introduction
Recently, there have been a lot of studies on fatigue life prediction and reliability assessment of engineering structures under multiaxial loading such as pressure vessels, compressor discs and turbine blades using multiscale and probabilistic approaches.1–3 As for railway transportation, bogie frame is the key component of the railway vehicle and its fatigue performance is the most safety-critical subject. Welding is widely used in the manufacturing process of bogie frames to join different parts. The large passenger volume and frequent usage of railway vehicles in metropolitan transport pose stringent requirements on safety and fatigue reliability of key welded joints. The design of bogie frames is undertaken according to international technological standards in order to ensure its safety. The motor hanger is joined with the crossbeam of a bogie frame with a non-typical weldment as shown in Figure 1. During the service, the fatigue cracks were found in this weldment on a subway bogie frame at as early as 400,000 km of operation, which is far below the expected lifetime of 3,600,000 km. The contradiction between the safety design of key welded components based on standards and early failure under real operating conditions was also reported in other types of railway vehicles. Lucanin et al. 4 found that the anti-fatigue design of a bogie frame in diesel multiple units based on UIC (International Union of Railways) standard cannot satisfy the operational safety requirement. Younesian et al. 5 concluded that lowering track grade and increasing operation speed can significantly shorten the fatigue lifetime of bogie frames used in passenger trains. Therefore, a reliable fatigue performance assessment method based on real operating conditions is required for the development of new products and can also provide a basis for scheduling the periodic frame maintenance for current vehicles.

Fatigue cracks on a bogie frame.
Structural fatigue reliability assessment methods mainly include the numerical simulation analysis and experimental fatigue test. The fatigue strength of bogie frames under random loads was investigated by introducing the elasticity of the car body and the bogie frame in a dynamic model of the vehicle system.6–8 The dynamic load characteristics could be obtained on either the frequency domain or the time domain and the fatigue life of a bogie frame can be predicted numerically. 9 The influence of structural vibrations on the fatigue strength of a bogie frame was studied with the modal superposition method. 8 The cumulative damage of the inspected area was calculated using the generated stress spectrum and Palmgren–Miner rule. The fatigue resistances of typical welding connections of a bogie frame were experimentally investigated under simplified loading conditions.10,11 To overcome the intensive cost in the durability fatigue test for a full-scale bogie frame, an accelerated load spectrum was compiled based on the principle of consistent failure mechanism and the measured accelerated damage was extrapolated to the total service life by comparing with the finite element method (FEM) computation. 12 The probabilistic designing in engineering application has been an increasingly tendency.13–16 The dynamic stress of the bogie frame usually consists of the contribution from the elastic vibration of the frame structure under the wheel–track excitations and the resulted damage at critical areas presents probabilistic characteristics. Therefore, a reliability assessment method considering the probabilistic characteristics during the real operation is required.
In this study, a structural fatigue reliability assessment method combining both the in-service measurement of dynamic stress and probabilistic approach for lifetime prediction was proposed. We performed a long-term test of the bogie frame during the service to measure the dynamic stress time history in the failure area. The damage accumulation behaviours under various operating conditions were investigated to identify the causes of early fatigue failure. A lifetime prediction model based on the probabilistic characteristics of the measured operating conditions was used to calculate the fatigue life of the welding joint of the motor hanger.
In-service measurements
Because damage is exclusively caused by stresses acting locally on the critical area, the local service stress must be measured to assess such damage. The knowledge of actual failure locations, as shown in Figure 1, allowed the application of strain gauges (3-HD5 and 3-HD6) in the critical areas between the motor hanger and the crossbeam as shown in Figure 2. Four strain gauges (3-ZH1, 3-ZH2, 4-ZH1 and 4-ZH2) were located on the crossbeam to measure the deformation state of the frame under operating conditions. The dynamic vertical excitation from the running track was measured by an acceleration sensor equipped on the axle box. The vehicle speed was recorded with a speed radar and the horizontal shake was measured with a gyroscope. The instrumented bogie frame was installed on the second bogie position of the second passenger coach as shown in Figure 2. In order to eliminate the impact on stress and vibration measurements from the wheel polygonalization, the wheel profiling was carried out as scheduled. The wheel profiles of the instrumented bogie are shown in Figure 3.

The passenger coach and the instrumented bogie frame.

The wheel profiles of the instrumented bogie after wheel profiling.
The vehicle run through a circular line of 18 stations as shown in Figure 4. The track consisted of an inner circle and an outer circle. Each circle track can be divided into 14 straight segments and 4 curved segments, as shown in Figure 3. The data acquisition equipment was installed below the vehicle and all test data were automatically stored in the equipment in real time when the vehicle was running. The sampling frequency of the stress data was 1000 Hz, while that of the acceleration data was 2000 Hz.

The schematic of running routes.
The test lasted over 1 year continuously and the accumulated testing mileage was 87,000 km. The collected data covered full operating conditions, which included inbound, outbound and main track operations.
Reliability assessment
Among common probabilistic analysis models, normal, exponential and Weibull distributions are widely applied in the reliability assessment of an engineering structure, due to their simple and monotonic failure rates. With the development of structural variety, accompanied by the complex fatigue life characteristics, the failure rate function presents other types of features, such as inverted bathtub type and roller type. 17 The exponential–Weibull distribution can be used to represent the complex life data characteristics.18,19 The probability density function of the three-parameter exponential–Weibull distribution was used in this study and it can be expressed as follows
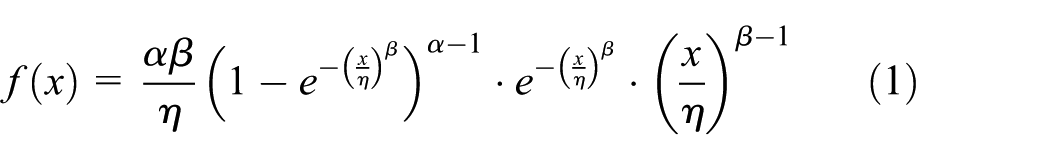
where α and β are the shape parameters and
The daily stress spectrum of a measuring point can be obtained by applying the rainflow counting method. Then the fatigue damage of the measuring point j on the day d can be calculated as
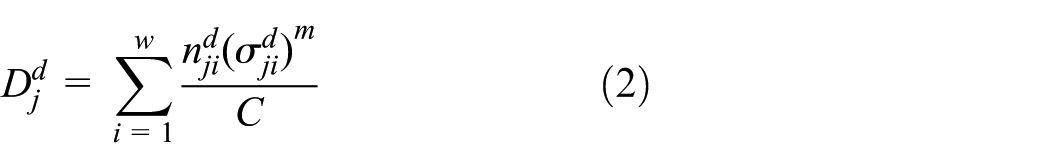
where
The fatigue life of the measuring point j can be estimated as

where
Based on the fatigue life

Results and discussion
Equivalent stress amplitude along with the test mileage
The equivalent stress amplitude for a measuring point on a bogie frame can be obtained from the stress spectrum by applying Miner’s law based on the S–N curve of the welded joint as follows20,21

where
Table 1 lists the variation of the equivalent stress amplitudes of 3-HD5 and 3-HD6 along with the test mileage. It can be seen that the stress amplitude of 3-HD5 is larger than that of 3-HD6, which indicates a higher failure risk at the position of 3-HD5. With the accumulation of test mileage, the stress values increase slightly. When the test mileage reaches approximately 60,000 km, the increasing rate of the equivalent stress amplitude becomes stable, which indicates that the test mileage is long enough to fully cover the typical operating conditions.
The variation of equivalent stress amplitude along with the test mileage.

According to the loads specified in EN13749, the equivalent stress amplitudes of 3-HD5 and 3-HD6 were calculated as 43.1 and 63.5 MPa, respectively. These values are much smaller than the values measured during the service. This means that a safe fatigue assessment cannot be guaranteed by EN13749 and a reliability assessment based on the measurement during the real operation is required.
Equivalent stress amplitude for each interval
When the vehicle was running through all stops on inner and outer circles, the bogie frame experienced the history of all states. In order to compare the fatigue damage under different travelling conditions so as to find the reason for the fast accumulation of fatigue damage, we segregate the data according to intervals between stations and calculate the equivalent stress amplitude for each interval.
As shown in Figure 3, each circle track can be divided into 14 straight segments and 4 curved segments. The calculated equivalent stress amplitudes of the measuring point 3-HD5 for each interval are shown in Figures 5 and 6 for the inner and outer circles, respectively.

Equivalent stress amplitude of 3-HD5 for each interval on the inner circle.

Equivalent stress amplitude of 3-HD5 for each interval on the outer circle.
From Figures 5 and 6, we can see that different equivalent stress amplitudes resulted from different station intervals, which indicates that the route condition differs from each other. The minimal equivalent stress occurred in the B–C interval, which was less than 40 MPa. Stresses on curve intervals are generally larger than those on straight-line intervals. The mileage of the track where the equivalent stress is larger than 70 MPa can be more than half that of the route. The equivalent stress amplitude can also be different on different circles. For example, the equivalent stress of 3-HD5 is between 90 to 110 MPa on the J–I interval of the outer circle, while the equivalent stress is over 140 MPa for the same interval of the inner circle. This is because the bogie was used as a guiding bogie when the vehicle was running on the inner circle.
Dynamic characteristics of the bogie frame
Figure 7 shows the typical measured signal when the bogie is used as the guiding bogie on the I–J interval of the inner circle. This part of the vehicle service represents the severest operating condition for the bogie frame. From top to bottom, the figure shows the axle box vertical acceleration, angular velocity of horizontal shake, vehicle speed and the stress signal of the measuring point 3-HD5, respectively. From this figure, we can see that there is a strong correlation between the axle box vertical acceleration and the stress measured at the welded joint between the motor hanger and the crossbeam of the bogie frame. The dynamic excitation from the wheel–rail interaction is mainly from two sources, that is, the impact from the rail joint and the rail corrugation. When the vehicle was running at a constant speed on the straight segment, the wheel–rail excitation was mainly from the rail joint. When the vehicle was running on the curved segment, the wheel–rail excitation from rail corrugation is much larger than that from the rail joint. The maximum vertical acceleration of the axle box can reach approximately 200g.

Measured signals when operating on curved interval I-J of inner circle.
The signal including the largest wheel–rail excitation on the curved segment is shown in Figure 8 and the Fourier analysis result of this signal is shown in Figure 9. The main frequencies for the axle box vibration and the stress of the measuring point 3-HD5 are 74 and 47 Hz, respectively. As the constant speed was 45 km/h, it can be calculated that the rail corrugation is about 169 mm in wavelength. The existence of the excitations of high frequency contradicts with the quasi-static design rule in the standard in which it usually assumes that the loads and deformation of the frame are within the low frequency range.

Signal from the largest wheel–rail impact.

Fourier analysis.
Figure 10 shows the first-order mode of elastic vibration of the bogie frame. The deformation mode is that the two side beams nod in opposite directions, while the two crossbeams bend in opposite directions. The corresponding frequency is 46.9 Hz. The measured stress signals from 3-ZH1 and 4-ZH1 were filtered with a 46- to 48-Hz band pass filter and the results are shown in Figure 10. The resulted waveform indicates that 3-ZH1 and 4-ZH1 have a tensile and a compression deformation at the same frequency, respectively, while the deformation directions of 3-ZH1 and 4-ZH2 are the same. It demonstrates that the elastic vibration experienced by the bogie frame during operation fits well with the first-order elastic mode.

First-order elastic mode and the corresponding stress waveform for crossbeams of the frame.
The results show that, in the curved interval, the elastic vibration caused by rail corrugations resulted in modal stress, which consequently caused the accelerated accumulation of fatigue damage. Figure 11 shows the typical measured signal when the bogie is used as the guiding bogie on the B–C interval of the inner circle. Distinct from the operation in curved intervals, the acceleration amplitude of axle box reduces significantly. Wheel–rail excitation peaks appear at every 1.2 s which corresponds to a rail length of 25 m for the vehicle speed of 75 km/h. Therefore, it can be concluded that the wheel–rail excitation in this interval was mainly attributed to the rail joint. Due to the fact that the frame stress signal does not show significant elastic vibration effect, it can be concluded that the rail joint impact cannot lead to modal stress in the frame.

Measured signals when operating on a straight-line interval B–C.
Therefore, route condition posed a significant influence on the bogie frame fatigue damage. In curved intervals, corrugation was the direct cause for accelerated fatigue accumulation. On the other hand, the fatigue damage caused by rail joint was not evident.
Reliability assessment results
Based on the fatigue life
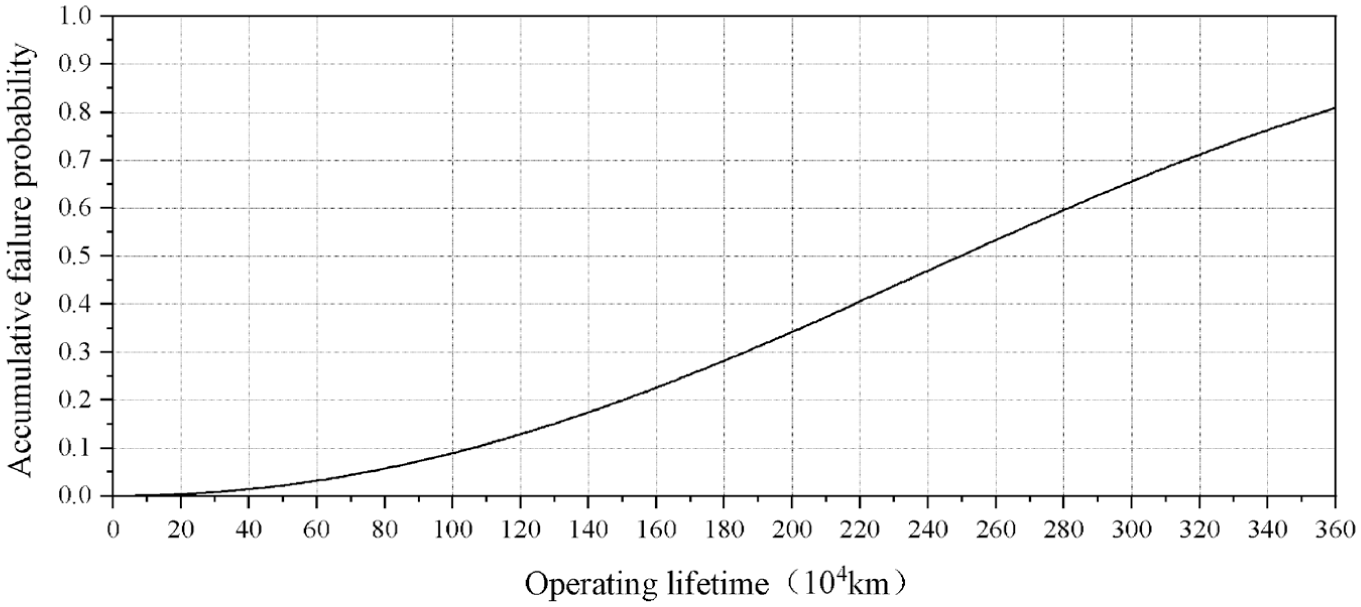
The accumulative failure probability function of the measuring point 3-HD5.
It can be seen from Figure 12 that the lifetime with 99% reliability is about 340,000 km, which agrees well with the failure mileage found in the real operation. The lifetime with 50% reliability is 2,490,000 km, which is only 19% of the designed lifetime of 3,600,000 km.
Based on the fatigue life result shown above, the maintenance schedule can be determined according to the operating mileage of the bogie frame and the specified reliability. For a newly manufactured bogie frame, in order to guarantee the reliability of 99%, the operation of the vehicle must be interrupted at the mileage of 340,000 km for maintenance.
Conclusion
The welding joint between the motor hanger and the crossbeam of the metro vehicle bogie frame was found to experience early failure during the operation even though it passed the fatigue evaluation according to technical standards. In this article, a method combining both the in-service measurement and the probabilistic approach for lifetime prediction was developed to assess the structural fatigue reliability. A long-term test of the bogie frame during the service was conducted to measure the dynamic stress time history in the failure area. The accelerated accumulation of fatigue damage of the bogie frame was caused by elastic vibration in the frame in curved intervals of the track. The lifetime prediction result based on the probabilistic characteristics of the measured data agrees well with the operation record and can be used to determine the maintenance schedule of the welding joint of the motor hanger.
Footnotes
Handling Editor: James Baldwin
Declaration of conflicting interests
The author(s) declared no potential conflicts of interest with respect to the research, authorship and/or publication of this article.
Funding
The author(s) disclosed receipt of the following financial support for the research, authorship, and/or publication of this article: This work was supported by the Major Program of the National Natural Science Foundation of China (Grant No.: 11790281).