
Abstract
In this article, design optimization was carried out to improve the suction performance and efficiency of a mixed-flow pump impeller. Commercial computational fluid dynamics code and a response surface method were used in the optimization to design a mixed-flow pump impeller. When it comes to a mixed-flow pump, the two main research objectives namely efficiency and suction performance tend to contradict. It is very important that the design technology improves the suction performance while maintaining high efficiency. Meridional plane and vane plane development variables were defined in the design of the impeller. The meridional plane expresses the shapes and sizes of the blades, while the vane plane development describes the impeller inlet and outlet angles as well as the blade angle distribution. The blade angle distribution of the impeller was designed using the traditional method by which inlet and outlet angles are connected smoothly. The surface response method was applied to the design variables of the impeller inlet part in this design optimization because they influence the performance of the mixed-flow pump. Objective functions were set to satisfy the total head at the design flow rate as well as to improve efficiency and suction performance. Design variables of the impeller inlet part of the mixed-flow pump and the changes in performance were analyzed in order to produce the optimal shape. The performance of the optimally designed shape was verified by numerical analysis, and the reliability of the test result was checked by comparative analysis against the reference model.
Keywords
Introduction
A pump is a mechanical device that transfers fluid by transforming kinetic energy, created by the rotation of an impeller, to pressure energy. Pumps are widely used in industrial and domestic settings already, but the importance of their efficiency has increased more than ever to save energy due to the rising price of oil.1,2
Abnormal events such as “cavitation” can occur while a pump is working if the pressure around the pump inlet changes over time with changes in the fluid level. When the fluid pressure decreases, bubbles are generated and the suction performance of a pump decreases. This makes it essential to have a technique of designing pumps with high suction performance. 3
When it comes to mixed-flow pumps, improvement in efficiency, and suction performance, the two biggest research objectives tend to be conflicting. A design technique in which suction performance is improved while the efficiency is kept high is of utmost importance, but much more experience is needed at this stage. Efficiency and suction performance are the main performance factors in mixed-flow pumps, putting manufacturers who have secured hydraulic power design at an absolute advantage. Therefore, studies are being conducted in order to enhance the efficiency and suction performance of pumps.
In order to increase suction performance of mixed-flow pump impeller, Oh has studied performance variation depending on changes in impeller shapes in mixed-flow pumps, while Kim et al.4,5 have used optimization techniques and computational fluid dynamics (CFD) in order to enhance the efficiency and suction performance of impellers in mixed-flow pumps.
Research on pump design to improve the performance of pumps has also been carried out using CFD and optimization techniques. Kim et al. carried out design optimization of the impeller and volute of a centrifugal pump using optimization techniques and CFD. Blade angles and the meridional plane were designed for the impeller and cross-section distribution was designed for the volute. 5 Huh et al. carried out design optimization of the impeller and diffuser of a mixed-flow pump using optimization techniques and CFD. Performance depending on the shapes of the impeller and diffuser was analyzed and the shape with improved performance was selected because impeller and diffuser designs with enhanced performance are important. 6
Research on pump flow analysis has also been carried out using CFD. Liu et al. carried out cavitation analysis using large eddy simulation. 7 Lei et al. 8 carried out cavitation analysis of a centrifugal pump at off-design conditions using unsteady analysis. Tan et al. 9 carried out internal flow analysis of a centrifugal pump at off-design conditions using unsteady analysis.
In this study, a mixed-pump impeller that satisfies the total head at the design flow rate and enhances efficiency and suction performance was optimally designed. In order to conduct this research, the performance of the reference model was verified using numerical analysis and the results of experiments were used for comparison.
The design of the meridional plane and the blade angle distribution are the two main areas to be considered in research on impeller design. Vane plane development was used in the designing of the impeller blade. Design variables that control the impeller meridional plane and the vane plane development were defined in order to optimally design the impeller. Optimization of the impeller was carried out using a traditional method of design and a response surface method (RSM). The performance of the optimized impeller was verified through numerical analysis and experiments and these were compared with those of the reference model.
Design method for the mixed-flow pump impeller
The impeller is very important component of mixed-flow pump and it changes kinetic energy of fluids into pressure. The fluid introduced into the impeller receives kinetic energy from rotating blades and this turns into pressure energy in the impeller and the diffuser. In order to design a mixed-flow impeller with enhanced efficiency and suction performance that simultaneously satisfies the pump design specifications, various design techniques are required, from the basic design stage all the way through to the detailed design stage. When it comes to design techniques, fluid dynamics is essential in order to enhance the performance of mixed-flow pumps.
Figure 1(a) shows the three-dimensional shape of a mixed-flow pump impeller. In order to express the impeller shape, which is the main component of a mixed-flow pump, information about the meridional plane in Figure 1(b) and the front plane in Figure 1(c) is needed. The meridional plane and the front plane are expressed in cylindrical coordinates. Vane plane development, as shown in Figure 1(d), could be developed using the information on meridional and front planes.10,11

Traditional impeller design method: (a) three-dimensional impeller shape, (b) meridional plane, (c) front plane, and (d) vane plane development.
The meridional plane describes the basic shapes of the blades and shows information on R and Z in cylindrical coordinates. The front plane expresses the blade angles and shows R, θ information in cylindrical coordinates. Design of the meridional plane is the most basic design when it comes to impeller design as it expresses in/outlet diameter of the blades and the shapes of the hub and shroud. In the traditional approach, relying on empirical aspects, the meridional plane is designed simply by connecting diameter, hub, and shroud of the in/outlet of blades smoothly using an arc curve. Design of the blade angle distribution is decided by the in/outlet flow angles based on pump design theory. Sweep angle, which is related to blade angle distribution, is simply designed by connecting the inlet and outlet angles smoothly when the angles are defined.
Design variables of the meridional plane and vane plane development were defined to optimally design a mixed-flow pump with enhanced efficiency and suction performance. Design optimization was conducted on the previously defined design variables. Performance variations according to the impeller design variables were analyzed using the main effects plot, and design optimization was carried out on the main design variables of the impeller using an RSM. Table 1 shows the design specifications. Specific speed (r/min, m3/min, m) of impeller from mixed-flow pump is 250.
Design specifications.

Design variables of the meridional plane
Figure 2 shows the design variables of the impeller meridional plane. R shows the impeller radius and Z shows the length of the axis. Φ shows inclination of the inlet and outlet parts of the meridional plane and b shows the width of the meridional plane. Here 1 means the inlet part while 2 means the impeller outlet part. The hub is displayed as h here while s means the shroud.

Design variables of meridional plane for the impeller.
A Bezier curve was used in designing the curve on the meridional plane of the impeller. The Bezier curve connects points using a control point when inclinations are given. The control point that regulates the Bezier curve was defined to be %CP. Control points of the impeller inlet and outlet were defined to be %CP1 and %CP2, respectively. Inclination of the curve on the meridional plane of the impeller was defined to be θ2 while the length of the straight part of that curve was defined to be %L. 12
Design variables of vane plane development
Figure 3 shows the design variables of vane plane development of an impeller. ΣdM in the figure means the length of the curve on the meridional plane. %β1 and %β2 show identical sections of the blade angle at the inlet part and outlet part and are expressed as percentage against the y-axis of the vane plane development. β1 describes the inlet angles of the impeller and blade while β2 shows the outlet angle of the impeller blade. dθ shows the difference in sweep angles. Blade angle distribution was designed by connecting the inlet part and outlet part smoothly. Here, h means hub, m means the middle section, and s means shroud. 12
Design variables of vane plane development for the impeller.
Numerical analysis method
Commercial CFD code ANSYS CFX-17.1 was used for inner fluid analysis of a mixed-flow pump impeller. The three-dimensional shape of the impeller was generated using the ANSYS CFX-BladeGen program, and the impeller grid system was generated as a structured grid system using ANSYS CFX-TurboGrid. 13
The number of impeller vanes is 5 but numerical analysis was conducted on only one blade section using a periodic condition. Because numerical analysis was done only on the impeller shape, the inlet part of the impeller was illustrated as the shape of a straight pipe while the exit part was illustrated simply as a diffuser meridional shape without vanes. 14 A grid test was carried out to increase the reliability of the outcome of the numerical analysis and the results of the numerical analysis were steady on about 500,000 nodes. Figure 4 shows the results of the grid tests on the mixed-flow pump impeller.

Results of grid dependency test for the impeller.
A three-dimensional Reynolds-averaged Navier–Stokes equation was utilized in order to analyze the incompressible turbulent flow inside the impeller. When it comes to the analysis of turbulent flow through the impeller, shear stress transport (SST) model was used as a turbulent model as it anticipates flow separation very well.15,16
A simple periodic calculation domain is suitable for steady cavitation prediction rather than full flow passage with a component of recovering static pressure. The former has better convergence, less time spent, and fewer resource requirements on engineering applications. Furthermore, the single passage of impeller with diffuser has a tendency to over-estimation in the steady simulations of cavitation prediction. 17
The impeller without tip clearance has less resource requirements, better convergence, and lower time consumption. When considering tip clearance in two-phase flow, the overall resource requirements increase and the convergence deteriorates with increasing number of grids near the shroud. 18
Figure 5 shows the boundary condition of the mixed-flow pump impeller. A rotational condition was used as the impeller is a rotating shape. Atmospheric pressure was given to the impeller inlet part while mass flow rate was given to the outlet part. 19 Water was used as a working fluid. Disk friction loss, mechanical loss, and loss due to leak and tip clearance effects were not included in the results of the numerical analysis.

Boundary conditions and grid system for the impeller calculation.
Validation of the reference model
The reference model is an optimally designed model with improved efficiency from a previous study. The performance of the reference model has been verified through experiments and CFD. Figure 6 illustrates the experimental apparatus for the pump performance test and Figure 7 shows a schematic diagram of the experimental apparatus. 20 The experimental apparatus for the pump consists of a reservoir, a pressure gauge, an electromagnetic flow meter, a flow control valve, and a torque meter. The electronic motor that was connected to the experimental pump was controlled by an inverter. The range and uncertainty of the main measurement device are displayed in Table 2.

Experimental apparatus of pump performance.

Schematic diagram of experimental apparatus for pump performance.
Specifications of a measurement device.

The performance curve of the reference model was verified using CFD and experiment. Figure 8 shows the comparison of CFD and experimental result of the reference model. Figure 8(a) shows the comparison of total head curve from numerical analysis and experimental result while Figure 8(b) shows the comparison of total efficiency curve. Diffuser loss is confirmed when the results of impeller CFD and the result of impeller and diffuser CFD are analyzed. The result of performance experiment for the reference model includes impeller and diffuser. In Figure 8, CFD result of the impeller and diffuser is similar to the performance curve of performance test result. In Figure 8(c), the net positive suction head (NPSH) curves show similar tendencies between the results as well. However, the result of the experiment was lower than that of numerical analysis because numerical analysis does not take account of diffuser loss, bell mouth effect, tip clearance effect, disk friction loss, or leakage loss. In Figure 8, the tendencies are similar in the performance curves of the result of numerical analysis and that of the experiment on the reference model. Therefore, the result of the reference model can be trusted.

Comparative analysis of the performance evaluation for reference model (experiment vs numerical analysis): (a) performance evaluation of the total head, (b) performance evaluation of the total efficiency, and (c) performance evaluation of the cavitation coefficient.
Optimum design of mixed-flow pump impeller
A mixed-flow pump impeller was optimally designed using an RSM. The objective of RSM is to find optimal conditions of the design variables to enable the response variables to be optimized. The correlation between the main design variables and response variables was analyzed using RSM. The purpose of RSM analysis is to determine optimal conditions of the main design variables that would give optimal values of the response variables. 21
Experiment sets were generated by applying central composite designs to the main design variables that affect the response variables. Figure 9 illustrates the procedure of design optimization to which the RSM was applied. In order to improve the total efficiency and suction performance of the mixed-flow pump impeller, the design variables were selected to easily control the inlet part of the impeller.

Optimization flow chart.
R1_s, Z_tip, iβ1_h, and iβ1_s were selected as the main design variables of the impeller. R1_s is shroud radius of impeller inlet and Z_tip represents the length of the axis of the impeller. iβ1_h and iβ1_s are the incidence angles of the hub and shroud, where incidence angle means the difference between inlet angle and flow angle. The shapes of the experiment sets depending on the four main design variables were verified by numerical analysis. Table 3 shows the arrangement of the central composite method.
Response surface method set.
The objective function for the optimal design of a mixed-flow pump is to satisfy the total head at the design flow rate while maximizing efficiency and minimizing suction performance. Suction-specific speed is calculated by Required Net Positive Suction Head (NPSHre), flow rate, and revolutions per minute (RPM). Here, NPSHre is the NPSH at the point where the total head drops by 3%. Figure 10 shows the total head and efficiency curve and Figure 11 shows the NPSH curve. The equations of total head, efficiency, and NPSH are as follows


Total head and total efficiency curves for response variable.
NPSH curve.
The main effects plot was used to analyze changing performance according to variations of design variables. Figure 12 shows the main effects plot of the total head. Total head increases as Z_tip and iβ1_h increase in Figure 12. However, R1_s and iβ1_s had their highest total head at 3.5% and 4°, respectively. Figure 13 shows the main effects plot of efficiency. Efficiency increases as iβ1_h increases in Figure 13. Contrarily, R1_s and Z_tip have to decrease for efficiency to increase. iβ1_s has a highest total head at about 4°. Figure 14 shows the main effects plot of NPSHre which increases as iβ1_s increases. However, NPSHre is lowest when R1_s and Z_tip are about 3.5%; iβ1_h is about 6% and at 2°.

Main effects plot for total head.
Main effects plot for total efficiency.
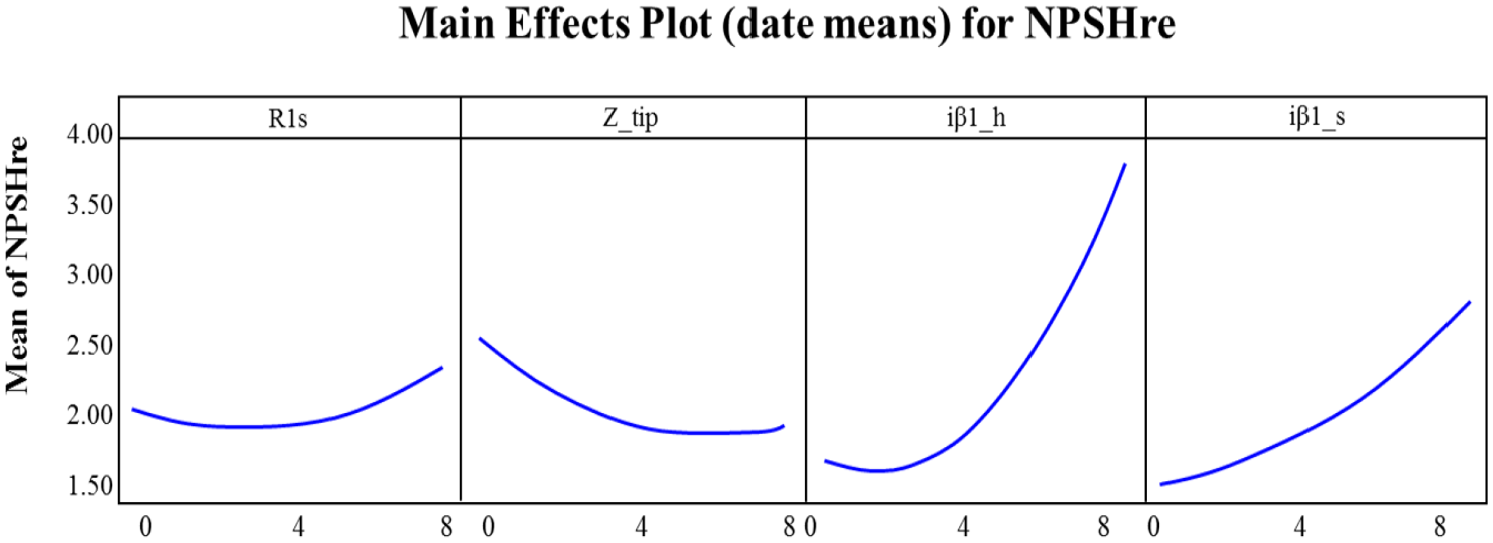
Main effects plot for NPSHre.
Figure 15 shows the response optimization plot. Response optimization was carried out using regression analysis. The estimate equation of regression analysis is as follows. Regression analysis is a statistical process used to anticipate the correlation between variables. The regression analysis is shown in equation (4)

where X indicates the design variables,
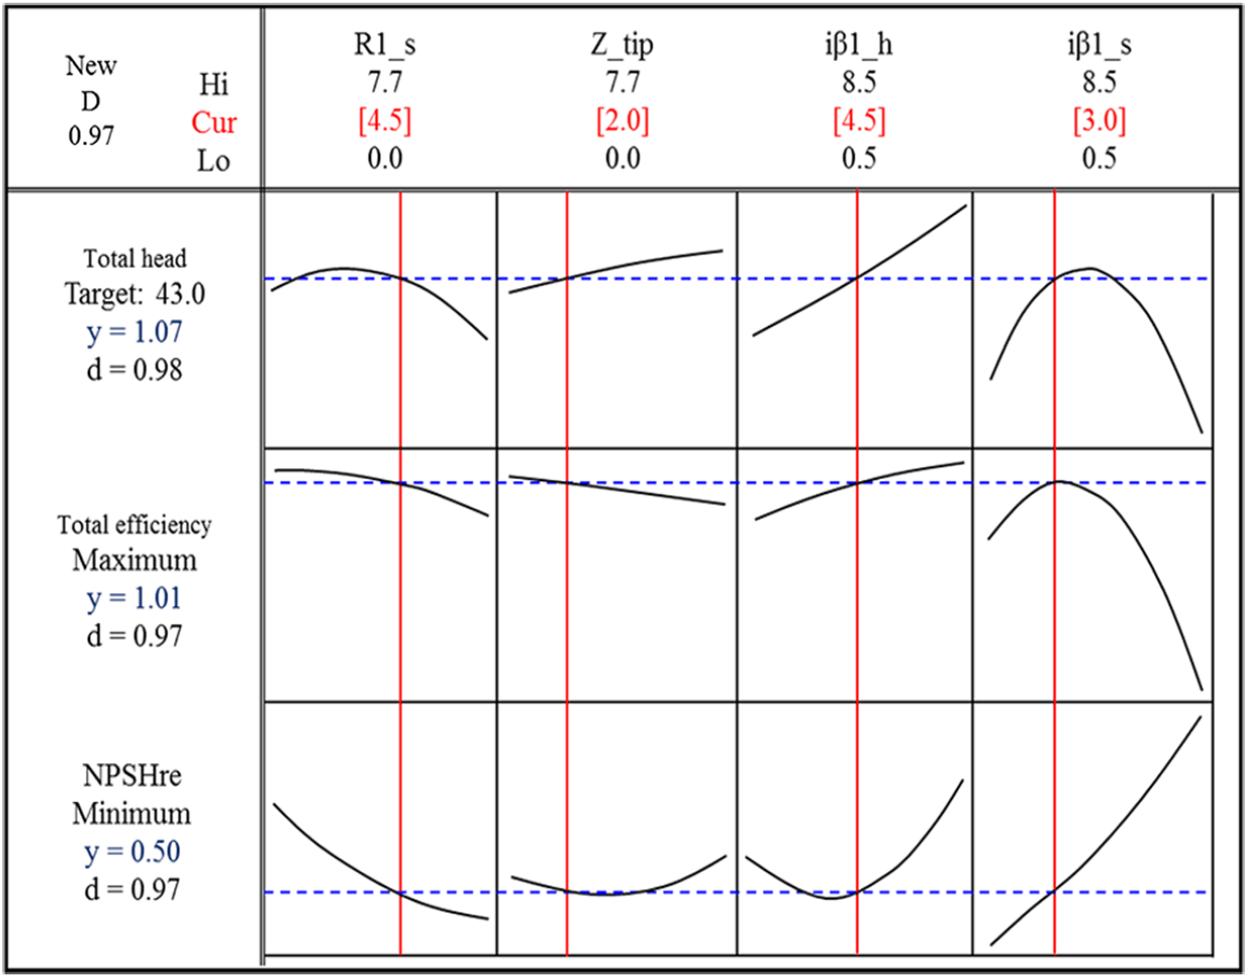
Plot for response optimization.
In Figure 15, total head is satisfied with enhanced efficiency and suction performance when R1_s is 4.5, Z_tip is 2.0, iβ1_h is 4.5, and iβ1_s is 3.0. As it satisfies all the required objective functions, this was selected to be the optimal model and its performance was verified by numerical analysis. Design variables and objective functions here were normalized to the value of the reference model. Figure 16 shows the comparison of the meridional shapes of the reference model and optimum model.

Comparison of meridional planes.
Surface area of the impeller inlet was increased in the optimum model compared to the reference model. Figure 17 compares the three-dimensional shapes of the reference model and the optimum model. Sweep angle is bigger in the optimum model compared to the reference model.

Comparison of three-dimensional geometry impeller.
Comparative analysis of the reference and optimum models
The performance of the reference model and the optimum model were predicted using numerical analysis. Figure 18 compares the total head curves and Figure 20 compares the efficiency curves. In Figure 18, the total head curves are generally similar in the reference model and the optimum model. The objective function for the total head in the optimum model was designed to be the “target” explaining the similarity to the reference model. 22
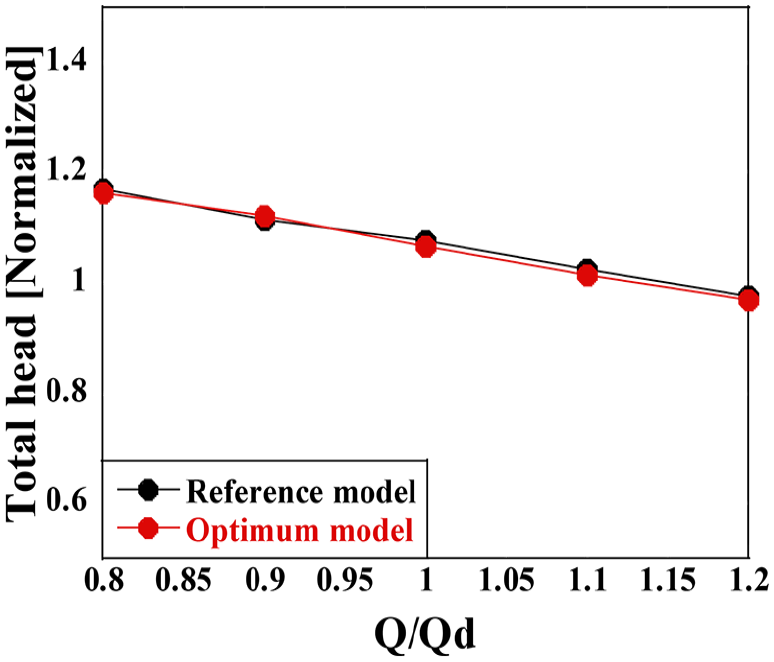
Comparison of total head curve (numerical analysis results).
In order to investigate the reasons why the performance was enhanced in the optimum model, internal flow was analyzed through numerical analysis. Figure 19 compares the pressure distribution between the reference model and the optimum model. The overall pressure distributions are similar in Figure 19. The internal pressure distributions are similar in Figure 18 due to the similar total heads of the two models.

Comparison of the total pressure contour on the meridional plane: (a) reference model and (b) optimum model.
In Figure 20, the efficiency at the design flow rate is higher in the optimum model compared to the reference model. Notably, the efficiency is higher in the optimum model not only at the design flow rate but also at low flow rate. The enhanced efficiency in the optimum model is confirmed by Figure 20. In order to investigate the reasons why the performance was enhanced in the optimum model, the internal flow was analyzed through numerical analysis.

Comparison of total efficiency curve (numerical analysis results).
Figure 21 shows a streamline comparison of the internal flow between the reference model and the optimum model. The internal flow in the optimum model flows very smoothly while the internal flow of the reference model is not smooth, confirming that the efficiency has been increased in the optimum model.

Comparison of the streamline at hub: (a) reference model and (b) optimum model.
Figure 22 compares the cavitation coefficient curves. In these curves, the cavitation coefficient was predicted to be lower in the optimum model compared to the reference model, attesting improved suction performance in the optimum model. 23 In Figure 22, total head is stable as pressure decreases until a certain inlet pressure where it drops rapidly. However, total head in the reference model drops gradually as inlet pressure decreases.

Comparison of cavitation coefficient curve (numerical analysis results).
Figures 23 and 24 give information about the volume of vapor generated inside the impeller in order to verify suction capacities of the reference model and the optimum model. In Figure 23, a high volume of vapor is generated in the reference model when inlet pressure is 50 kPa whereas only a small volume of vapor is made in the optimum model under the same conditions. Vapor is generated from all areas of the blades in the reference model when inlet pressure is 25 kPa, whereas relatively less vapor is generated in the optimum model, confirming that the suction performance has been increased. It is confirmed, through the performance curves in Figures 18, 20, and 22, and the internal fluid characteristics of the impeller in Figures 19, 21, 23, and 24, that performance has been enhanced in the optimum model compared to the reference model.

Comparison of isosurface of vapor pressure at 50 kPa: (a) reference model and (b) optimum model.

Comparison of isosurface of vapor pressure at 30 kPa: (a) reference model and (b) optimum model.
Figure 25 describes the performance curves of experimental results. Figure 25(a)–(c) shows the total head, total efficiency, and cavitation coefficient curves, respectively. In Figure 25(a), the total head curves of the reference model and optimization model are compared, and the tendencies are the same. In Figure 25(b), optimum model shows improved total efficiency than reference model, and in Figure 25(c), optimum model shows improved cavitation characteristic than reference model. Generally, the suction performance and total efficiency have the opposite trends; however, in this study, it is possible to design the shape with improved total efficiency and suction performance at the same time. The impeller shape with improved total efficiency and suction performance compared to the reference model was induced by optimum design.

Comparative analysis of the performance evaluation for reference and optimum model (experimental result): (a) performance evaluation of the total head, (b) performance evaluation of the total efficiency, and (c) performance evaluation of the cavitation coefficient.
Conclusion
In this article, the impeller of a mixed-flow pump, which satisfies the total head and has enhanced efficiency and suction performance, was optimally designed. Design variables of the meridional plane and vane plane development that control the inlet part shape were selected before design optimization was carried out using an optimization technique. The conclusion of this study is as follows.
Impeller design is of the utmost importance in the performance enhancement of mixed-flow pumps. Designing impeller the inlet part is very important in order to improve efficiency and suction performance while satisfying the design specification of the total head.
In order to optimally design a mixed-flow pump impeller, a Bezier curve was used to design the meridional plane of the mixed-flow pump in accordance with the changes in the design variables of the impeller inlet part, while vane plane development was used to design the blade angle distribution.
In the design of mixed-flow pumps, the performance indices of efficiency improvement and suction enhancement are in conflict with one another. Nevertheless, designing the required shape is possible when the shape of the impeller and the performance depending on the changes in the design variables are analyzed. By utilizing optimization techniques and CFD, an impeller shape which satisfies the total head and has enhanced efficiency and suction performance was generated. The optimum model satisfies the total head of the design specification and improves efficiency by 0.7% and has 1.5 m higher NPSHre compared to the reference model.
The improvement in efficiency is confirmed when the internal flow of the optimum model is analyzed, as it flows very smoothly from the inlet part to the exit part. The enhancement in suction performance is confirmed as the vapor did not rapidly increase with decreasing pressure in the impeller inlet part.
Footnotes
Appendix 1
Handling Editor: Jose Ramon Serrano
Declaration of conflicting interests
The author(s) declared no potential conflicts of interest with respect to the research, authorship, and/or publication of this article.
Funding
The author(s) received no financial support for the research, authorship, and/or publication of this article.