
Abstract
Stirling cryocoolers are widely used to refrigerate significant facilities in military and aerospace applications. However, under the influences of high-frequency piston motion and thermal environment deterioration, the refrigerating performance of Stirling cryocoolers will worsen inevitably, thus affecting the successful accomplishment of space mission. In this article, a methodology on assessing the performance of space Stirling cryocoolers is proposed, which involves the analysis of the failure mechanism, health indicator construction and remaining useful life prediction of the cryocooler. The potential factors affecting the refrigerating performance are discussed first. In view of these, three health indicators representing the degradation process of cryocoolers are constructed and then a multi-indicator method based on particle filter is proposed for remaining useful life prediction. Finally, the proposed method is validated by a Stirling cryocooler from one retired aircraft, and the results show that the constructed health indicators and remaining useful life prediciton approaches are effective for performance assessment of Stirling cryocooler.
Keywords
Introduction
Stirling cryocoolers are widely equipped as the vital cooling devices for superconducting and infrared facilities in military and aerospace fields.1,2 As one of the famous thermodynamic cycles, the Stirling cycle was presented by British physicist, Robert Stirling in 1816. The first development of miniature linear free-piston Stirling cryocooler was accomplished at the Philip laboratory, with the cooling capacity of 580 W at 77 K. The cryocoolers working on the Stirling cycle are characterized by high efficiency, fast cool down, low power consumption, light weight and high reliability, which prompt their application in infrared imaging camera, superconducting device and medical diagnostic apparatus. 3 However, due to the frequent reciprocating piston motion and thermal environment deterioration, some degradation phenomenon emerges inevitably, for example, piston abrasion, leakage and pollution of refrigerating medium and low efficiency of heat dissipation. These degradations will limit the useful lifetime of cryocoolers and even destroy military and aerospace tasks.4–6 Remaining useful life (RUL) prediction enables early detection of faultiness and estimation of end of lifetime of Stirling cryocoolers and also further help operators schedule a valuable control strategy to lengthen the life of cooled devices.7,8
Health indicator (HI) construction is the primary issue for RUL prediction of Stirling cryocoolers. Suitable HIs can reveal the degradation process of Stirling cryocooler and generate accurate RUL prediction results. HIs are generally related to the failure physics, which can be extracted from monitoring signals by statistical methods or signal processing methods. 9 Plenty of research has been conducted on the quantification analysis of the performance degradation of Stirling cryocooler under different failure modes. Liu et al. 10 constructed an accurate performance degradation model of Stirling cryocooler and realized its lifetime evaluation under gas contamination. Sato et al. 11 investigated the outgas analysis of mechanical cryocoolers and evaluated the effect of outgassing process for lengthening cryocoolers lifetime. Yang et al. 12 established a lifetime model of Stirling cryocoolers under the influences of contamination and proposed an accelerated lifetime evaluation technique. In addition, design, manufacturing and test in optimum operating condition for Stirling cryocoolers were presented, and cryocooler performance was evaluated as a function of different operating parameters. 3 The quantification analysis of performance degradation can provide effective information for HIs construction. However, the degradation of Stirling cryocoolers may be due to multiple reasons, such as mechanical parts failure, leakage and pollution of cooling medium and thermal environment deterioration. Multiple HIs should be considered for various failure modes.
The RUL prediction approaches can be classified into data-driven methods and model-based methods. Data-driven methods attempted to describe the health degradation process of a machine from measured data using machine learning techniques. 13 In the aspect of data-driven methods, Teng et al. 14 used artificial neural network to predict short-term feature series and fitted a polynomial curve of long-term degradation process to solve the RUL prediction of bearings. A novel approach combining empirical mode decomposition and autoregressive integrated moving average model was proposed for RUL prognostic of lithium-ion batteries. 15 Hu et al. 9 adopted an ensemble data-driven-based prognostic approach that combined multiple algorithms to improve the RUL prediction accuracy of nuclear power plant. Long short-term memory model was employed to capture the underlying long-term dependencies among the degraded capacities and the result showed that the end-of-lifetime could be predicted earlier than the traditional methods. 16 Nevertheless, data-driven methods exceedingly rely on the quantity and quality of historical data that is acquired with difficulty in real cases.17,18
On the contrary, model-based methods aim to establish mathematical and physical models to derive the degradation process of machinery and update model parameters using the measured data. 19 Consequently, model-based approaches can incorporate both expert knowledge and monitoring information from machinery. In conclusion, model-based approaches may work well in RUL prediction of Stirling cryocoolers under small sample constraint.20,21 Zio and Peloni 22 applied particle filtering (PF) to estimate the RUL of a mechanical component subject to fatigue crack growth. Miao et al. 23 combined unscented Kalman filter and PF for RUL prediction, obtaining a prediction error less than 5%. An et al. 24 presented a MATLAB tutorial for PF-based prognostic algorithm. Corbetta et al. 25 described the fatigue crack process based on a stochastic dynamic state space model and updated the model parameters using PF. Chen et al. 26 introduced PF method into adaptive neuro-fuzzy inference systems (ANFIS), and the results demonstrated that the integrated model outperformed the individual ANFIS predictor or particle filter–based predictor. Orchard et al. 27 presented a PF-based real-time prognostic method to estimate the battery discharge time, as well as a risk measure including risk information of battery failure and a confidence measure for prognostic algorithm.
For the health management and RUL prediction of Stirling cryocoolers, there are three challenging tasks while using model-based algorithm: (1) The accuracy of RUL prediction is influenced by the HIs and its construction needs professional knowledge on the failure mechanism analysis of Stirling cryocoolers. (2) The lack of mathematic relation between estimated coefficients and observations leads to an inaccurate posterior probability. (3) Traditional model such as single exponential model is too simple to model the degradation process of Stirling cryocooler. Two-exponential model that fits degradation process well is the better selection method for RUL prediction but will bring more coefficients that enhance the uncertainty and randomness of prediction.
To deal with the aforementioned problems, a methodology on health management of Stirling cryocooler is proposed, involving the analysis of the failure mechanism, HI construction and RUL prediction. The remainder of the article is organized as follows: the structure of an infrared detector equipped with a Stirling cryocooler is presented and the working principle of the Stirling cryocooler is introduced in section ‘Infrared detector equipped with Stirling cryocooler’. Section ‘Failure analysis and health indication construction’ analyzes the failure mechanism of the Stirling cryocooler and constructs three HIs representing the degradation process. The theory of PF is introduced in section ‘Particle filter’. The multi-indicator-based RUL prediction method is proposed in section ‘RUL prediction for a Stirling cryocooler’ to solve the posterior probability and overcome the randomness of PF, which is validated by the Stirling cryocooler from a retired aircraft. Section ‘Conclusion’ concludes the article.
Infrared detector equipped with Stirling cryocooler
An infrared detector in aircrafts mainly consists of infrared camera, dewar component, Stirling cryocooler and heat dissipation system, which is shown in Figure 1. Infrared camera is the imaging equipment that converts invisible infrared radiation signal into electrical signal. Dewar component is the insulation structure to keep the infrared camera in low-temperature environment. Stirling cryocooler is composed of compressor and expander, and provides sustaining refrigerating source for infrared camera. Heat dissipation system connects with the shell of the compressor and expander, which consists of heat pipe and cold plate. The heat pipe transports the heat generated from refrigerating process to cold plate where the heat is exchanged to space environment. The refrigerating capability of the Stirling cryocooler has great influence on the imaging quality of infrared detector.

Structure of the infrared detector.
The Stirling cryocooler in this article, produced by Thales Company, is a free-piston Stirling cryocooler with pneumatic and split structure as shown in Figure 2. It takes a fully oilless configuration to satisify the long-life requirement. Helium, the working medium in Stirling cryocooler, has ideal gas properties with high thermal conductivity and high ratio of specific heats. The compressor adopts a symmetrical bracing structure with blade springs, where the two compressor pistons are driven by the magnet linear motors. The expander has a cylindrical spring bracing structure without driving motor. Thus, the light-weight Stirling cryocooler can provide a wide refrigerating range. Table 1 shows the main technical parameters of the free-piston Stirling cryocooler used in this article. The refrigerating frequency is 50 Hz.

Schematic diagram of the free-piston Stirling cryocooler.
Technical parameters of free-piston Stirling cryocooler.

Failure analysis and health indication construction
Failure analysis of the Stirling cryocooler
In space task, the reliability of the Stirling cryocooler equipped in an aircraft directly dominates whether the infrared detector works normally or not, even referring to the consummation of military and aerospace mission. To construct the HIs representing the performance degradation of the Stirling cryocooler, the influencing factors concerning Stirling cryocooler failures are analysed in Figure 3.
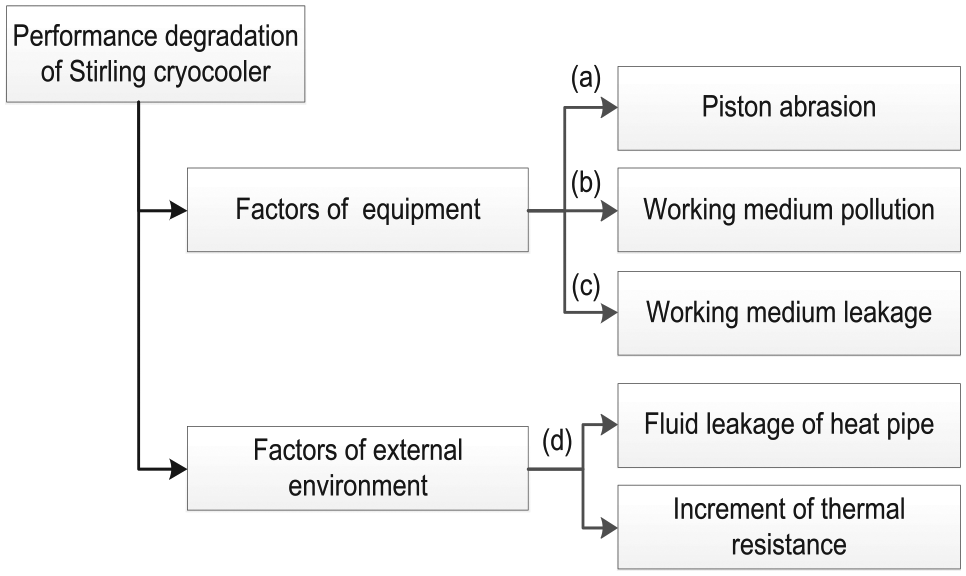
The influencing factors of performance degradation of Stirling cryocooler.
The influencing factors of performance degradation of Stirling cryocooler mainly involve factors of equipment and external environment. Further, they can be categorized as follows:
1. Piston abrasion:
The piston of compressor is a typical mechanical component, and the abrasion between piston and cylinder wall is inevitable, which will enlarge the seal, aggregating the leakage loss and decreasing the compressor efficiency. Besides, the grinding particles will pollute the working medium. Once the polluted working fluid gathers in the regenerator, the gas flow could be interrupted and the pressure drop of friction will increase. As being said, the pressure in expander will decrease further reducing refrigerating capacity.
2. Working medium pollution
Due to the deflation of parts surface and materials, the working medium helium will be polluted under continuous running of cryocooler. As the operating time of Stirling cryocooler increases, more and more foreign gas will gather near the cold head, impeding heat conduction between cold head and working medium. Thus, the refrigerating capacity of Stirling cryocooler will be seriously affected.
3. Working medium leakage
Working medium leakage of Stirling cryocooler is a potential factor of performance degradation. Due to high-frequency mechanical motion of piston, some sealing components might be burnt, which causes the leakage of working medium under high pressure in compressor and expander volume. The pressure of working medium will reduce, further affecting the cooling capacity of Stirling cryocoolers. Fortunately, the Stirling cryocooler produced by Thales Company utilizes fully welded construction. The working medium leakage is almost impossible to occur in this structure.
4. External environmental factors
The external environmental factors refer to thermal environment deterioration, mainly including fluid leakage of heat pipe and increment of thermal resistance. These failure modes will lead to the degradation of heat dissipation capacity and make the cooling environment deteriorate, and further influence the refrigerating capacity of the cryocooler.
Three HIs
For the Stirling cryocooler in space, its weight is strictly limited, so seldom sensors are allowed to be mounted. This characteristic feature makes the measured data of Stirling cryocooler limited, thus HI construction is a challenging task.28,29 In this article, we extract HIs related to the failure physics using signal processing. Table 2 shows the monitoring information of the Stirling cryocooler in this article.
Monitoring information of the Stirling cryocooler produced by Thales Company.

Due to the intermittent work of Stirling cryocooler and uplink control instructions of infrared detector, the Stirling cryocooler involves several working modes. Electric current is a direct and visualized signal to reflect its working modes. The regular fluctuation of electric current in a working cycle is shown in Figure 4(a). A total of 544 working cycles during its life cycle of the Stirling cryocooler are recorded in this article. In Figure 4(a), one working cycle is segmented into cryocooler starting, refrigerating process, transition process, imaging process, steady working process and cryocooler shutdown. The cryocooler starts as the purple line with a sudden rise step of electric current, and then the red line represents the refrigerating process, in which electric current signal keeps rising until the cold head temperature of infrared camera reaches objective cooling temperature. Figure 4(b) shows the varying trend of cold head temperature in the working cycle, where the decline of cold head temperature is synchronous to the sudden rise of electric current signal. After the cold head temperature reaches the objective refrigerating temperature, the electric current signal gradually decreases to a steady range as the black transition process. The green lines are the electric current signal affected by the imaging processes of infrared camera, which show regular fluctuations in a small range. Meanwhile, the partial enlarged diagram in Figure 4(c) indicates the imaging process will also cause the synchronous fluctuation of cold head temperature. As shown in the partial enlarged diagram of Figure 4(d), the red dot line represents the shutdown time of cryocooler, when the electric current data are gradually decreasing and the cold head temperature increases a few seconds later.

Electric current signal and cold head temperature in one working cycle: (a) electric current, (b) cold head temperature, (c) cold head temperature at imaging process, and (d) electric current and cold head temperature at shutdown of Cryocooler.
HIs should be extracted for all 544 working cycles to represent performance degradation of Stirling cryocooler during its life cycle. The refrigerating time, which is the duration of refrigerating process, is a vital indicator to represent the cooling capacity of Stirling cryocooler. As shown in Figure 4, the refrigerating time can be calculated as the time interval of the refrigerating process in equation (1)

where tn represents the refrigerating time of the nth working cycle, which is computed as the duration of the nth refrigerating process. The black dots of tn1 and tn2, respectively, denote the starting and stopping of refrigerating process.
The red line in Figure 5 shows the varying tendency of refrigerating time during life cycle. It can be seen that the refrigerating time increases with the number of working cycle, demonstrating that refrigerating time is one of the significant indicators denoting the degradation of Stirling cryocooler. The longer refrigerating time denotes the worse cooling performance of the Stirling cryocooler. In addition, the blue dot dash and black dash lines, respectively, represent the single-exponential and the two-exponential models, and the comparative result proves that the two-exponential model can consistently fit the varying tendency of refrigerating time.

The HI denoted by the refrigerating time during life cycle.
As the performance begins to degrade, the power of Stirling cryocooler should artificially increase to compensate the refrigerating loss, thus the electric current signal will ascend with the increasing power, which is regarded as a vital parameter to reflect the refrigerating capacity of Stirling cryocoolers. Here, the mean value of electric current signal in steady working process is the second indicator of Stirling cryocooler, which is calculated as equation (2)
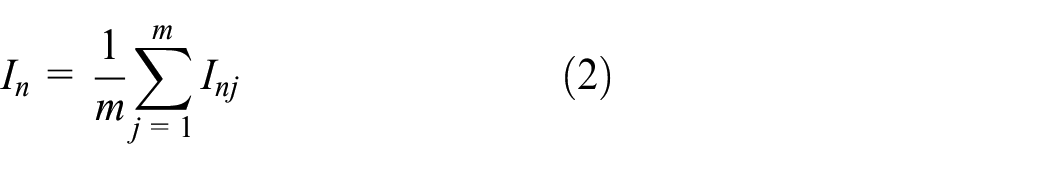
where In represents the mean value of electric current signal in the nth working cycle and m is the number of steady working processes in each working cycle. Inj is the mean value of electric current signal in the jth steady working process of one working cycle. Taking the working cycle in Figure 4 as an example, the parameter m equals to 5.
The red line in Figure 6 shows the varying tendency of mean electric current in each working cycle during life cycle. Likewise, the black dash line of two-exponential model can fit the tendency of electric current better than the single-exponential model.

The HI denoted by electric current of Stirling cryocooler during life cycle.
The thermal environment is regarded as another important factor to influence the refrigerating capacity of Stirling cryocooler. The performance degradation of heat dissipation system shows that the generated heat cannot be emitted timely, causing the loss of refrigerating capacity. Thus, temperature parameters are also vital for describing the performance degradation of cryocoolers. Cold plate is the direct and final unit for emitting heat of Stirling cryocooler, so cold plate temperature is an effective parameter reflecting the heat dissipation capacity of infrared camera. Figure 7 shows the relationship between electric current and cold plate temperature, and the cold plate temperature gradually increases after the cryocooler starting. After a while, the cold plate temperature keeps in a steady range from the end of transition process (tn3) to the cryocooler shutdown time tn4.

Electric current signal and cold plate temperature in one working cycle: (a) electric current and (b) cold head temperature.
In this article, the mean value of cold plate temperature from tn3 to tn4 is calculated as the third HI, and this HI can reflect the heat dissipation capacity when infrared camera works under steady refrigerating process provided by the Stirling cryocooler. The computed mean cold plate temperature is shown as

where Tn represents the mean value of cold plate temperature from tn3 to tn4 in the nth working cycle and m is the number of data points from tn3 to tn4. Ti is the temperature value from tn3 to tn4.
The red solid line in Figure 8 shows the varying tendency of the cold plate temperature during life cycle and the better fitting result can be acquired based on two-exponential model.

The HI denoted by cold plate temperature during life cycle.
The three HIs in Figures 5, 6 and 8 exhibit an analogous tendency during life cycle. From initial to the 240th working cycle, three indicators keep nearly constant with a tiny increment, meaning that the Stirling cryocooler is in a healthy state. At about the 274th cycle, the indicators increase obviously, and regularly ascend until the 465th cycle. This stage means the performance deterioration of the Stirling cryocooler. From the 466th cycle, the indicators continue to increase and fluctuate intensively, denoting the final phase of the life cycle. The three indicators can be accurately described by the two-exponential model, which provide the feasibility of the RUL prediction of the Stirling cryocooler.
Particle filter
Particle filter is developed as an extension of Kalman filter to realize nonlinear tracking. It no longer assumes the state or noise distribution obeying the Gaussian distribution. 30 A dynamic nonlinear system can be described as the state space equations (4) and (5)


where equation (4) is state model and equation (5) is measurement model. xk and zk are system state and observation at the kth step. f(.) and h(.) are state and observation function. vk−1 is state noise at the (k − 1)th step and wk is observation noise at the kth step.
The aim of particle filter is to compute the posterior density distribution p(xk|z1:k) through the known observations z1:k. Due to xk depending on xk−1, p(x0:k|z1:k) is first analysed. Theoretically, if enough particles obeying p(x0:k|z1:k) can be drawn, with reasonable weights wk, p(x0:k|z1:k) could be approximated as

where Ns is the number of particles,
q(x0:k|z1:k) is called importance density and it can be factorized as

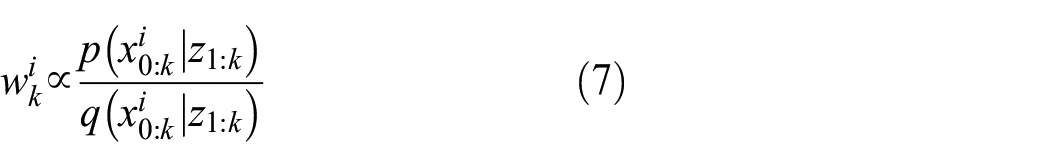
where q(x0:k−1|z1:k−1) equals to q(x0:k−1|z1:k) considering the concrete physical meaning. The recursive process of p(x0:k|z1:k) is derived as

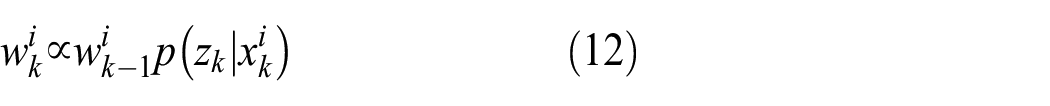
where p(zk|z1:k−1) denotes the correlation between the current observation and previous ones. Since the observations can be measured, their correlation is explicit and can be modelled by time series methods and p(zk|z1:k-1) is regarded as a normalizing constant. Then, sample some particles and substitute equations (8) and (9) into equation (7), the weight

In common case,

If the importance density
The posterior density p(xk|z1:k) will be estimated as

And the current state of the nonlinear system is updated as

RUL prediction for a Stirling cryocooler
Model definition
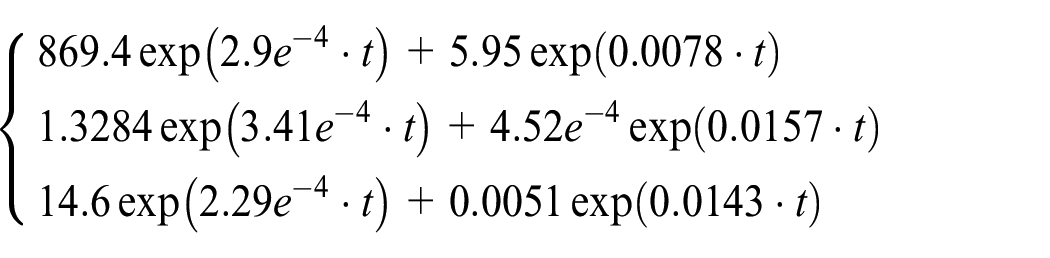
Two-exponential (a·exp(b·t) +c·exp(d·t)) and single-exponential (a·exp(b·t)) models are utilized to fit the degradation law of three HIs. The fitting type is nonlinear least squares. The fitted two-exponential model (dash line) in Figures 5, 6 and 8 are
The fitted single-exponential model (dash dot line) in Figures 5, 6 and 8 are

To compare the fitting effect, the mean absolute deviation (MAD)
As a discrete system, the state model and observation model of the Stirling cryocooler are defined as equations (15) and (16). The two-exponential model that is generally used in the RUL prediction of bearings 21 and power batteries 31 is listed as following
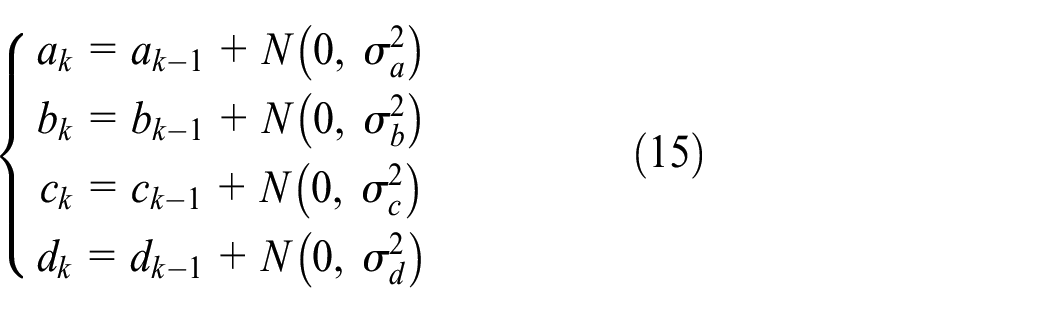

where ak, bk, ck and dk are the coefficients of the two-exponential model. The initial values of the coefficients are pivotal for the accuracy of RUL prediction. He
31
used the Dempster–Shafer theory to select the initial coefficients of ak, bk, ck and dk. Actually, the fitting for the HIs during life cycle could provide the superior coefficients if the life data is available. Here, the same Stirling cryocooler on the ground provides us the initialize coefficients of ak, bk, ck and dk.
Failure threshold
Another significant parameter in RUL prediction is the failure threshold. Refrigerating time reflects the cooling performance of the Stirling cryocooler, and determines when the infrared camera could implement imaging process. The too long refrigerating time means the performance deterioration of the cryocooler, which will disturb the imaging task of the infrared camera. Thus, at the design of the Stirling cryocooler, the refrigerating time is required to be not more than 30 min. Considering the factors affecting the cooling performance in Figure 3, a safe coefficient 1.2 is introduced to guarantee the reliable working of the cryocooler. Then, the failure threshold of the refrigerating time is set as 30/1.2 = 25 min.
In Figure 6, although the refrigerating time reduces after the 523rd working cycle (refrigerating time: 25 min), it is difficult to keep a steady status for the cryocooler in this case.
The other two indicators, electric current in Figure 6 and temperature of the cold plate in Figure 8, follow the same tendency of the refrigerating time. At the working cycle with longest refrigerating time, the thresholds of electric current and temperature are separately 3.8 A and 29.5°C.
Procedure of the RUL prediction
With the initial coefficients of ak, bk, ck and dk and their variances, the prediction procedure of the RUL of the Stirling cryocooler is implemented as shown in Figure 9.
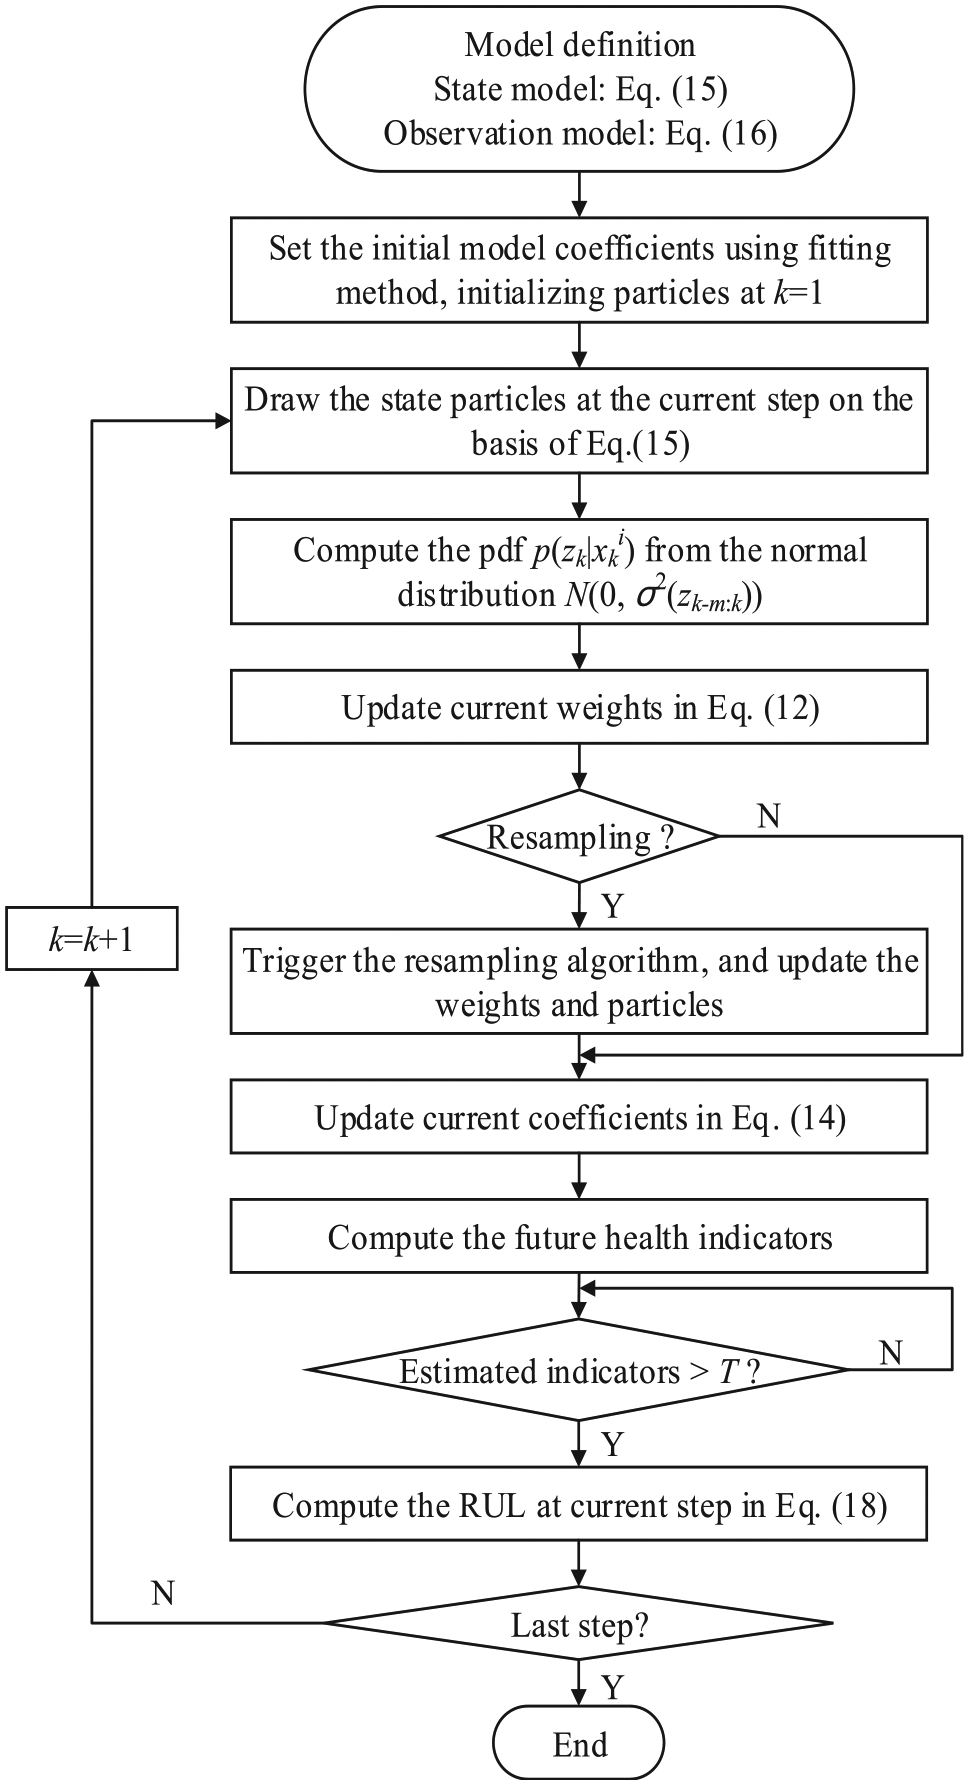
Flowchart of RUL prediction of the Stirling cryocooler.
First, the state model and observation model are defined as equations (15) and (16). The state of particle filter is denoted by the coefficients of ak, bk, ck and dk in the two-exponential model. At step k, the state transition process
Then, the probability density function

where zk–m:k are the past observations from step k–m to k. std denotes the standard deviation computation of the array zk-m:k.
Next, current particle weights are updated as equation (12). Due to the recursive computation, the weights will be degenerated so that many particles with tiny weights will be useless in the particle filter. A resampling mechanism should be triggered when the sum of squares of current weights exceeds certain threshold. After resampling, the state of the particles are updated as equation (14), denoting that the updated model coefficients ak, bk, ck and dk are obtained. Further, the predicted observation is computed as equation (16) without the observation noise until the predicted one knocks into the failure threshold. The knock time is denoted by tf. Therefore, the RUL at step k can be computed as

The procedure is recursively implemented until the actual observation reaches the failure threshold.
Result of the RUL prediction
Following the flowchart in Figure 9, the particle states (coefficients of the two-exponential model) are updated, and the filtered observations of refrigerating time, current and temperature are shown in Figure 10(a)–(c). The filtered observations can match the actual HIs well, which demonstrate a superior tracking ability of the particle filter–based RUL prediction method.

sThe tracking result of the three HIs using particle filter: (a) tracking result of refrigerating time, (b) tracking result of electric current, and (c) tracking result of cold plate temperature.
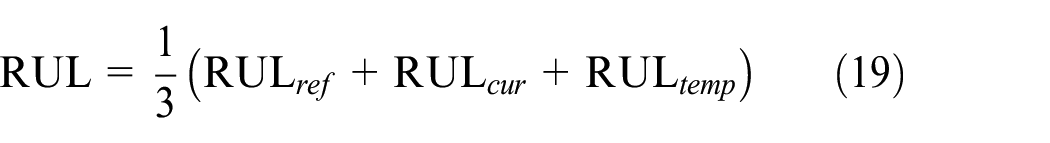
Particle filter is a Bayesian algorithm with randomness to some extent. Diverse RUL results will be obtained while implementing the particle filter–based RUL prediction method at different times. To overcome the randomness of particle filter, a multi-indicator RUL formula is proposed. For each HI, the RUL is individually computed, and the predicted multi-indicator RUL of the Stirling cryocooler is defined by the mean values of the three RULs from refrigerating time, current and temperature, which is shown as
To evaluate the prediction accuracy of RUL, the MAD is utilized, shown as

where eRUL is the MAD of the individual predicted RUL using refrigerating time, current, temperature or the mean RUL. RUL k is the predicted RUL at step k and RUL ak is the actual RUL at step k.
The MADs during 20 times of the RUL prediction are shown in Figure 11. The RUL using refrigerating time displays inferior accuracy and large fluctuation. The reason lies in the range of refrigerating time that is larger than other indicators so that it is more sensitive to the model coefficients with randomness. The RUL using current has the lowest prediction error, but large deviation as well. Obviously, the multi-indicator RUL has good prediction accuracy and small fluctuation, which verifies the proposed mean RUL prediction method in equation (19) is beneficial to the RUL prediction of the Stirling cryocooler.

The mean absolute deviation of RUL results during 20 predictions.
For the seventh prediction in Figure 11, the accuracy of multi-indicator RUL is superior, and the RUL results are show in Figure 12. It can be seen from the results that the RUL using temperature matches the actual RUL well, and the multi-indicator RUL performs next to the RUL using temperature. Nevertheless, the multi-indicator RUL is acceptable due to the small MAD of 13.9 cycles.

The RUL results with minimum error of the multi-indicator RUL.
Although the prediction using temperature exhibits the best accuracy in Figure 12, it encounters inferior result at the fifth prediction, shown in Figure 13. This phenomenon illustrates that the RUL using individual indicator undulates intensively, and the RUL using current at the 200th cycle nearby demonstrates this conclusion as well. On the contrary, the multi-indicator RUL performs robust than the other indicators, exhibiting a believable prediction result.

The RUL results with maximum error of the multi-indicator RUL.
Conclusion
RUL prediction of Stirling cryocooler plays a significant role in scheduling the predictive control strategy. However, it is challenging due to the diversity of failures, the difficulty in extracting different failure features, inaccurate description of performance degradation and so on.
To solve the problems above, this article constructs three health indications to represent the performance degradation through analysing the failure mechanism of Stirling cryocooler. A particle filter–based RUL prediction method is presented to realize the robust RUL estimation, involving the variance estimation of observations and fusion of multiple HIs.
Two exponential models are introduced to describe the HIs as well. With the initial coefficients provided by ground tests, the proposed multi-indicator-based RUL prediction method exhibits accurate prediction results on the Stirling cryocooler in a retired aircraft.
Footnotes
Handling Editor: James Baldwin
Declaration of conflicting interests
The author(s) declared no potential conflicts of interest with respect to the research, authorship and/or publication of this article.
Funding
The author(s) disclosed receipt of the following financial support for the research, authorship and/or publication of this article: The work in this paper was supported by the Open Research Fund of Key Laboratory of Space Utilization, Chinese Academy of Sciences (No. LSU-KFJJ-2019-09 and No. CSU-QZKT-2018-09) and the Open Project of Beijing Key Laboratory of Measurement and Control of Mechanical and Electrical System (No. KF20181123205).