
Abstract
This article explores the environment-related antecedents and the influence of Total Productive Maintenance and other lean manufacturing practices on environmental sustainability. Since practitioners point to the environmental benefits of Total Productive Maintenance, a deeper study of the relationship between Total Productive Maintenance and environmental results can contribute to sustainability in manufacturing. In consequence, a review of the literature was undertaken. It was found that (1) the environmental antecedents have not been considered, (2) there is a lack of survey-based papers in the ‘lean and green’ literature and (3) Total Productive Maintenance has not been well addressed. To fill this void in the literature, this article explores the extent to which antecedents of implementation of lean manufacturing practices and Total Productive Maintenance are based on environmental sustainability (namely, on pressure ‘to go green’ from stakeholders and on an effort to achieve environmental certification) and the influence of Total Productive Maintenance and different lean manufacturing practices on several variables related to environmental sustainability performance. The research questions are tested with data collected from over 500 international manufacturing firms. Results show an association between the perceived degree of environmental pressure – or environmental certification – and Total Productive Maintenance (as well as other lean practices). However, not every lean practice is correlated with every environmental indicator. Different lean manufacturing practices seem to have a positive impact on specific operations, but it is possible that there is a limit to the influence of Total Productive Maintenance and other lean practices on environmental sustainability.
Introduction
Between the Industrial Revolution and the first half of the 20th century, factories looked grey or even black. The sooty walls of manufacturing plants were caused by the management’s focus on increasing output without consideration of the harmful aspects of industrial production such as the black smoke caused by coal-fired steam-engines. 1 This image of a grey factory, in an economic model based on mass production, is today regarded as unsustainable and terribly environmentally degrading.
Society today is increasingly aware of the vulnerability of the environment and demands ‘green’ factories, that is, plants whose production processes cause no harm to the environment (e.g. low levels of energy consumption, raw material usage, waste and pollutants). 2 Currently, environmental protection has been embedded in the broader concept of sustainability or sustainable development, which can be defined as ‘development that meets the needs of the present without compromising the ability of future generations to meet their own needs’. 3 Sustainability, according to the triple bottom line framework, includes social, environmental and financial goals. 4 This article, however, focuses only on environmental sustainability.
Several studies argue that lean manufacturing (LM) can have a positive effect on environmental sustainability. 5 They are based on interviews in which respondents explain their companies’ achievements in reducing the use of resources (especially hazardous or harmful materials, water and energy), pollution emitted and waste generated, and in minimizing environmental risks. So should manufacturing companies implement LM to improve their degree of environmental sustainability? Are lean plants greener? The few attempts to empirically prove the relationship between LM and environmental sustainability have used different research methodologies, 6 and sometimes they rely on the relationship between just two variables or two constructs (namely LM and performance). However, LM operationalization requires the implementation of different practices such as pull production or Total Quality Management (TQM), and environmentally sustainable manufacturing can be assessed according to different performance indicators (use of hazardous substances, water use reduction, air emissions reduction, waste generation reduction, energy efficiency, reduced use of raw materials, number of environmental programmes in place etc.), as well as the level of environmental management activities (environmental certifications, sustainable environmental tools such as life cycle analysis, programmes to reduce waste etc.). Based on the above, the influence of different LM practices on specific environmental aspects is not yet clear. In line with the experience of some practitioners, some LM practices may simply improve specific facets of environmental sustainability performance. For example, a Toyota plant in China has succeeded, as recently reported by the plant management, in reducing material waste in production by virtue of LM. In addition, by dint of its corporate philosophy of ‘leaner manufacturing for a greener planet’, Toyota encourages its suppliers to increase their just-in-time delivery capability while simultaneously reducing the pollution associated with fast production. An increasing number of practitioners report that the implementation of different LM practices may simply lead to different environmental results. In consequence, there is room for more research, especially empirical research based on survey data.
Among the set of LM practices, Total Productive Maintenance (TPM), a continuous improvement technique based on teamwork and autonomous maintenance that ensures good operation and longer lives for machines, that has seen its influence on environmental sustainability has come under question. As an example of an effort to ‘be green’, the brewing company Heineken announced that the firm had managed to reduce water consumption and carbon dioxide emissions in its Spanish plants as part of its corporate social responsibility (CSR) strategy. 7 The company claimed that these improvements were due to TPM. However, aside from the fact that there are only several real cases in which TPM has been adopted to improve environmental sustainability, when the related literature was reviewed through several databases, it was detected that few researchers believe that TPM has a strong effect on environmental sustainability. So, does implementation of TPM truly have a positive effect on environmental sustainability? If so, which performance measures can be improved? Extant studies do not delve into the above questions.
In the current framework of increasing environmental awareness and proliferation of environmental regulations, manufacturing companies interested in improving their sustainability are implementing LM (the Portuguese textile and clothing industry is a clear example). 8 However, implementation of LM is difficult, and a manufacturing company will usually need to invest a large number of resources and incur significant costs. 9 Despite this, more and more manufacturing companies are seeking to implement LM (or, at least, some of its common practices). What are the reasons? Few practitioners believe that environmental pressure from stakeholders is the main cause, despite the fact that today’s manufacturing companies engage in CSR, which therefore leads companies to further strive after environmental certification and to enhance their attractiveness. If the pressure to comply with environmental regulations were the only motive, companies’ willingness to support green practices for business stability would be low10,11 and they would be unenthusiastic about LM practices. This may lead to poor adoption and only a feeble relationship between lean practices and environmental performance. However, if a manufacturing company implements TPM or other LM practices because it is pursuing the certification of an environmental management system, the relationship between LM and environmental outcomes may be strong due to the company’s commitment to securing the required performance 12 and gaining a positive public image. 13 Even though a manufacturing company may have high environmental awareness and be embarked on a formal environmental certification programme, it may not implement some of the LM practices (e.g. TPM) due to the size of the investment required or the economic costs associated with them. Unless there is increasing environmental pressure, the company may never implement such LM practices. There is not yet a reasonable explanation for the antecedents of implementation.
Consequently, the purpose of this article is to explore the antecedents and influence of different LM practices, especially TPM. It explores two issues. The first question is the extent to which antecedents of implementation of LM practices and TPM are based on environmental sustainability – namely, on pressure to ‘go green’ from stakeholders and/or on an effort to achieve environmental certification. The second question is the influence of different LM practices and TPM on several variables related to environmental sustainability performance. These questions are addressed in this study through data provided by the sixth edition of the International Manufacturing Strategy Survey (IMSS), and the relationships between research variables are tested using a number of quantitative methods.
Compared to existing studies, this research further explores the influence of different LM practices and TPM on environmental sustainability performance. Extant works have generally focused on exploring the relationship between LM (as a whole) and environmental sustainability performance. Since TPM is an LM practice, its influence has been called into question and has yet to be verified. Therefore, this study helps fill the gap in the literature on the influence of different LM practices, and of TPM on environmental sustainability. The research findings may provide valuable suggestions for manufacturing companies, giving them the ability to understand, for each LM practice (e.g. TPM), what the expected environmental outcomes are. Since limited resources make it impossible for manufacturing companies to implement every possible LM practice, firms need to implement the most appropriate practices based on their environmental sustainability requirements. This study aims to clarify which LM practices are worth implementing and to provide valuable suggestions on practical implications. Finally, it explores the implementation antecedents of selected LM practices, including TPM, in order to understand why manufacturing companies are seeking to implement LM practices and TPM to improve their environmental sustainability performance.
LM and TPM
The term ‘Lean’ was coined in the 1980s at the Massachusetts Institute of Technology (MIT), within the International Motor Vehicle Program (IMVP) to describe the plants of Japanese car assemblers such as Honda or Toyota. The advantages of lean production over the ‘robust’ production model of Western car manufacturers were later published in the book The Machine That Changed the World. 14
LM is based on the Toyota Production System (TPS) which arose in the 1950s in the Toyota car company in Japan and was first known in the West as ‘Just-in-time’. One of the main objectives of the TPS is to improve operational efficiency by developing operations with a minimum cost. Many studies have subsequently confirmed that lean companies perform better according to a wide range of operational performance measures such as quality, inventories, lead times, labour productivity and so on. 15
To accomplish this aim, LM acts on the sources of muda (Japanese for waste), which is defined as everything that does not add value for the customer. Toyota identified seven major types of muda: overproduction, unnecessary or non-value added processing, unnecessary transportation and handling of goods, people or parts waiting, unnecessary motion of employees, excess inventories and production of defects. 16 Underutilized employee creativity 17 is frequently added to the list.
To fight these sources of muda, a certain way of working is required and several tools and techniques15,18 have been developed. For example, cell manufacturing avoids waiting and unnecessary transportation and kanban cards are used to produce only what is necessary.
To implement TPM, companies start by conducting a workplace cleaning and organization campaign termed ‘the 5-S activities’. 19 Autonomous maintenance (in which operators do the simplest maintenance tasks in the workplace) 20 can then be put in place. This is because TPM relies on continuous improvement through the involvement of employees (kaizen 19 in Japanese). Operators’ contributions include the redesign of processes and machinery. Since TPM aims at achieving a comfortable and safe workplace, free from occupational hazard and pollution, kaizen activities can be extended to the sustainability of processes, including the pursuit of efficiency in the use of materials and energy, the prevention of pollution and workers’ safety (avoiding electric shocks, fires, leaks and spills).
Research hypotheses
LM and environmental sustainability performance
At first, one might think that LM and environmental sustainability in manufacturing are two unrelated fields. On the one hand, LM is widely used by industries primarily to mitigate and eliminate all types of ‘waste’ (non-added value) and to improve productivity as a way of enhancing organizational competitiveness. 19 On the other hand, environmental sustainability is made up of environmentally friendly practices such as pollution prevention and product stewardship. 21
However, in the 1990s, various researchers identified similarities between the fundamentals of LM and those of environmental management: LM starts with identification of the different types of muda while environmental practices start with the identification of sources of pollutants and so on, and both approaches try to ‘do more with less’. 8 Environmental issues such as excessive usage of materials or energy are also muda from the point of view of LM. 22 Also, lean attitudes such as continuous improvement and operator engagement can further improve a plant’s environmental performance. Based on the above conjectures, the ‘lean and green’ hypothesis has gradually become more prominent in the literature.
These rhyming words were first mentioned together in 1993 in an IMVP research paper 23 in which the main thesis was that when a company adopts LM, the capacity of its operation units for supporting environmental management increases. Three years later, Florida 24 states that companies adopting advanced production systems (such as LM) are capable of simultaneously making improvements in productivity and environmental issues. This suggests that companies can simultaneously and continuously improve operational efficiency and environmental sustainability in a synergetic mode.
However, LM focuses on production rather than on the environment, which leads both academics and practitioners to question whether LM truly has any effects on a company’s environmental performance. Among the main research methodologies found in a review of the literature, 6 30% were case studies, 25% were conceptual papers, approximately 17% were empirical quantitative studies and 10% were literature reviews (these values may vary slightly in other studies). 25 Conceptual papers and case studies show a positive relationship between LM and environmental sustainability performance.26,27 Some papers 28 suggest that certain LM practices can be adopted to improve a company’s environmental sustainability performance. However, empirical quantitative studies have yielded mixed results25,29 and are difficult to compare because different methods and variables are employed. For example, an early study by Rothenberg et al. 30 found that the relationship between LM and some performance measures such as reduction of volatile organic compounds (VOCs) was not significant, although interviewees strongly supported the ‘lean and green’ hypothesis. Strange though it may seem, this paradox is consistent: LM is made up of different practices (e.g. quality management), and each one may have an influence on environmental sustainability performance.31,32 In the above case, LM was seeking a better quality paint process, which pushed up VOC concentration. Therefore, if LM practices are mixed as a single variable or data are collected from different areas or industries, test results may differ.
Since interest in fields such as LM or environmental sustainability does not decline, the number of articles published annually on the ‘lean and green’ topic has been increasing since 2007, especially in the last five years (mid-2014 to mid-2019).6,25,33 Based on the above facts, the following statement introduces the first research hypothesis, H1a:
H1a. The levels of implementation of different LM practices are positively correlated to the levels of different ‘green’ environmental sustainability measures.
TPM and environmental sustainability performance
In the lean-and-green literature, the effect of some lean practices on sustainability has been considered. 27 However, TPM has not been the subject of much study. 25 In the Environmental Protection Agency (EPA) report, 34 which greatly contributed to the dissemination of the ‘Lean and Green’ paradigm, TPM is mentioned and defined as one of the eight core lean methods. TPM is an innovative approach to equipment maintenance involving maintenance personnel and operators working in teams to focus on eliminating equipment breakdowns and equipment-related defects. 35 However, the environmental benefits of implementing TPM are not clear. Fliedner 36 affirms (with no empirical evidence) that the environmental benefits of TPM are longer life for equipment, less need for replacement equipment and fewer associated environmental impacts, because the decreased number and severity of spills and leaks result in less environmental damage.
The same ideas are shared by Dieste et al. 25 In their review of the literature, they consider six papers on the effects of TPM on the environment and conclude that advanced maintenance is an environmental improvement facilitator as it reduces machine-associated impacts such as air emissions, leakage and noise (which is a form of pollution too). Besides, TPM avoids machine failures that may generate scrap and extra resource consumption.
The environmental contributions of TPM are present in several case studies.26,27,37–39 Vais et al. 26 mention TPM but concentrate on quality certification and other lean practices such as kaizen. Chiarini 37 explains the measurable benefits related to TPM in five European companies. Daily autonomous maintenance dramatically reduced leakage. All the companies in his study observed a reduction of emissions (dust and fumes such as VOCs, isocyanates and ammonia) resulting from more effective maintenance of the machines. It was not possible to measure whether there were any electricity savings at cell level. Piercy and Rich 38 study the operational practices of five British manufacturers who implemented lean or green driven transformations. They highlight the importance of worker engagement and conclude that all transformations had a common pattern. TPM was present in four cases and contributed to waste reduction. Resta et al. 39 include TPM as one of the dimensions of LM in their conceptual model about the effect of LM on the triple bottom line. However, the model is only tested by means of qualitative interviews. The paper concludes that the environmental impacts of TPM are lower waste and lower resource consumption. Cherrafi et al. 27 present the results of the application of a lean six sigma–green framework (in which TPM is included) in four companies. They include TPM in their framework because, according to the references they reviewed, TPM can (1) extend the life of equipment thus reducing the need for replacement equipment and associated environmental impacts; (2) encourage preventive maintenance to reduce scrap, energy and wastage and (3) increase worker health and safety and often reduce consumption of energy and other resources. The four companies examined in the article experienced significant reductions in energy consumption and resource usage, 27 but it is not possible to relate each single LM practice to a specific portion of the environmental improvements.
Finally, Garza-Reyes et al. 40 concerned by the lack of survey-based papers – as ratified above by the authors of this paper – study the relationship and effect of several lean practices (including TPM) on environmental sustainability performance using structural equation modelling with data from 250 manufacturing companies. They found that TPM is one of the lean practices that has the strongest significance for environmental sustainability performance. The second research hypothesis, H1b, is as follows:
H1b. The level of implementation of TPM is related to the level of each environmental performance indicator.
The relationship between environmental pressure, environmental certification, LM practices and TPM
Besides exploring the relationship between different LM practices, especially TPM, and environmental sustainability performance measures to clarify the influence of such practices and TPM implementation, this article also investigates the implementation antecedents of LM practices and TPM.
There are two main factors behind LM implementation. The first is the perceived degree of pressure from stakeholders demanding that the plant become green. Specifically, environmental pressure is placed on firms through market competition, cultural trends such as eco-friendliness, legal regulations and green supply practices. 41 When environmental pressure increases, manufacturing plants must face such demands and companies may also have to deal with social disapproval (e.g. because of inappropriate behaviour).42,43 Although implementation resources and economic costs may be a burden for manufacturing companies, in order to face up to environmental pressure, plants maybe be urged to implement LM practices and TPM. 10
In addition to environmental pressure, manufacturing companies may have greater environmental awareness (whether they perceive pressure or not) and want to demonstrate their social responsibility. If they can achieve environmental certification (the ISO 14001 standard being the most usual form), 43 they not only obtain an efficient environmental management system but also social recognition. They may implement LM practices and TPM to improve internal organization and external relationships along the supply chain 11 in an effort to achieve the environmental certification and enhance their public image. These two elements can be viewed as the main environmental drivers of LM practices and TPM implementation. Based on the above reasoning, hypotheses H2a and H2b are proposed as follows:
H2a. Environmental pressure (from stakeholders) to go green is a main environment-related factor and antecedent of implementation of TMP and other LM practices.
H2b. Environmental certification is a main environment-related factor and antecedent of implementation of TMP and other LM practices.
Methodology
Sampling and data collection
In order to test the proposed hypotheses, data from the IMSS are used. IMSS is a worldwide research project carried out since 1992 by an international group of researchers in order to identify the strategies, practices and performance of manufacturing firms worldwide. 44 Data for this study were taken from the sixth round of the survey (2013), the latest one so far. Data from previous editions of the IMSS have been used in a number of peer-reviewed works and some have been published in leading journals.44,45
Since IMSS is a proprietary database, only international partners who participated in administration of the survey have access to the data bank. According to the United Nations’ International Standard Industrial Classification (ISIC) revision 4 (2008), the survey focuses on the so-called ‘innovative’ industries from section c, divisions 25 to 30: 25. Manufacture of fabricated metal products, except machinery and equipment 26. Manufacture of computer, electronic and optical products 27. Manufacture of electrical equipment 28. Manufacture of machinery and equipment not elsewhere classified 29. Manufacture of motor vehicles, trailers and semi-trailers 30. Manufacture of other transport equipment
Up to 931 manufacturing plants from 22 countries (mainly from Europe but also from all other continents except Africa) participated in the sixth survey. Before being released, the database was checked for non-response bias, and results showed no significant differences. Because this article focuses on the relationship between lean practices and environmental sustainability, only the companies that answered the related questions were selected (535 valid observations) but, due to the presence of blank answers, each hypothesized relationship to be tested may have a different sample size. However, according to similar studies based on survey data, a sample size of above 500 usable responses is considered to be able to provide meaningful research conclusions. Minitab® 17 statistical software was used to perform all data analyses and hypothesis tests in this study.
Operational measures of the variables
According to the research purpose, questions and hypotheses, three sets of variables were selected: (1) those that refer to LM practices (including TPM), (2) those that refer to environmental sustainability (practices and performance) and (3) those that refer to environmental pressure and environmental certification.
Six items were selected from the IMSS questionnaire to identify to what extent the surveyed plants had implemented six common LM practices:
V11 = current level of implementation of a lean (flat) organization (few hierarchical levels on the organizational chart).
V12 = current level of implementation of continuous improvement programmes (such as kaizen).
V13 = current level of implementation of action programmes related to restructuring manufacturing processes and layout to obtain process focus and streamlining (such as cellular layout).
V14 = current level of implementation of programmes related to undertaking actions to implement pull production (e.g. reducing batches, setup time, using kanban systems).
V15 = current level of implementation of action programmes related to quality improvement and control (e.g. TQM programmes, six-sigma projects, quality circles).
V16 = current level of implementation of action programmes related to improving equipment availability (such as TPM).
IMSS asked respondents about their perception of current implementation of each of these six lean practices. The six items are measured on a 5-point Likert-type scale, ranging from 1 (none) to 5 (high). In the subsequent statistical analyses, these items are considered as ordinal (categorical) variables even though some researchers treat them as continuous.
Variables V12–V16 overlap with the LM practices identified by Abdulmalek and Rajgopal 46 and by Shah and Ward. 15 Flat structures (V11) are mentioned as a lean practice by Dal Pont el al. 47 Losonci and Demeter 45 selected the same variables from the fourth edition of the IMSS to operationalize LM (although other researchers chose a slightly different combination). 44
Eight items from the questionnaire were picked as measures related to environment sustainability. For each one, a 5-point Likert-type scale was used to measure the opinion of the respondent, and each is analysed as an ordinal (categorical) variable:
V21 = pollution emission reduction and waste recycling programmes (effort in the last 3 years). From 1 = none to 5 = high.
V22 = pollution emission reduction and waste recycling programmes (implementation level). From 1 = none to 5 = high.
V23 = energy and water consumption reduction programmes (effort in the last 3 years). From 1 = none to 5 = high.
V24 = energy and water consumption reduction programmes (implementation level). From 1 = none to 5 = high.
V25 = pollution emission and waste production levels (evolution in the last 3 years). Where 1 = increased above 5%; 2 = stayed about the same (±5%); 3 = slightly decreased (–5/–15%); 4 = decreased (–15/–25%) and 5 = strongly decreased (–25% or more).
V26 = pollution emission and waste production levels (performance relative to competitors). From 1 = much higher to 5 = much lower.
V27 = materials, water and/or energy consumption (evolution in the last 3 years). Where 1 = increased above 5%; 2 = stayed about the same (±5%); 3 = slightly decreased (–5/–15%); 4 = decreased (–15/–25%) and 5 = strongly decreased (–25% or more).
V28 = materials, water and/or energy consumption (performance relative to competitors). From 1 = much higher to 5 = much lower.
In the questionnaire, informants were asked to indicate the effort devoted in the last 3 years to implementing, and the current level of implementation of, different action programmes (V21–V24). This request aims to investigate recent performance growth and future implementation plans or targets. With respect to the performance indicators (V25–V28), respondents had to assess their evolution (compared to 3 years before) and the current situation relative to the average performance of the plant’s direct competitors.
Finally, three items from the questionnaire were selected as measures related to environment pressure (V30) and environmental certification (V31 and V32). V31 rates the effort devoted in the last 3 years to implementing action programmes related to environmental certification, and V32 measures the current level of implementation. Each item is rated according to a 5-point Likert-type scale and is treated as an ordinal (categorical) variable in ensuing analyses, since Likert-type scales just assign numerical values to rank qualitative choices:
V30 = perceived level of environmental pressure faced by the company (e.g. stakeholders call for environmental friendly products and processes). From 1 = very weak to 5 = very strong.
V31 = environmental certifications such as ISO 14001 or EMAS (effort in the last 3 years). From 1 = none to 5 = high.
V32 = environmental certifications such as ISO 14001 or EMAS (implementation level). From 1 = none to 5 = high.
Data analysis methods
To test the above research hypotheses and further explain this article’s research questions, several data analysis methods were adopted in this study.
Since all variables used in this research are ordinal variables, it is necessary to run specially conceived nonparametric tests or analyses to handle categorical or ordinal data. First, it is necessary to test whether variables are statistically independent. Then, if they are not, the next step is to test whether there is an ordinal association between them and how strong the association is and to explore the concordance between ordinal categories. To analyse categorical or ordinal variables, a number of statistical tests can be applied: Pearson’s chi-square (χ2) test of statistical independence, likelihood-ratio chi-square test (G2), Cramér’s V, Pearson’s r, Spearman’s rho (ρ or rs), Goodman and Kruskal’s gamma, Kendall rank correlation (Kendall’s τB) and more. Spearman’s rho is the best option for the IMSS data and the research hypotheses because variables have to be measured on a scale that is, at least, ordinal; there is no cause-and-effect assumption (the test is symmetrical); the association test can measure the strength and direction of the monotonic relationship (a linear association is not necessary) between two ranked variables and, finally, it does not involve any assumptions about the distribution of the data (normality is not necessary). Spearman’s rho can range in value from −1 to +1. The larger the absolute value of the coefficient, the stronger the association between both variables.
In the first stage, the ‘lean’ variables (V11–V16) are studied using Spearman’s rank-order correlation in order to measure the strength and direction of the relationship between variables and observe whether they form a construct. In addition to the resulting correlation matrix, Cronbach’s alpha is used to judge the construct’s internal consistency. Next, the ‘environmental sustainability’ variables (V21–V28) are studied the same way. Using the correlation matrix, it is possible to judge the independence of each variable related to environmental sustainability performance. The association between environmental pressure and environmental certification is then measured with the Spearman’s correlation coefficient.
In the second stage, Spearman’s rank-order correlation was used again to build a complete correlation matrix among all the variables (LM practices, TPM, environmental sustainability performance, environmental pressure and environmental certification) in order to further analyse the research hypotheses.
In the third and last stage, although the environmental antecedents of the implementation of TPM and its influence on environmental performance can be explained through the correlation matrix, the proximal relationships between V16 (current level of implementation of action programmes related to improving equipment availability such as TPM) and other categorical ‘environmental’ variables are explored using correspondence analysis because this research on the lean-and-green paradigm started with the alleged benefits of TPM on environmental performance. Correspondence analysis is the nonparametric method analogous to principal component analysis for continuous variables. Correspondence analysis locates all the categories in a Euclidean space, and the first two dimensions of this space are plotted to examine the associations among the categories. The resulting correspondence map provides an image of which categories of a variable are similar to each other or which categories of the two variables are related on two axes (which represent empirically derived dimensions or eigenvectors, not the original variables). The chart can be seen as two overlaid plots, one for each variable. While distances between points of the same variable have meaning, distances between points from different variables do not.
Results and discussion
Association between variables and hypothesis testing
Under the assumption that the six variables (V11–V16) are measuring the same underlying latent variable (called construct or dimension), Cronbach’s alpha coefficient for the six items is 0.8044. This suggests that the six items have a good level of internal consistency (i.e. these items from the IMSS questionnaire measure different aspects of the same concept by means of the correlated responses to these items).
Spearman’s rank-order correlation (Spearman’s rho) was computed to determine the existence of association (nonparametric correlation) and its strength between each pair of variables (Table 1). All coefficients are significantly different from zero at the 0.01 level and thus, besides not being statistically independent, every pair of variables shows a positive correlation (although not a strong relationship). Furthermore, it is possible to state that TPM and the other LM practices are complementary. This means that a manufacturing plant can implement TPM and other LM practices without fearing a conflict among them.
Correlation matrix for lean practices.

Correlation is significant at the 0.01 level (2-tailed).
The second Spearman’s rank-order correlation analysis was run to determine the degree of association among the eight variables related to environmental sustainability (Table 2). Only some coefficients show significant (p < 0.01) correlation between variables. Two groups of variables stand out: V22, V23 and V24 (programmes) and V25, V26, V27 and V28 (performance), but there is no association between variables in one group and variables in the other. While the existence of positive association within each group is coherent, environmental performance indicators seem to be statistically independent from environmental programmes. This cannot be attributed to the lack of success of such programmes. Probably the heterogeneity of the informant companies is responsible for the different behaviours and different results: While an obsolete plant like the ‘grey factory’ can become ‘green’ overnight by investing in appropriate, clean, efficient technology, without any sort of environmental programmes, a modern plant may have environmental plans in place just to sustain its current performance.
Environmental sustainability in manufacturing: association matrix.
Correlation is significant at the 0.05 level (2-tailed).
Correlation is significant at the 0.01 level (2-tailed).
Moreover, V21 shows a negative relationship with V28, but the correlation coefficient is very small and its value depends heavily on the group of questionnaires that is analysed (e.g. those that answer all ‘environmental’ questions, those that answer all ‘environmental’ and all ‘lean’ questions), and it may be either significant (p < 0.05) or not.
To determine the strength of the relationship (nonparametric correlation) among V30, V31 and V32, Spearman’s rank-order correlation was used again (Table 3). All coefficients differ significantly from zero at the 0.01 level, and every pair of variables shows a positive correlation. As expected, there is a strong association between V31 and V32, and since both variables are related to environmental certification, they are two sides of the same coin. So, the higher the perception of environmental pressure, the higher the interest in environmental certification. Stakeholders such as regulators (authorities and agencies), shareholders, employees, customers, neighbours, the local community, environmental groups and the general public may compel a plant to become green. Although simply responding to environmental pressure seems a passive attitude, striving for environmental certification demonstrates a proactive approach. By obtaining ISO 14001 certification, a company can prove to its stakeholders that it complies with environmental regulations and is committed to reducing its environmental footprint. The social benefits of certification include a better company image and improved ‘green credentials’ both of which enhance stakeholder satisfaction. This explains the correlation between V30 and V31 and between V30 and V32. Hopefully, the environmental certification will help diminish environmental pressure.
Association between environmental pressure and environmental certification.

Correlation is significant at the 0.01 level (2-tailed).
Although variables V11–V16 constitute a construct that could be analysed as a single ‘lean manufacturing’ variable, as other researchers have done, to support the aim of this research, Spearman’s rho was used instead to compute the degree of association between each lean practice (variables V11–V16), including TPM implementation (V16), and each ‘environmental’ variable (including variables V21–V28, perceived environmental pressure V30 and environmental certification V31 and V32). Results are shown in Table 4.
Correlation matrix between LM practices and environmental variables.

Correlation is significant at the 0.05 level (2-tailed).
Correlation is significant at the 0.01 level (2-tailed).
Table 4 shows that the level of environmental pressure (V30) is positively correlated with the implementation of some lean variables: continuous improvement (V12), pull production (V14), TQM (V15) and TPM (V16). Companies that feel this pressure from their stakeholders (e.g. environmental regulation) seem to adopt certain lean practices to become greener. In addition, there is a statistically significant positive association between each environmental certification variable (V31 and V32) and each LM practice (V11–V16). There is also a positive correlation between the effort to achieve an environmental certification and each of the lean practices studied.
Significant relationships between TPM (V16) and environmental pressure (V30) and between TPM and certification (V31 and V32) were also found. Based on the above, as planned in the research methodology, the two-way relationship between the five levels of TPM (V16) and the five levels of V30 was explored using a correspondence analysis chart. The study was repeated for the relationships between V16 and V31 and between V16 and V32.
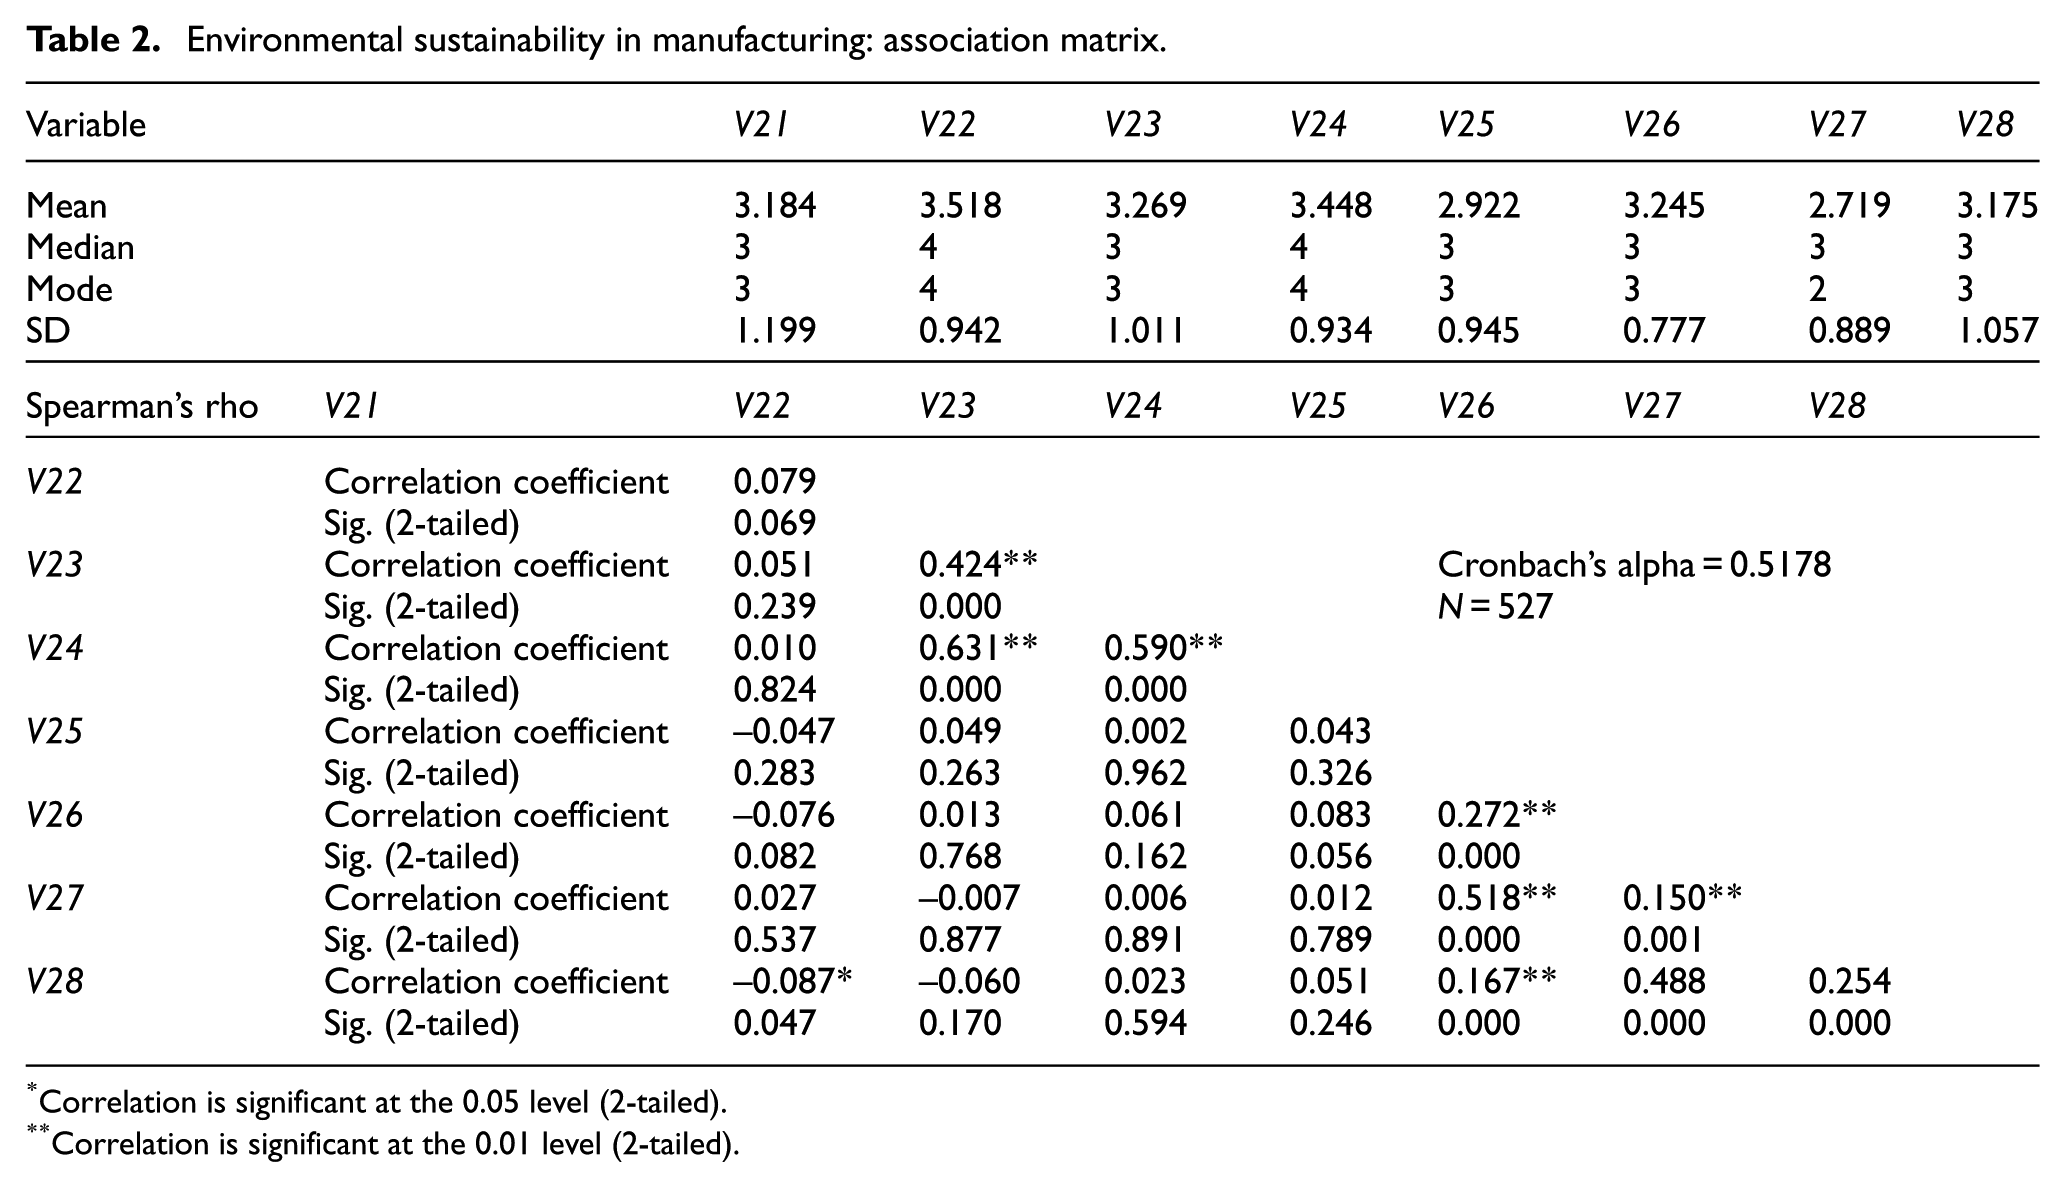
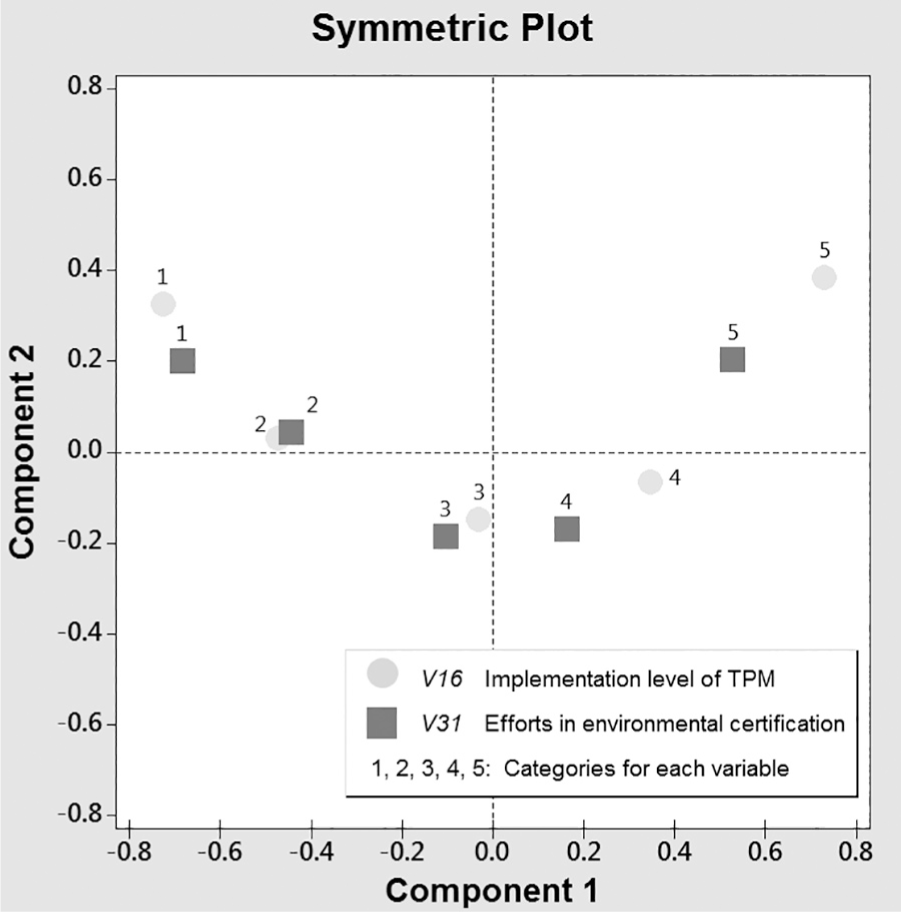
Figure 1 shows the relationship between the five levels of TPM (V16) and the five levels of effort put into environmental certification (V31). In dimension 1 (which explains 79% of total inertia or variance), the categories of both variables (level of implementation and amount of effort) are represented in their correct order from left to right. In consequence, dimension 1 measures the grade. Levels 1 and 2 (the lowest levels) lie on the left side of the vertical axis, level 3 near the origin, and levels 4 and 5 (the highest levels) on the right side. Component 1 best explains levels 1 and 5 (the two farthest from the centroid, with opposite signs). Therefore, component 1 contrasts these two categories. The vertical axis (component 2, 15%) contrasts the extreme levels with the central levels. The extreme levels (1 and 5) of both variables fall above the horizontal axis, while the central levels 3 and 4 lie below the horizontal axis (and both category 2 plots are near the origin). For every possible value, the nth level of TPM is close to the nth level of certification. Both variables show the same behaviour on the correspondence map (with reference to the two axes). The plot shows that more companies with a current level i of implementation of action programmes to improve equipment availability (such as TPM) than one would expect if the rows and columns were independent have a level i of effort put into environmental certification. Figure 2 shows the symmetric plots for V16 and V32. The horizontal dimension (70%) reflects the ordered categories for both variables. Categories 1 and 2 are on one side, categories 4 and 5 are on the other side and category 3 near the origin. The second dimension (27%) shows that categories 1 and 5 have the greatest values of inertia, while category 3 is the smallest (for both variables). In consequence, component 2 measures inertia. Again, variables V16 and V32 have a similar behaviour and reinforce what was previously inferred about the relationship between TPM and environmental certification.
Correspondence analysis chart (row and column points) for TPM implementation level and effort in environmental certification.
Correspondence analysis chart (row and column points) for TPM implementation level and environmental certification level.
Figure 3 shows the relationship between TPM (V16) and environmental pressure (V30). Again, both variables show the same pattern, following a bisecting line (except category 1): the more the environmental pressure, the higher the level of TPM implemented. Dimension 1 (61%) represents the ordered categories of both variables (level of implementation and environmental pressure), with 1 and 2 on one side of the vertical axis; 3 and 4 close to the centroid and 5 on the other side. Variables 1 and 5 have the largest influence. Dimension 2 (28%) especially separates level 1 from level 2 (for both variables). For both variables, level 1 are the rows (and columns) with the lowest counts, but with the highest chi-square value (contributing to the association between variables), so level 1 plots show the largest influence on dimension 1 and dimension 2.

Correspondence analysis chart (row and column points) for TPM implementation level and environmental pressure.
In Table 4, there are not many correlations between LM practices (including TPM) and environmental sustainability indicators. However, when evolution over the last 3 years is analysed, all LM practices, including TPM, show a positive association with emissions reduction and waste recycling programmes (V21). In addition, it was found that the level of implementation of action programmes related to the restructuring of the manufacturing process (V13) and pull production (V14) are positively correlated with energy and water consumption reduction programmes. Finally, continuous improvement (V12) shows a small negative association with the evolution of materials, water and/or energy consumption (V27). For example, continuous improvement may focus on the quality of products, which may require more water, but not on sustainability (water reduction).
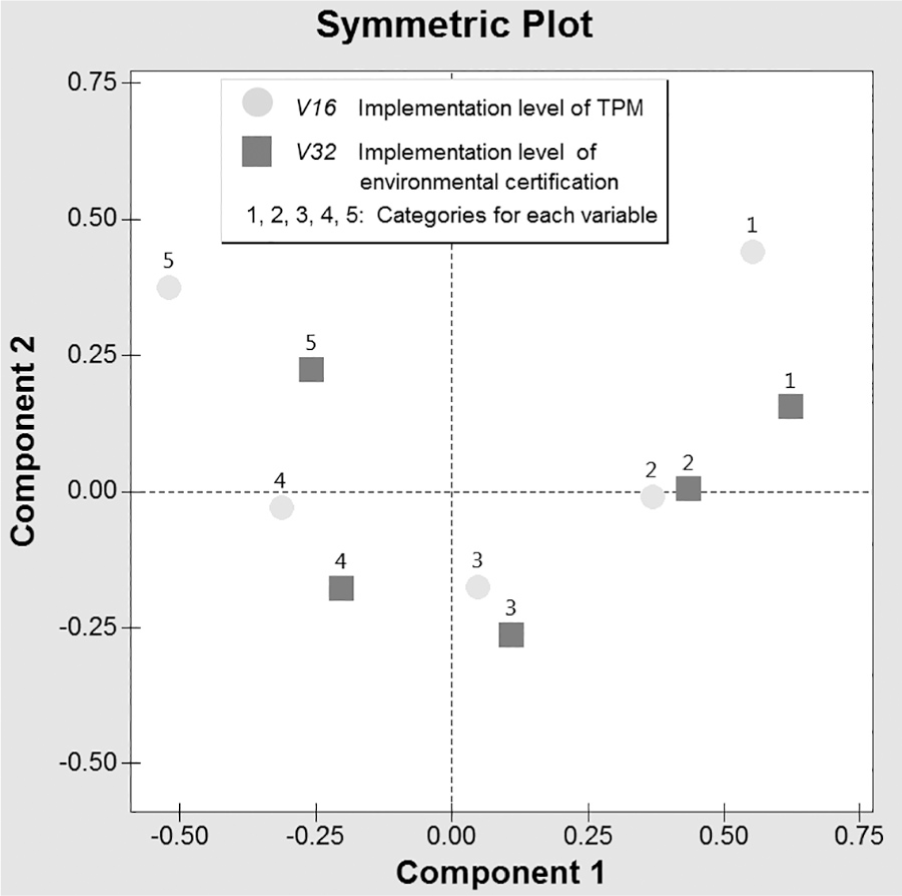
Regarding TPM, a positive association was noticed between emissions reduction and the effort put into waste recycling programmes (V21). Figure 4 reveals that the categories of V16 and V21 follow the same arrangement. Dimension 1 (65%) represents the ordered categories (grade) of both variables. Dimension 2 (24%) separates central levels 3 and 4 (the categories that in each row and column account for a greater proportion of the counts) from levels 1, 2 and 5. Correspondence maps for pairs of variables without any expected associations (according to Table 4) were also drawn up. The results showed different patterns where categories were not ranked along any axis and data were scattered on the chart.
Correspondence analysis chart for TPM implementation level and effort in pollution emission reduction and waste recycling.
According to the results supplied by the beer manufacturer, 7 V27, V23 and V24 were expected to be associated with TPM. However, these associations are not significant. Possible explanations for this result are as follows: (1) According to the description of V16 in the IMSS questionnaire, companies may implement ‘advanced maintenance programmes’ (not including TPM) that focus only on the availability of equipment; (2) even if TPM is implemented, it only focuses on the machinery (keeping it clean and safe), not on environmental aspects and (3) even if TPM helps improve environmental performance, there are many other aspects in the company that may offset the final result. Finally, TPM is not associated with V27 (an environmental sustainability performance indicator for companies that want to be more efficient), but is associated with V21 (an environmental sustainability performance indicator of plants that want to pollute less).
Discussion
The purpose of this section is to interpret and describe the significance of the research findings and to explain the insights that emerge from this study in reference to the research hypotheses and the research questions.
The aim of this study is to explore the environmental antecedents and the influence on environmental sustainability of different LM practices and specially TPM. Therefore, two research questions were explored. The first one relates to the environmental antecedents of lean practices. Are the antecedents of implementation of LM practices and TPM based on environmental pressure from stakeholders? Are they an effort to achieve environmental certification and gain public recognition? On the basis of previous literature, hypotheses H2a and H2b were generated and tested. The other research question refers to the influence of lean practices. It leads to hypotheses H1a and H1b. The influence of each of six different LM practices, including TPM, on each one of eight variables related to environmental sustainability is explored in this article in order to test the latter hypotheses. Analysis of the survey data contributed to the following research findings:
Regarding the environmental antecedents of LM implementation, according to test results from hypotheses H2a and H2b, there is a positive association between the perceived degree of environmental pressure from the company’s stakeholders and the extant level of each of the following lean practices: continuous improvement, pull production, quality management and TPM.
In addition, there is a positive correlation between the level of environmental certification and every lean practice (including TPM). Since there are positive relationships between environmental pressure from stakeholders and each one of the two variables related to environmental certification, an environment-related antecedent of implementing TPM and other LM practices is the environmental awareness of manufacturing companies today.
Regarding the influence of LM practices, results indicate that the effort put into pollution emission reduction and waste recycling programmes is positively correlated with all lean practices and TPM. Process focus (cell manufacturing) and pull production are positively correlated with energy and water consumption reduction programmes, and continuous improvement is correlated with materials, water and/or energy consumption.
Table 4 indicates that levels of continuous improvement, pull production and TQM have a positive association with the perceived level of environmental pressure and that every LM practice has a positive correlation with environmental certification. In addition, according to Table 4 and Figures 1–3, there is a positive association between the level of TPM, perceived environmental pressure, and the effort and level of environmental certification. This might mean that companies that experience great pressure from their stakeholders implement lean practices such as continuous improvement, pull production, TQM and TPM to a greater extent, because such advanced manufacturing practices can allegedly ‘green’ the factory and alleviate the pressure. However, there is a positive correlation between each lean practice and the effort put into environmental certification and the level of environmental certification. Also, lean companies might be more aware of their moral obligation to manage and minimize the impact of their operations (thus feeling a pressure that others ignore): In addition, lean companies are used to implementing new projects so are more likely to achieve environmental certification. This finding is empirically supported by Puvanasvaran et al. 48 who observed that companies that pursued environmental certification had already implemented some lean practices.
Table 3 shows that environmental pressure has a positive correlation with environmental certification (measured by two variables: effort over the last 3 years and implementation level). Thus, the results depicted in Table 3 are in agreement with the empirical finding reported by Del Brío and Junquera. 12 Since companies that are actively seeking environmental certification are well aware of their environmental responsibilities, 13 and based on the empirical results, it can be concluded that manufacturing facilities may feel compelled to implement isolated LM practices, such as TPM, in response to environmental pressure in order to improve their environmental sustainability performance. However, if a plant intends to obtain an environmental certification, then all six LM practices, including TPM, will be implemented in an attempt to align its operations to purported environmentally sustainable practices. Considering the existing relationship between environmental pressure and environmental certification, plants that obtain an environmental certification will feel that environmental pressure diminishes. It can therefore be inferred that the environment-related antecedents of implementation of LM practices and TPM are based on environmental certification. Thus, hypothesis H2a is not supported (environmental pressure alone cannot be considered a main environmental-related antecedent of LM implementation) and hypothesis H2b is supported (environmental certification can be considered a main environmental-related antecedent of LM implementation). These results, in combination with those achieved by Leonidou et al., 13 show that an antecedent of the implementation of LM practices and TPM in manufacturing plants is the fact that, currently, industrial organizations show greater awareness of environmental issues and strive to diminish their environmental footprint.
Regarding the influence of the implementation of different LM practices and TPM, the efforts put into pollution reduction and waste recycling programmes are positively correlated with every lean practice (including TPM). The effort put into energy and water consumption reduction programmes is slightly correlated with process improvement and also with pull production. There is a small negative correlation between continuous improvement and the evolution of materials, water and/or energy consumption, because continuous improvement activities may focus on the efficiency of the production process or on product quality without considering the environmental consequences. Surprisingly, variables related to implementation levels and environmental performance do not show any significant correlation with lean practices. These results may be in accordance with those obtained by Yang et al., 44 who noticed that the relationship between LM and environmental performance might be mediated by environmental management practices (the ‘programmes’ variables in the IMSS questionnaire). This would help explain the lack of correlation that was found in this study, proving that LM is not ‘green manufacturing’ per se, although an environmentally conscious company is likely to take advantage of LM practices. Besides, the IMSS methodology states that these environmental measures refer to implementation plans and to competitors’ performance. Therefore, they are not absolute values, which interferes with the aim of this research.
Consequently, hypothesis H1a is supported, at least to a certain extent. However, since TPM is correlated only with pollution reduction and waste recycling programmes, hypothesis H1b is not supported. Yet these results do not mean that LM practices and TPM cannot help companies improve their environmental sustainability performance. The evolution of environmental sustainability performance indicators over the last 3 years shows that implementing TPM and other LM practices still has a positive effect on performance improvement. Since it has been found that different LM practices (including TPM) clearly have a positive effect on specific environmental measures, is it possible that the influence of TPM and other LM practices on improved environmental sustainability performance has limitations? This is a question that should be explored in future research.
Finally, if the antecedents and influence of TPM implementation alone are studied, the three correspondence analyses confirm the positive association (as measured on two principal dimensions) between TPM and each of the variables related to environmental certification, environmental pressure and effort put into pollution reduction and recycling programmes. Previous findings are therefore reinforced, and it can be stated that manufacturing plants may implement TPM to support their greening process with a view to obtaining environmental certification. After implementation, TPM becomes a part of the company’s pollution emission reduction and waste recycling programmes. Companies that implement TPM for environment-related purposes usually show greater environmental awareness.
Conclusion
The purpose of this study was to explore the environmental antecedents and the influence on environmental performance of six common LM practices, including TPM. Two research questions were explored. The first question is as follows: Are the environment-based antecedents of implementation of LM practices and TPM based on environmental pressure from stakeholders or on the desire to achieve environmental certification and public recognition? The second one is regarding the influence of different LM practices and TPM on several variables related to environmental sustainability. The results of the corresponding statistical analyses and research findings show that
Although the implementation of a number of LM practices (including TPM) in some companies can be explained by the perception of environmental pressure, each one of the six LM practices studied (including TPM) is correlated with environmental certification.
Considering the relationship between environmental pressure and certification, and the relationship between environmental awareness and certification, an environment-related antecedent of the implementation of LM practices and TPM is that today manufacturing companies are committed to sustainable development.
Specific LM practices are correlated with specific environmental measures. However, the relationship between LM practices and environmental performance as a whole is not supported.
According to the informants’ perceptions, the implementation of LM practices and TPM has had a positive effect on performance improvement over that last 3 years.
The following are some practical and academic implications of this work. The correlation between lean practices, environmental pressure and environmental certification effort will help companies understand how effective it is to implement LM practices such as TPM if they pursue an environmental certification. This is mainly because most manufacturing companies are well aware of the significance of sustainability for their industry. This article’s findings will help companies understand how six different LM practices, including TPM, can help improve environmental sustainability performance, and how to select suitable LM practices for this purpose. Also, the results of the study of environment-related antecedents of LM implementation and the influence of LM allow a theoretical framework to be developed. Such a framework will help disseminate the knowledge gained from previous research.
Although this study attempts to make a valuable contribution, it still has several limitations. First, its findings can help to develop a theoretical framework, but exploring such a framework is beyond the scope of this paper. Second, this work explored data using only simple measures of association, but now the model should be tested using state-of-the-art methods, such as structural equation modelling and path analysis. Third, results on the influence of LM on environmental sustainability show that the reality is not as simple as one would like, and ‘lean’ is not intrinsically ‘green’. In consequence, this issue needs to be further explored beyond the limits of the IMSS questionnaire. These three limitations indicate some possible directions for future research. On the one hand, antecedents and influences may be explored in greater depth and, on the other, different statistical tools may lead to different results. Finally, whether or not there is a limit to the influence of LM practices and TPM on the improvement of environmental sustainability performance should be verified.
Footnotes
Handling Editor: Munish Gupta
Declaration of conflicting interests
The author(s) declared no potential conflicts of interest with respect to the research, authorship, and/or publication of this article.
Funding
The author(s) disclosed receipt of the following financial support for the research, authorship, and/or publication of this article: Dr. PK Chen received financial support for the publication of this article from the National Natural Science Foundation of China (NSFC Grant: 71872131).