
Abstract
To calculate the ultimate load of the lattice boom accurately, the effective length factor and imperfection factor are introduced to the current stability factor formula. First, we propose a stability factor formula by conducting a series of tests of high-strength steel tubes under axial compression and analyzing the experimental data. Second, the effective length factor of the chord which is caused by braces is calculated on the basis of different effective length factors and stability curves. Then, the correctness of the proposed effective length factor and the stability factor formula are proved by destructive tests under three loading modes. Using the modified stability factor formula, the accuracy of ultimate load of lattice boom is enhanced. These findings will be of great value for improving the design level of lattice boom and providing a theory and test basis for the completion of the buckling design method of the high-strength steel tubes.
Introduction
Crawler cranes possess numerous advantages, such as the great lifting capacity, little ground pressure, small turning radius, excellent climbing ability, non-outrigger design, and ability to drive with load and exceptional stability. Because of advantages mentioned above, such machine is widely used in constructions of electric power, municipal, bridge, petrochemical, water conservancy, and hydropower facilities. Lattice boom, consisting of the main boom, fixed jib, and luffing jib, is the most crucial part of the crawler crane, whose carrying capacity determines the performance of the crawler crane.1,2 Therefore, the carrying capacity of lattice boom has become one of the key studies for research scholars and technical staff. 3
Chu et al. 4 showed us the design and assembly process of crawler cranes, which made us more clearly know the internal structure of crawler cranes. When a crawler crane is working, lattice boom is mainly under combination of compressive and bending stresses. The failure forms of the chord include corrosion, fracture, fatigue, instability, and so on5–8 among which instability is the most important form, as shown in Figure 1. To track down the influence factors that lead to the instability of the chord, effective length and stability factor of the chord should be considered.

Instability example of lattice boom.
The chords and braces of a lattice boom are welded together. The braces restrict the longitudinal displacement at the connecting joints and bending deformation of chords, both of which cause the concept of chord’s effective length of brace, although the bending deformation of chords is often neglected. Therefore, the effective length is considered as the geometry length between joints, and the effective length factor is regarded as 1.9–11 However, the effective length of the chord is less than the geometric length between joints.12–17 In these literature studies, the fixed effective length factor was given and a simplified formula was proposed without considering the details of the chords and braces. The effective length factor of compression members with hollow section under compression was taken as 0.9 in literature.11–14 Bleich 15 has proposed an effective length factor calculation formula that was only related to the span number based on stability theory. Few years later, Cheng et al. 18 put forward another calculation method concerning the details of the chords and braces. The restrictions of the braces in the horizontal and vertical planes of the cross-type lattice boom were also analyzed, which showed that braces in both planes could influence the buckling load of the chords. Nevertheless, compared with the restriction of in-plane braces, the influence of out-of-plane braces was much smaller, even negligible. Similar conclusions can be obtained in literature. 19
What is more, the stability factor was acquired from the stability curves in corresponding standards, such as Eurocode 3 or GB50017-2003. Nowadays, high-strength steel was used for the chords and braces of lattice boom. While the stability curves in the standards were based on the test and analysis of carbon steel members, 20 the carrying capacity of the lattice boom calculated with these stability curves was too conservative. In Eurocode 3, the stability curve a shall be selected for hot-rolled compression members of grade below S420, but the higher stability curve a0 can also be selected for hot-rolled compression members of grade S460. In recent years, the ultimate load of high-strength steel members has been studied more intensively. Wang 20 conducted an experimental study on the ultimate strength of welded box-columns with nominal yield strength of 460 MPa under axial compression, followed by an extensively parametric study considering the geometric imperfections and residual stresses. By comparing the theoretical curves with the design curves specified in Eurocode3 and GB 50017-2003, it was found that the currently adopted design curves have underestimated the ultimate carrying capacity of the welded box-columns fabricated from 460-MPa high-strength steel plates by 18.7% and 23.2% on average, respectively. Experiments and analyses were conducted by Rasmussen and Hancock, 21 Ban et al.,22,23 and Shi et al. 24 on the overall buckling behavior of I- and box-section specimens welded with 460- and 960-MPa high-strength steel, which illustrated that the corresponding column curves in current design codes have also underestimated the dimensionless buckling strength of high-strength steel columns.
These research studies, however, mainly focused on the independent member welded with high-strength steel, and the carrying capacity of lattice boom was relatively less studied meanwhile. Bolt et al. 25 summarized some of the early research results mainly for the X-type and K-type planar frame. Therefore, a better actual carrying capacity of lattice boom can be expected since both the effective length factor and stability curve showed the room for improvement, and both needed further experiments to verify.
In this article, the carrying capacity of lattice boom was studied in terms of chords’ effective length factor caused by the braces and the stability curve of high-strength steel tubes. First, a series of experiments were conducted by putting two sets of steel tubes under axial compression, and the formula of the stability factor was obtained by fitting experimental data. Furthermore, the effective length factor was calculated by solving transcendental equation, and then, the ultimate loads of every lattice boom were determined with different effective length factors and stability curves, respectively. Finally, destructive tests under three loading modes were carried out to obtain actual failure loads and modes of eight intermediate sections. Based on the stability coefficient formula, the effective length factor and imperfect factor were introduced, and a more practical formula for calculating the ultimate load of lattice boom was proposed. The modified formula is more practical in the calculation of ultimate load, which is helpful in improving the design level of the lattice boom and providing a theory and test basis to complete the buckling design method of the high-strength steel tubes. We also proposed a practical stability factor formula for the ultimate loads of lattice boom, which is of great value in the design of lattice boom.
Tests of tubes under axial compression
Experiment of tubes under axial compression
To achieve fixed-pinned end conditions, the knife edge was selected after comparing several pinned end schemes mentioned in literature. 26 The chosen scheme of axial compression experiment was shown in Figure 2. To ensure the effectiveness of the experimental data, two sets of tubes with different specifications and materials were selected for the axial compression test. Specifications, length ranges, and materials of tube specimens were listed in Table 1.

The scheme of axial compression test.
Specifications, length ranges, and materials of tube specimens.

Mechanical properties of each material were obtained from the mechanical performance experiments, which are shown in Table 2. Specimens cut from tubes for the experiments were shown in Figure 3. Meanwhile, the experimental results proved that the yield strength of each material in Table 1 was reliable and would be used in the following calculations.
Mechanical property test data of two materials.
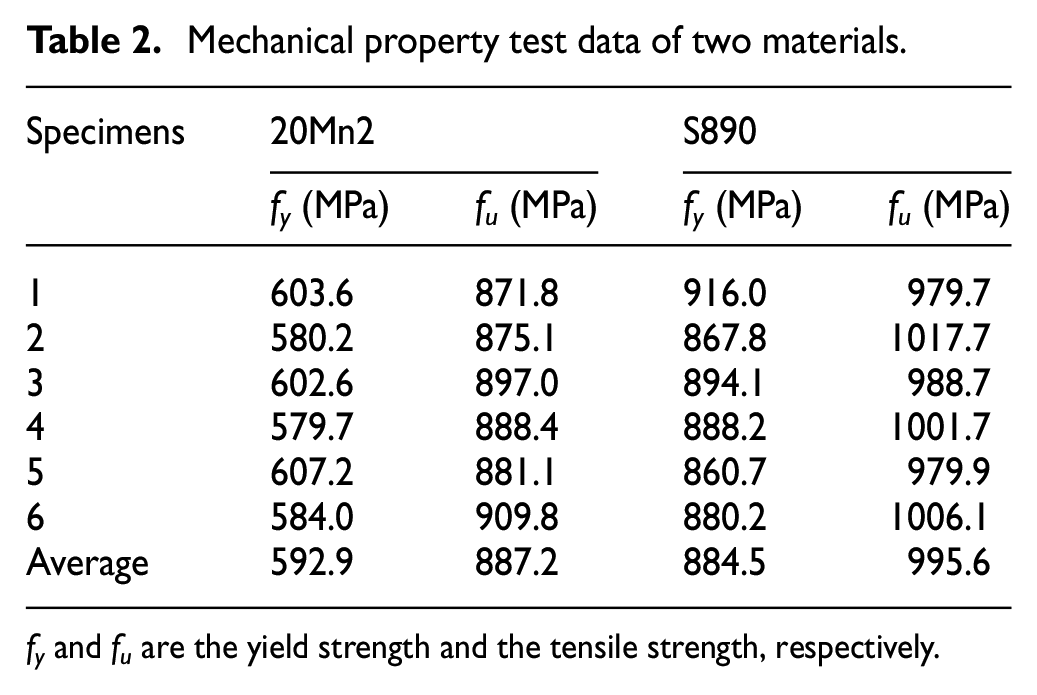
fy and fu are the yield strength and the tensile strength, respectively.
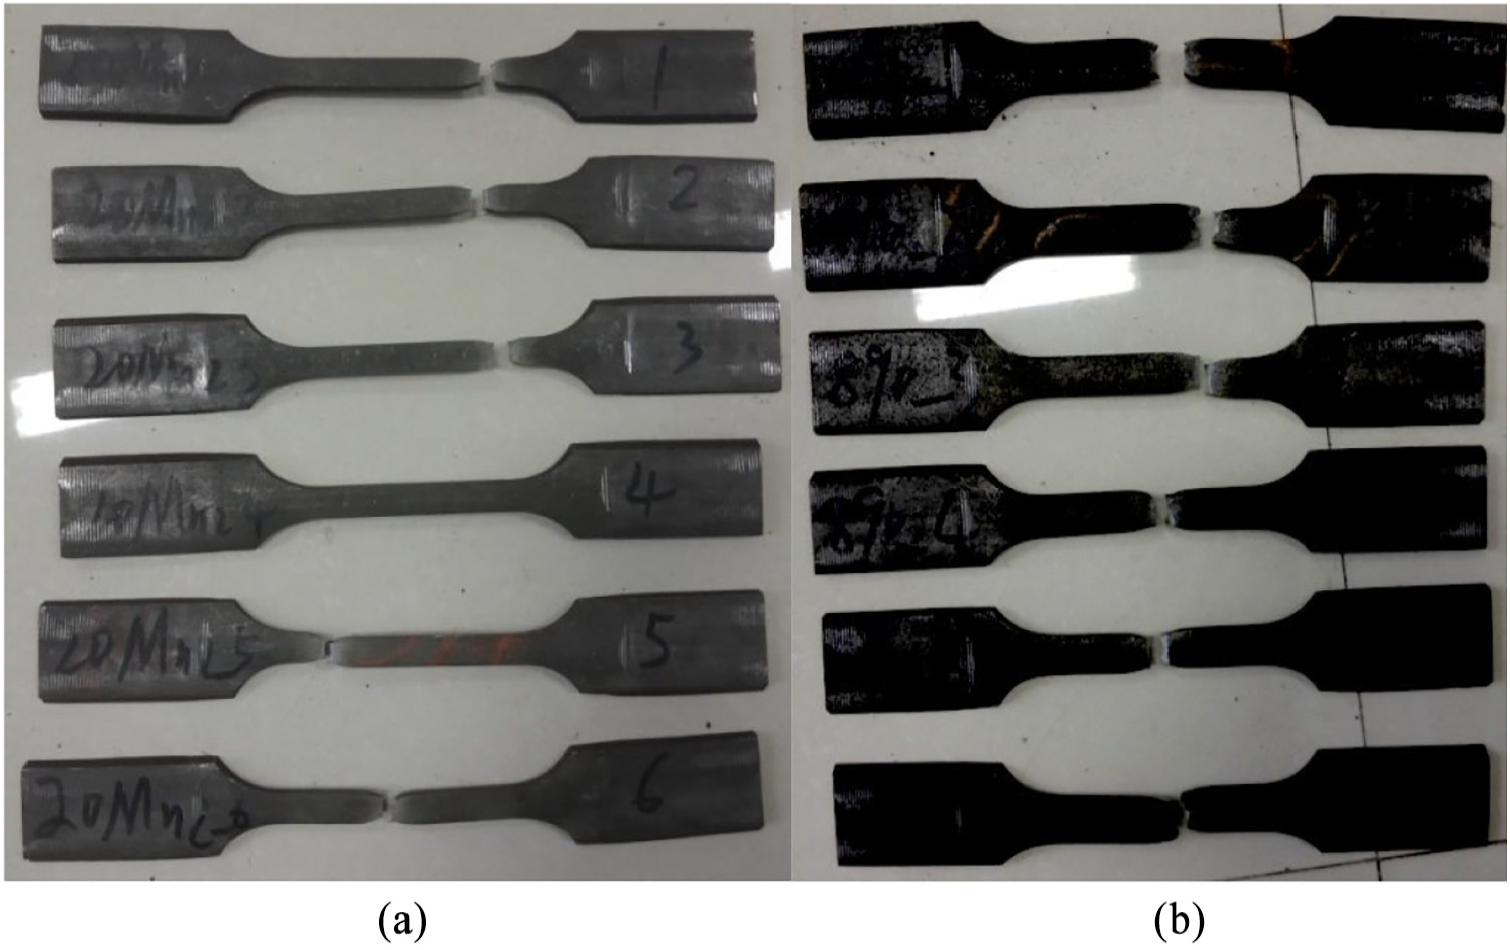
Specimens for mechanical performance experiment. (a) Specimens of 20Mn2. (b) Specimens of S890.
Experimental data and stability curve fitting
The carrying capacity of the high-strength steel hot-rolled hollow circle tubes used in the experiments should be calculated according to curve a0 of Eurocode 3 or curve a of GB50017-2003. Both European and Chinese specifications of 18 20Mn2 steel tubes were shown in Table 3, including measured lengths, outer diameters, thicknesses, and so on. The ultimate loads calculated with the different buckling curves and failure loads were given in Table 3 as well. Similar information of 21 S890 steel tubes can be found in Table 4. It can be seen that the actual carrying capacity of the steel tubes was higher than ultimate load calculated with curve a0 of Eurocode 3 and curve a of GB50017-2003, especially for short members, whose carrying capacity was at least 6% higher than ultimate load calculated with curve a of GB50017-2003.
Ultimate loads of 20Mn2 tube specimens.

Ultimate loads of S890 tube specimens.

The fact that the carrying capacity of high-strength steel tube has been underestimated by stability curves in the standards made it necessary to perform curve fitting to obtain an actual stability curve. The stability factor formula form of Eurocode 3 was selected for the fitting formula, which was shown as follows

where

where λ is the slenderness ratio of the member, fy is the yield strength, and E is the elastic modulus of the material.
Determined by curve fitting, the indeterminate imperfection factor

Comparison of fitting stability curve with stability curves in standards.
Calculation of ultimate load
Intermediate section is the most typical and simple type of lattice boom, carrying capacity of which can represent that of lattice boom. The 6-m intermediate section of fixed jib used in QUY220 crawler crane was selected as the research object. The intermediate section was shown in Figure 5. The total length L was 6000 mm, height h in the longitudinal plane was 1000 mm, width b in the transverse plane was 1200 mm, chord’s specification was Φ 65 × 4, and the yield strength was 590 MPa. Brace’s specification in both planes was Φ 30 × 2.5, whose material was the same as the chord. The braces were arranged in cross-type, and length lC between each joint was 1389 mm, as shown in Figure 5. Hence, the chord’s cross-sectional area AC was 766.6 mm2, whose inertia moment IC was 358,074 mm4. The brace’s cross-sectional area AB was 215.9 mm2, whose inertia moment IB was 20,585 mm4.

The scheme of intermediate section.
Calculation of effective length factor
The chord was simplified as a multi-span continuous beam on rigid hinged supports in the traditional method, and its corresponding buckling model is shown in Figure 6(a). The buckling model, considering restriction of braces in both planes in the literature, 18 was shown in Figure 6(b), where α is the rotational restraint stiffness of in-plane brace and k is the translational stiffness of out-of-plane brace. Compared with the restriction of in-plane braces, that of out-of-plane braces was much smaller, even negligible. The final buckling model was shown in Figure 6(c).

Buckling model of the chord. (a) Buckling model in traditional method. (b) Buckling model considering braces in both two planes. (c) Buckling model only considering in-plane braces.
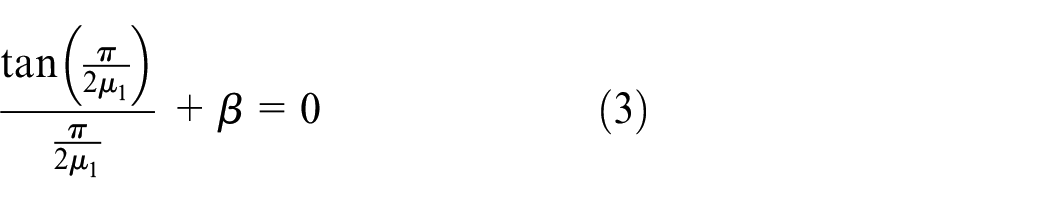
According to the conclusions of literature studies,18,27 the effective length factor μ1 can be obtained by the following transcendental equation
where β is the ratio between the properties in the transverse or longitudinal plane of chord and brace. The value of effective length factor μ1 can be obtained using a simplified equation as follows

where μcon is the indeterminate constant, which is determined by curve fitting, and μcon is 0.8226. From the comparison of solutions calculated from equations (3) and (4) as shown in Figure 7, the accuracy of the solution was proved.

Comparison of solutions calculated from equations (3) and (6).
For the lattice boom in the present work, the ratio

The ratio

The ratio formulas above have shown that the chord’s effective length factor is related to the length lC between joints, the chord’s inertia moment IC, the lattice boom’s height h or width b, and the brace’s inertia moment IB. According to equation (4), the effective length factor μ1Y in the transverse plane is 0.9573, and the effective length factor μ1Z in the longitudinal plane is 0.9519.
Calculation of carrying capacity
Different ultimate loads can be calculated with different effective length factors and stability curves. Up to now, there are three types of effective length factors, 1 in the traditional method, 0.9 recommended in Eurocode 3, and the specific factor calculated by the dimensions of the chord and brace. The stability factors calculated with different effective length factors and stability curves are listed in Table 5. The allowable stress of chords is 400 MPa, which can be used to calculate their safe carrying capacities, as listed in Table 5.
Stability factors and carrying capacity calculated with different conditions.

Loading tests of eight intermediate sections
The test platform and installation of intermediate section
The test configuration is illustrated in Figure 8. First, a fixed rigid wall was installed on the platform, with four 1000-kN hydraulic actuators connected to it. Then, a movable rigid wall was also connected to it using four connecting beams. Each beam was composed of several I-type beams with different lengths. After that, two lateral rigid walls were fixed on the platform, and two box-section beams were installed between them to hang the four actuators with eyebolts, which were released once the intermediate section had been installed between the four actuators and the movable rigid wall with pins. Finally, four hydraulic actuators weighed 1000 kN were used to load the intermediate section axially.
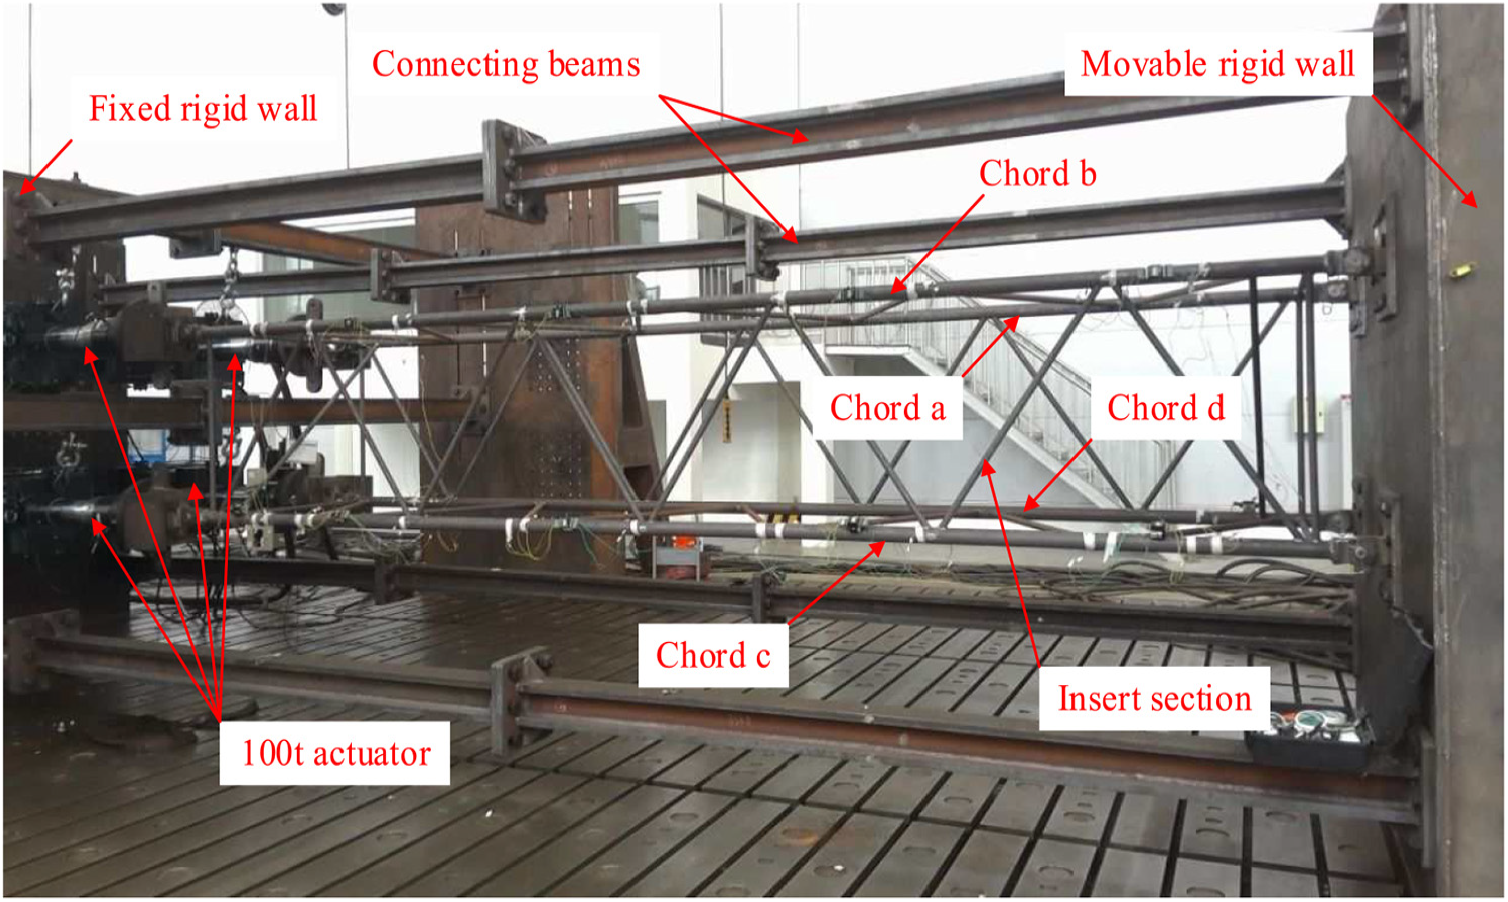
The scheme of intermediate section setup.
Loading modes
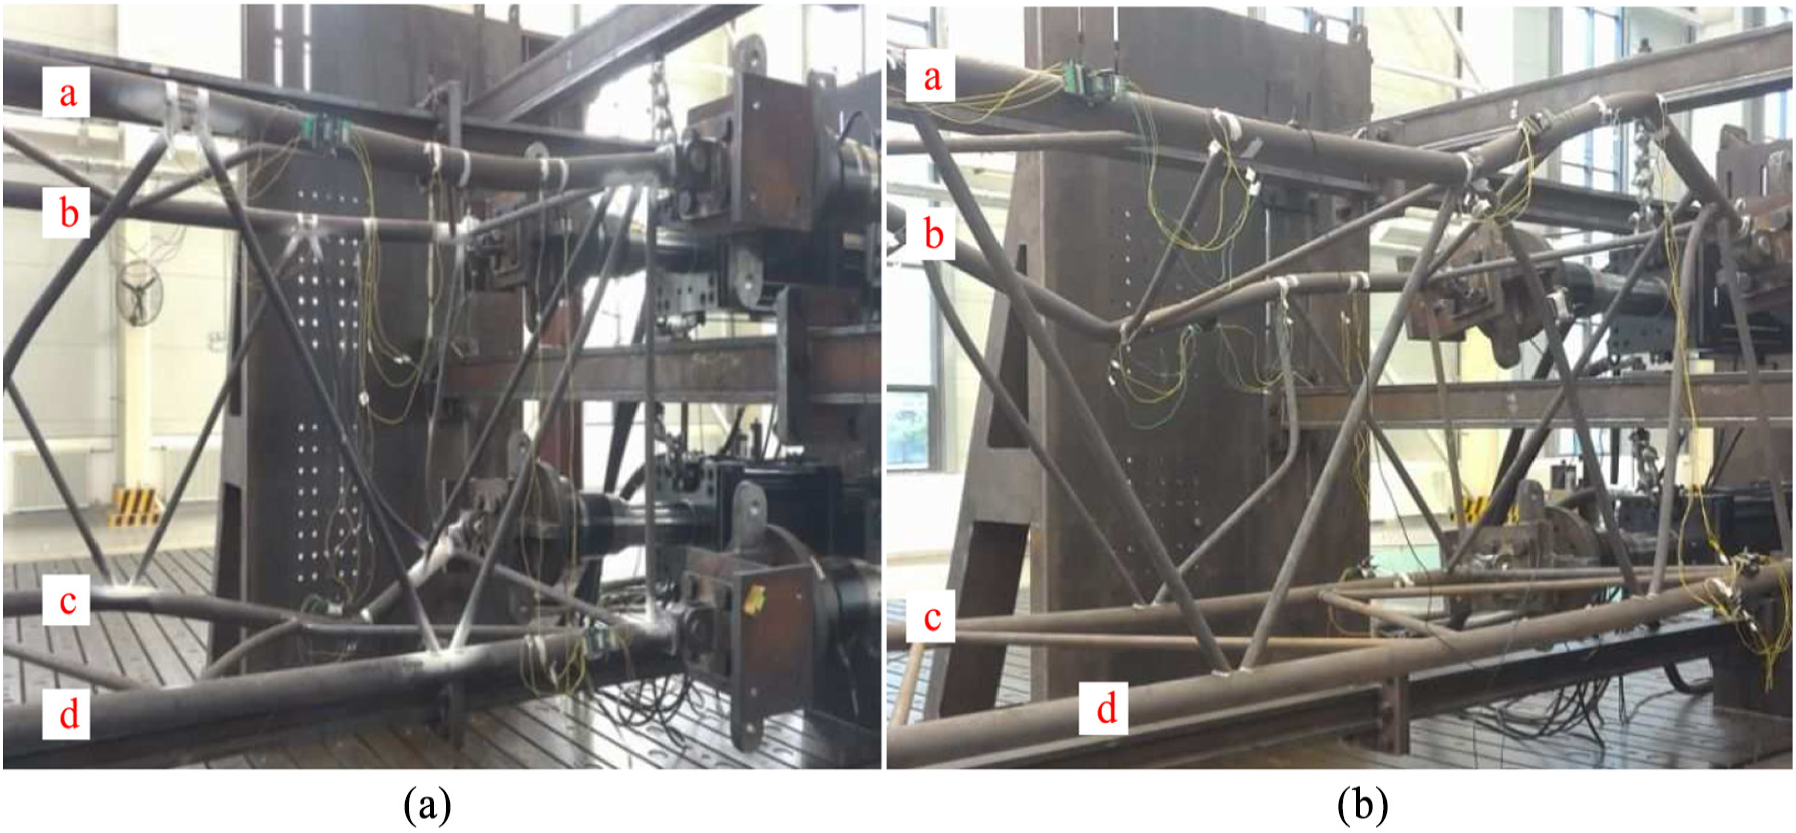
Hosting case and boom lifting case were two main loading modes for lattice boom. In hosting case, the boom was in bidirectional bending condition with different forces on four chords. In boom lifting case, the boom was unidirectional bending and the forces of the two upper chords differ from those of the two lower ones. In comparison, an ideal uniform mode was chosen as a loading mode in the test. Loading proportion of the hosting case came from maximum load case of the shortest fixed jib, and that of the lifting case came from lifting of the longest fixed jib. Loading proportions on four chords in the three cases were listed in Table 6.
Loading proportion on four chords.
Negative numbers represent compression, and positive numbers represent tension.
Test results
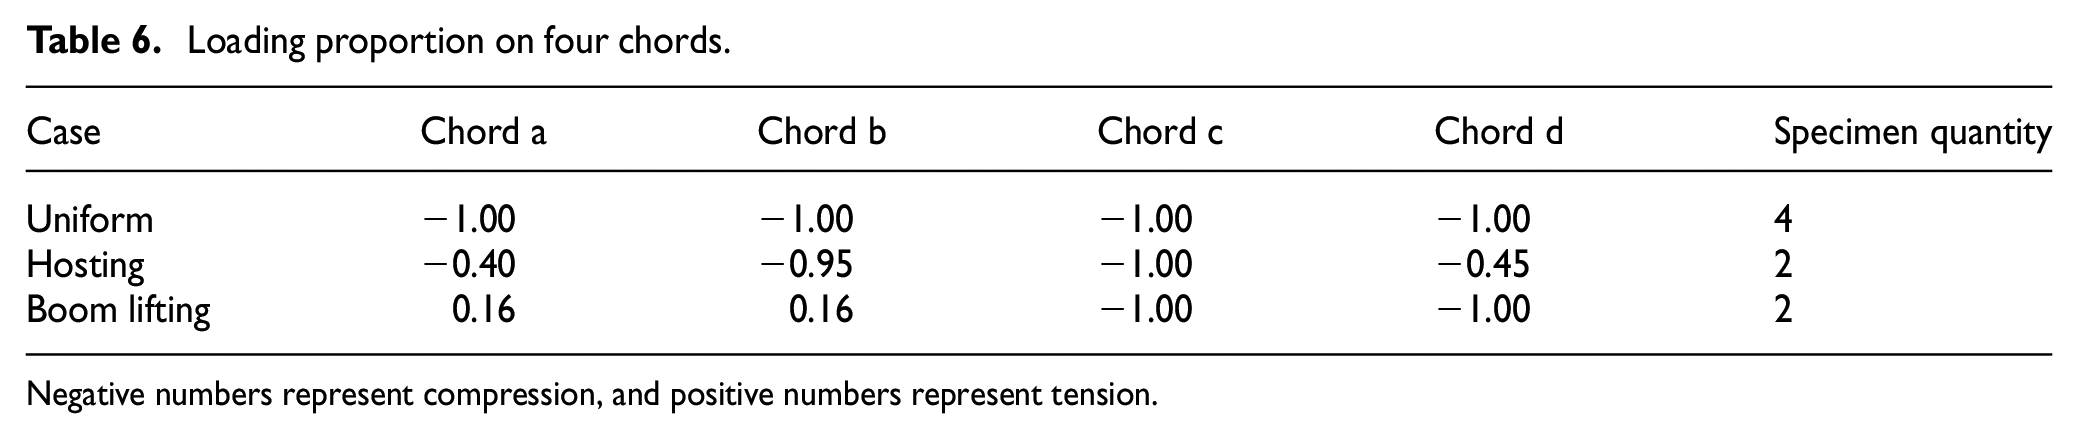
The first four intermediate sections were under the ideal uniform case. The fifth and sixth intermediate sections were under the hosting case, and the seventh and eighth, under the boom lifting case. All intermediate sections buckled under axial loading. Instability destruction was found in the longitudinal plane and on the loading side under all the ideal cases, and maximum deformations were located near the connecting joints of chords and braces.
The failure loads of the first four intermediate sections under the ideal case were 330.0, 310.0, 376.0, and 342.0 kN, respectively, whose failure modes were shown in Figure 9(a)–(d). The failure modes of the first and fourth intermediate sections were similar, with very obvious deformation on the chord a and d. In the second and third intermediate section, however, deformation occurred on the chord a and the chord b and c, respectively. Under the hosting case, the failure loads of two intermediate sections were 395.0 and 360.0 kN, respectively, as shown in Figure 10(a) and (b), and maximum deformation occurred on chord b and c whose loads were larger. Under the boom lifting case, the failure loads were 378.0 and 369.0 kN, respectively, as shown in Figure 11(a) and (b), and maximum deformation occurred on chord a and b, whose loads were larger.

The failure mode of all intermediate sections in uniform case. (a) The first intermediate section. (b) The second intermediate section. (c) The third intermediate section. (d) The fourth intermediate section.
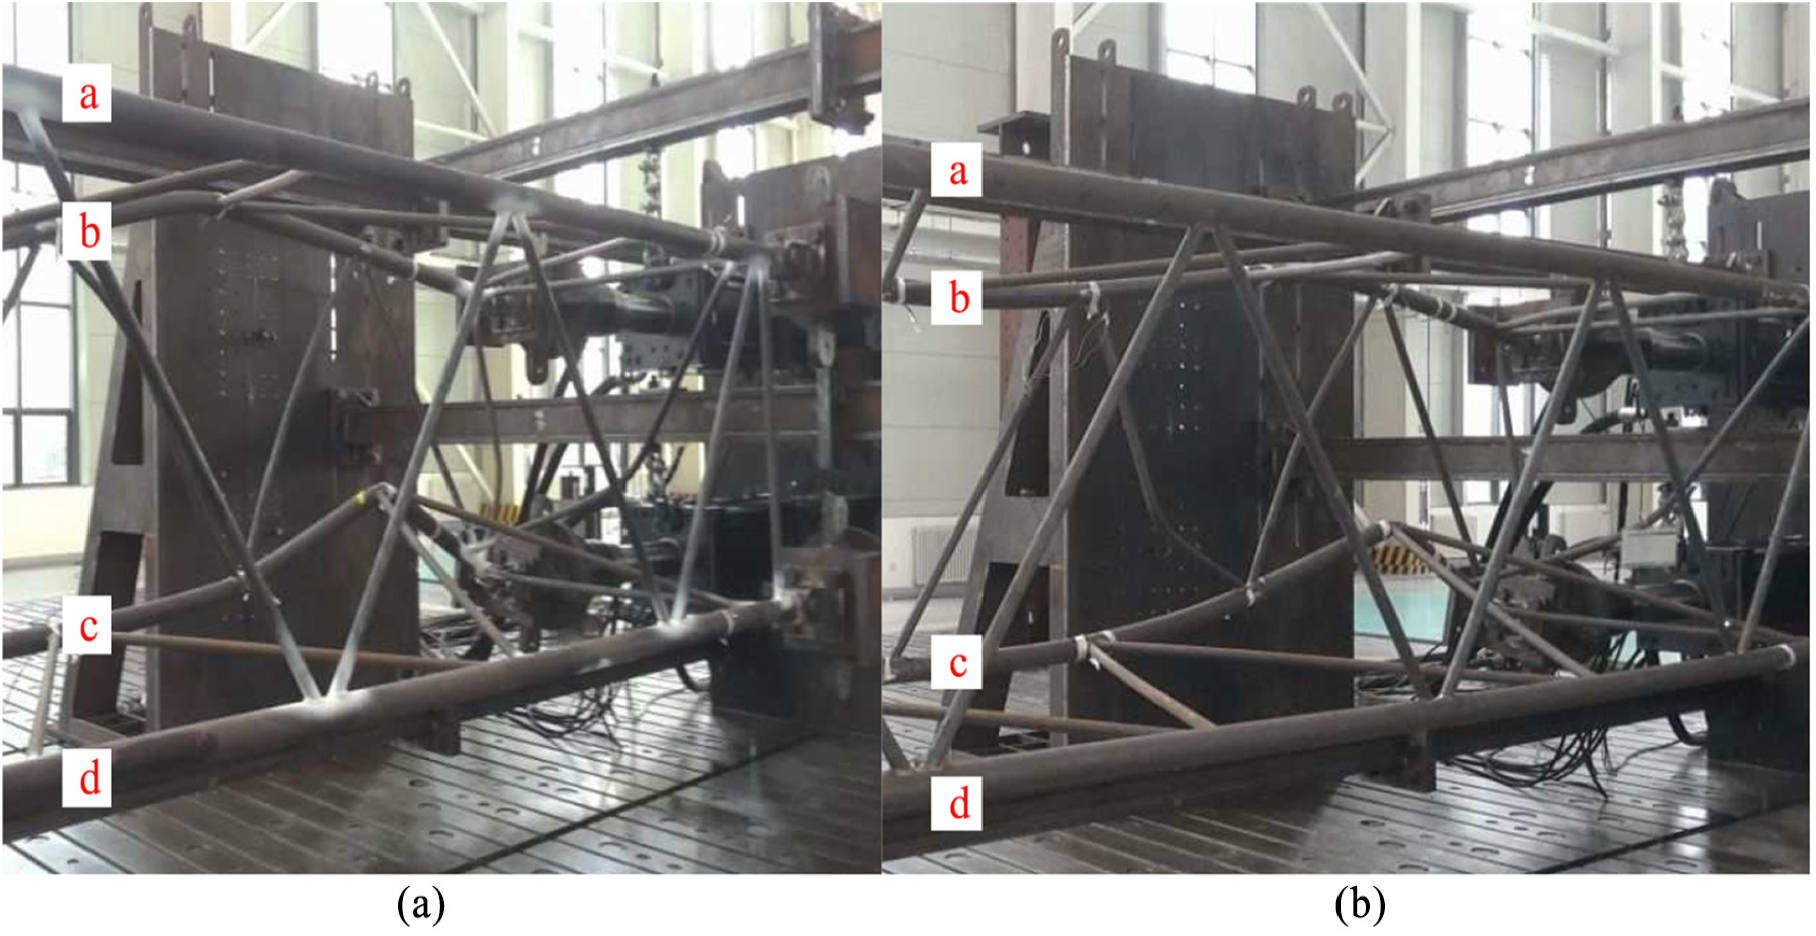
The failure mode of two intermediate sections in hosting case. (a) The fifth intermediate section. (b) The sixth intermediate section.
The failure mode of two intermediate sections in boom lifting case. (a) The seventh intermediate section. (b) The eighth intermediate section.
Comparison and discussion
Comparison of ultimate loads
Ultimate loads calculated with different effective length factors and stability curves and the failure loads of all intermediate sections were listed in Table 7. The ultimate load of case 9 was calculated with the proposed effective length factor and fitting stability curve. The last column showed other results account for the percentage of case 9.
Comparison of ultimate loads.
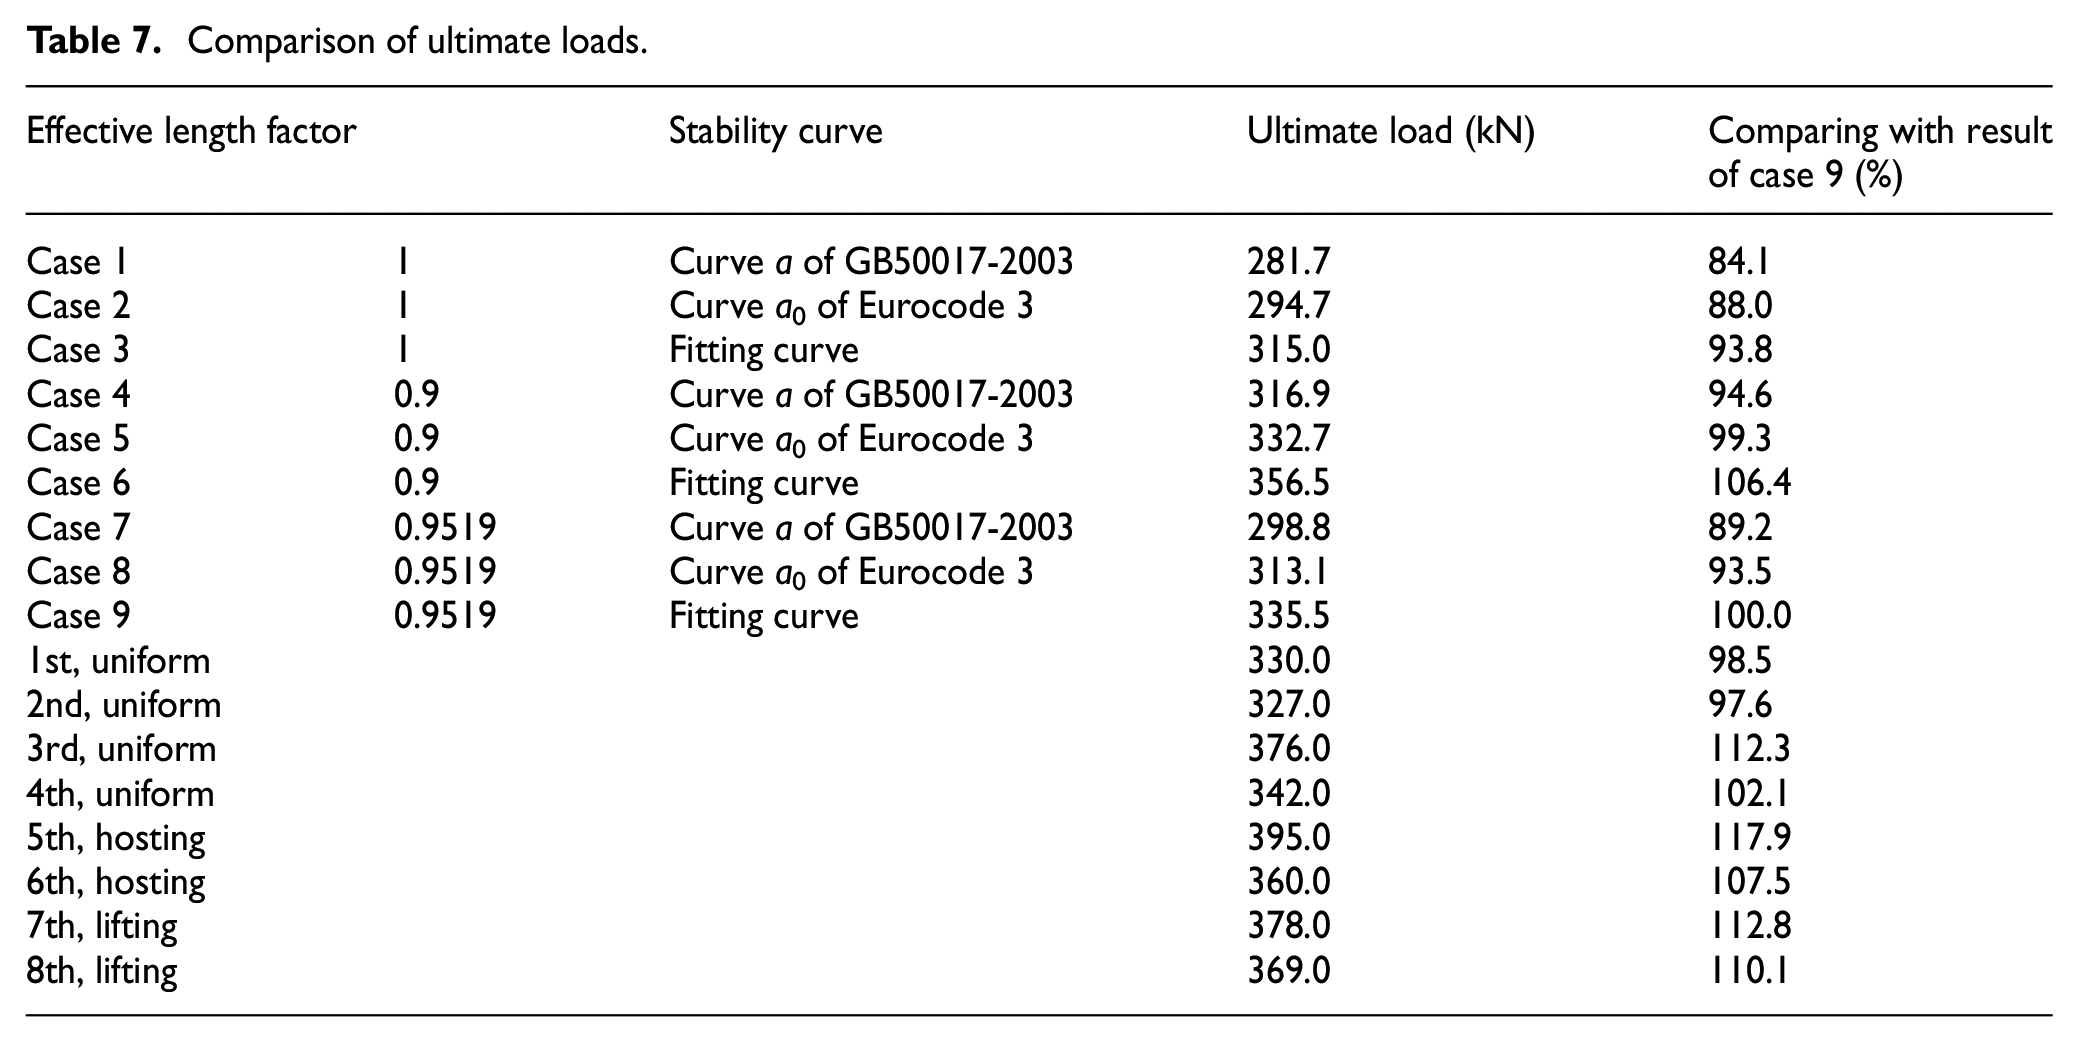
As can be seen in Table 7, the experimental failure loads in the ideal uniform cases were above 327.0 kN, while failure loads in the hosting case and the lifting boom case were above 360.0 and 369.0 kN, respectively. Ultimate loads in the hosting case and the boom lifting case were generally higher than those in ideal uniform case. When forces on the four chords were close, they were all in a critical state, weakening the restraints from the nearby braces, which was the most dangerous case.
Meanwhile, the ultimate loads of case 5 and 9 seemed to be the most consistent result with the experimental failure loads of the ideal uniform case. However, the ultimate load of case 5 was due to the effective length factor 0.9 recommended in Eurocode 3. In fact, the actual effective length factor cannot always reach 0.9 unless the brace was strong enough, which meant the carrying capacity calculated with this method would be larger than the actual carrying capacity sometimes, which might be a potential risk. Therefore, the ultimate load of case 9 turned out to be the most consistent result with the experimental failure loads.
The following conclusions can be drawn:
Comparing with the hosting case and the boom lifting case, the ideal uniform case is the most dangerous case.
The ultimate loads of case 1 and 2 were 16% and 12% lower than the ultimate load of case 9, respectively, indicating that the traditional method has seriously underestimated the actual carrying capacity of the lattice boom.
The ultimate load of case 7, 8, and 9 (when μ1 = 0.9519) was 6.0% higher than that of case 1, 2, and 3 (when μ1 = 1), respectively, indicating that the effect caused by braces is very obvious and must not be ignored.
The ultimate load of case 3, 6, and 9 (using fitting stability curve) was at least 11.5% higher than that of case 1, 4, and 7 (using curve a of GB50017-2003) respectively, and the ultimate load of case 3, 6, and 9 was at least 6.6% higher than that of case 2, 5, and 8 (curve a0 of Eurocode 3) respectively, indicating that the fitting stability curve is correct and necessary.
The carrying capacity calculated with the method of case 9, considering both the restraints of the braces and the stability curve by fitting the experimental data, was the closest one to the experimental ultimate loads, which verified the necessity and correctness of considering the restraints of the braces and stability curve fitting from the experimental data.
Calculation equation about ultimate load of lattice boom
According to the above conclusions, both effective length factor and actual stability curve should be considered in determining the ultimate load of the lattice boom. To apply the research results in engineering calculation conveniently, it is necessary to adjust the corresponding calculation equation. The stability factor formula form of Eurocode 3 was adopted as the final stability factor calculation; the new imperfection factor α and the modified non-dimensional slenderness ratio λn should be substituted. The new stability factor formula was showed as follows

where
Conclusion
In this article, effective length factor and imperfection factor are introduced into the current stability factor formula, and an improved formula for calculating the ultimate load of lattice boom is proposed. Experiments on high-strength steel tubes under compression and eight intermediate sections under axial loading are performed, and the stability coefficient formula of high-strength steel tube is obtained. The axial compression test results show that the carrying capacity of the high-strength steel tubes is generally higher than corresponding stability curves in current European and Chinese standards, and considering both the effective length factor and proposed stability curve is the closest situation to the experimental ultimate loads. The proposed stability factor formula is of great value in the design of lattice boom design considering buckling.
Footnotes
Handling Editor: James Baldwin
Author contributions
L.Z., J.T., Q.Z., E.Z., S.R., and P.L conceived and designed the experiments. Q.Z., E.Z., and P.L. performed the experiments. L.Z. and E.Z. analyzed the data. L.Z., J.T., W.W., Q.Z., E.Z., and P.L. contributed reagents/materials/analysis tools
Declaration of conflicting interests
The author(s) declared no potential conflicts of interest with respect to the research, authorship, and/or publication of this article.
Funding
The author(s) disclosed receipt of the following financial support for the research, authorship, and/or publication of this article: This work was supported by the National Key R&D Program of China (grant no. 2018YFF01012400), National Natural Science Foundation of China (grant no. 51975243), Jilin Provincial Department of Science and Technology Fund Project (grant nos. 20170101043JC and 20180520072JH), Jilin Provincial Department of Education (grant nos. JJKH20180084KJ and JJKH20170788KJ), and Graduate Innovation Fund of Jilin University (grant no. 101832018C184).