
Abstract
This article aims to improve the system cooling capacity of an adsorption chiller working with a silica gel/water pair by an allocation of the optimum cycle time at different operating conditions. A mathematical model was established and validated with the literature experimental data to predict the optimum cycle time for a wide range of hot (55°C–95°C), cooling (25°C–40°C), and chilled (10°C–22°C) water inlet temperatures. The optimum and conventional chiller performances are compared at different operating conditions. Enhancement ratio of the system cooling capacity was tripled as the cooling water inlet temperature increased from 25°C to 40°C at constant hot and chilled water inlet temperatures of 85°C and 14°C, respectively. Applying the concept of the optimum cycle time allocation, the system cooling capacity enhancement ratio can reach 15.6% at hot, cooling, and chilled water inlet temperatures of 95°C, 40°C, and 10°C, respectively.
Introduction
Worldwide, multitude of the industrial processes utilizes fossil fuel to supply heat and power. 1 However, the present stock of the fossil fuel is ultimately finite and will deplete in a few decades. On the contrary, the emissions of the fossil fuel combustion process share a vast role in the environmental problems, such as global warming and air pollution. Reducing the dependence on such energy sources becomes important in refrigeration and air conditioning field, as it represents one of the most important energy-consumption industries. 2
In addition, the conventional refrigeration system has another environmental problem, that is, its ozone depletion potential. Therefore, providing an alternative refrigeration technology to attenuate these effects will be valuable.
A number of refrigeration technologies have emerged as a substitute to the conventional refrigeration system such as absorption, adsorption, desiccant, and ejector refrigeration system. 3 These alternative refrigeration systems are driven by low-grade energy sources, such as solar, geothermal, and waste heat.4–6 Among these systems, the adsorption refrigeration system has many advantages, such as low driving heat source temperature, no crystallization, less corrosion, operation simplicity, and environmentally friendly working fluids.7–9 Therefore, the adsorption refrigeration system seems technologically possible and socially feasible.
Younes et al. 7 and Askalany et al. 10 reviewed different working pairs used for refrigeration applications. They focused on the thermo-physical properties of the working pairs. However, other researchers have investigated the performance characteristics of the adsorption refrigeration system using AC/ethanol, AC/HFO-1234ze(E), and MIL-101/ethanol.11–13 Alam et al. 14 concluded that silica gel/water pair was ubiquitous, as it utilized a low driving heat source temperature, is non-toxic, and has a high latent heat.
Nowadays, many researchers are interested in investigating the influence of the cycle time on the adsorption chiller performance. Performance characteristics of the adsorption chiller based on a longer cycle time (120–780 s) were discussed by Wang and Chua. 15 They reported that a higher system coefficient of performance (COP) and lower system cooling capacity were obtained. Miyazaki et al. 16 proposed a new cycle time allocation for a two-bed adsorption chiller. Their results revealed that an increase in the system cooling capacity with 6% can be reached at hot, cooling, and chilled water inlet temperatures of 85.7°C, 31.1°C, and 14.8°C, respectively. Following these studies, El-Sharkawy et al. 17 investigated the effects of reallocation of the desorption/adsorption cycle time ratio on the adsorption chiller performance.
They noted that the maximum system cooling capacity can be achieved when the desorption/adsorption cycle time ratio was between 0.85 and 0.9 while the switching time ranged from 30 to 35 s. However, an optimization technique for the cycle time is highly recommended to enhance the system performance. The objective function for this optimization technique should be the system cooling capacity instead of the system COP due to the monotonic trend of the system COP with the cycle time. 14 Therefore, a genetic algorithm optimization tool was developed by Rezk and Al-Dadah 18 to find the optimum cycle time based on the system cooling capacity as an objective function. They found that an improvement in the system cooling capacity by 8.3% can be achieved at a cycle time of 345 s.
In fact, the optimum cycle time of the adsorption chiller and consequently its performance varies with the system operating conditions (heat source, cooling medium, and chilled water temperatures). Hence, the optimum cycle time should be investigated at a wide range of system operating temperatures especially for an adsorption chiller system adopted with two sorption beds to assure a continuous system operation. Therefore, the objective of this work is to improve the system cooling capacity of an adsorption chiller working with silica gel/water pair through the following procedure:
Investigate the effect of the adsorption/desorption cycle time on the system cooling capacity at different operating temperatures to achieve the maximum system cooling capacity.
Derive correlations for the optimum cycle time, the system cooling capacity, and COP in terms of the system operating temperatures.
Evaluate the enhancement ratio of the system cooling capacity at a wide range of the system operating temperatures as compared with the conventional system.
Description of the adsorption chiller
Figure 1 shows a schematic diagram of the adsorption chiller working with silica gel/water pair. The adsorption chiller consists of a desorber/adsorber bed, a condenser, an expansion device, and an evaporator. The desorber/adsorber bed is packed with a desiccant material (silica gel) to desorb/adsorb the refrigerant. In order to accomplish a cooling effect, the adsorption chiller undergoes four sequential fundamental processes as illustrated on Dühring diagram in Figure 2. First, the system will be described when the left bed is used for desorption process while the right one is used for adsorption process. In this case, the processes are isosteric heating (preheating switching, 1→2), isobaric desorption (2→3), isosteric cooling (precooling switching, 3→4), and isobaric adsorption (4→1). During the isosteric heating process, both valves V1 and V3 are closed, and consequently, the refrigerant amount in the left bed remains constant. As a result of the heating process, the bed pressure increases from evaporation pressure to condensation pressure (1→2). It should be mentioned that hot water is used as the heat source in this process. The heating process is continued and valve V3 is opened; therefore, the bed pressure remains constant (isobaric desorption process (2→3)) and the released superheated refrigerant (water) goes to the condenser. Hence, the refrigerant is condensed in the condenser by transferring its heat to the cooling medium (cooling water). The saturated liquid refrigerant is expanded in the expansion device and then flows through the evaporator in order to transfer the heat from the load (chilled water). As the desorption process occurs in the left bed, the adsorption process takes place in the right bed.

Schematic diagram of an adsorption chiller.
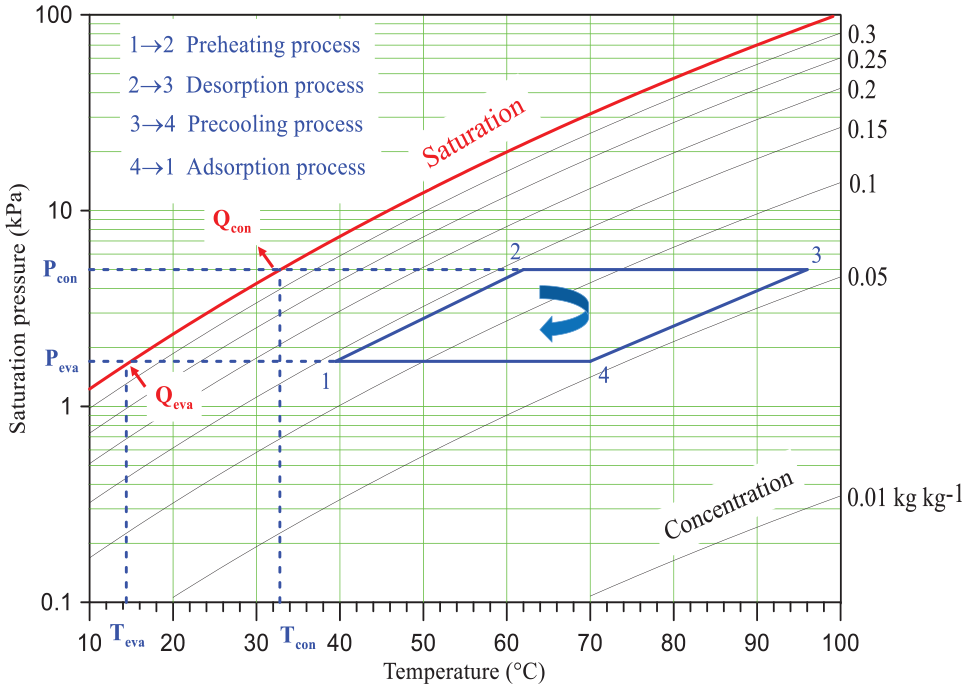
Dühring diagram of an ideal adsorption chiller.
In the isosteric cooling process, both valves V2 and V4 are closed and accordingly, the refrigerant amount in the right bed remains constant. As a result of the cooling process, the bed pressure decreases from condensation pressure to evaporation pressure (3→4). Now, valve V2 is unlocked, and the cooling process is continued; therefore, the bed pressure remains constant (isobaric adsorption process (4→1)), and the refrigerant from the evaporator is released. It should be stated that in case of using the left bed for the desorption process, the right one is used for the adsorption process and vice versa.
Mathematical modeling
Modeling techniques used for adsorption chillers may be classified into three major categories: (1) thermodynamic model, (2) lumped parameter model, and (3) heat and mass transfer model. Recently, Sah et al. 19 confirmed that the lumped parameter model is the most suitable for systems in which the system’s behavior and performance are satisfactory under time-varying conditions. This model involves a set of linear/nonlinear ordinary differential equations (ODEs) that need a numerical solution. Therefore, a numerical modeling is formulated for all major components of the adsorption chiller. The modeling of the adsorption chiller is expressed mathematically based on adsorption kinetics, isotherms, continuity, and energy balances. To simplify the expressed mathematical modeling, some assumptions have been considered as follows:
The system parameters (pressure, temperature, and concentration) are the same at the same moment in the whole control volume.
Desorber/adsorber beds, condenser, and evaporator are well insulated.
The adsorbed phase is a liquid phase for adsorption kinetics and isotherms.
Hot, cooling, and chilled water temperatures are supplied from thermal reservoirs.
Hot, cooling, and chilled water pumping power consumptions are neglected.
The heat of adsorption is constant.
The system pressure drop is neglected.
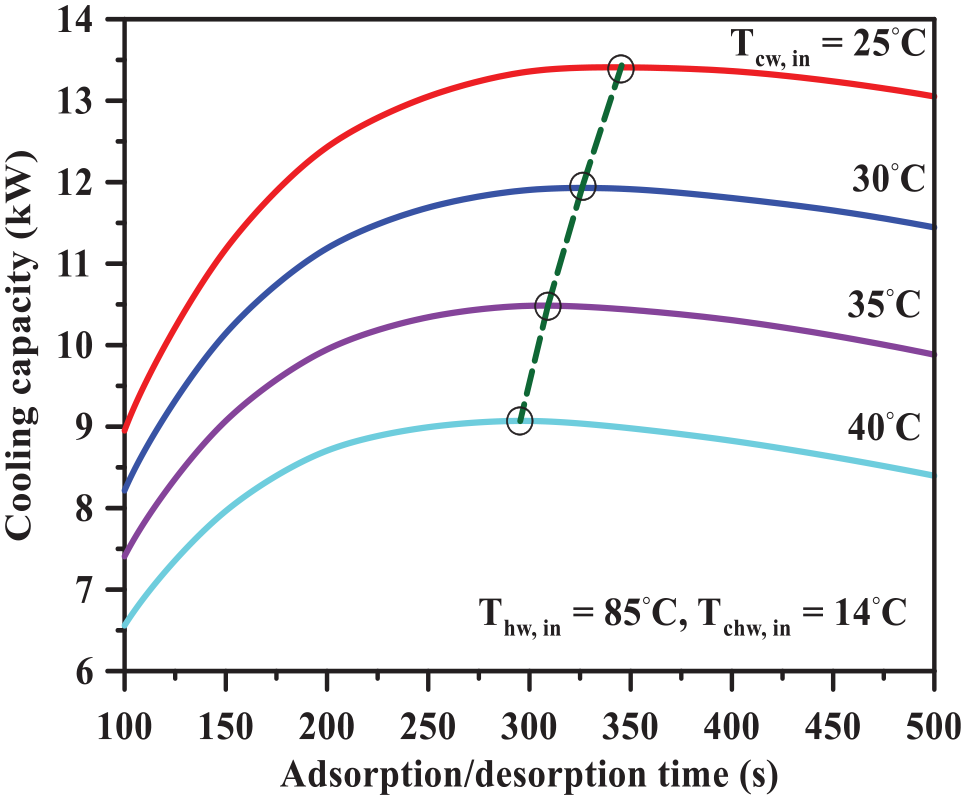
Adsorption kinetics
The transient rate of adsorbed/desorbed water vapor by regular density (RD)-type silica gel is given by the conventional linear driving force equation as 20
where

where
Adsorption isotherms
Dubinin–Astakhov adsorption isotherm equation is used to compute the adsorption uptake of the RD-type silica gel/water pair and is expressed as correlated by Wang et al. 23

Continuity equation
The released refrigerant mass flow rate of the adsorption and the desorption process can be computed using the following expression as proposed by Papoutsis et al. 24

Main components energy balances
In order to analyze the performance of the adsorption chiller, an energy balance for the system’s main components has been applied as shown in the following subsections.
For the adsorber bed
As mentioned earlier, there are two thermodynamic processes that have occurred in the aorber bed, namely precooling switching (3→4) and isobaric adsorption process (4→1). Equation (5) describes the energy balance of the adsorber bed during precooling and adsorption processes as mentioned by El-Sharkawy et al. 25

It should be noted that the flag
For the desorber bed
In the same manner, applying the energy balance for the desorber bed yields to the following equation

where the flag
For the evaporator
The energy balance for the evaporator is reported by Koronaki et al. 26 and expressed as follows

For the condenser
The condenser energy balance equation can be expressed as follows

The water outlet temperatures from the major system components, such as the adsorber, desorber, evaporator, and condenser, are computed using the logarithmic mean temperature difference (LMTD) method as given by Mitra et al. 27

where the subscript HX alternately stands for adsorber, desorber, evaporator, and condenser heat exchangers. The subscript (i) represents the hot, adsorber cooling, condenser cooling, and chilled water temperatures.
System performance
The performance characteristics of the adsorption chiller such as cooling capacity and COP can be expressed as 18


Notifying that, the system performance is calculated for one complete cycle time


where PCQeva and PCCOP are the percentage changes for the system cooling capacity and COP, respectively.
Computational procedure
The prescribed mathematical model was carried out using MATLAB software coupled with REFPROP database.
28
The simulation methodology started with initial values of the differential equation state variables such as
Results and discussion
The simulation results of the adsorption chiller consisted of three main parts. First, a validation of the mathematical model with the experimental data from the literature was performed. Then, the effect of the adsorption/desorption cycle time on the system cooling capacity at different operating conditions was presented in the second part. Hence, the system operating temperatures were varied in a wide range of 55°C–95°C for hot water inlet temperature, 25°C–40°C for cooling water inlet temperature, and 10°C–22°C for chilled water inlet temperatures to obtain a correlation for the optimum cooling capacity as a function of the system operating conditions. Finally, an estimation of the performance ratio between the optimum and conventional systems was performed under a wide range of hot, cooling, and chilled water inlet temperatures.
Model validation
The proposed mathematical model was validated with the experimental data from the literature20,29 for a two-bed adsorption chiller. Figure 3 displays a comparison between the measured values of the water outlet temperatures for the desorber, adsorber, condenser, and evaporator with current simulation results. It is clear from this figure that a good agreement was achieved between the experimental and simulation results. It can be noted that the simulation results have a cyclic average error for the desorber, adsorber, condenser, and evaporator water outlet temperature profiles of 5%, 1.3%, 8%, and 2.8%, respectively.

Comparison between simulated and experimental water outlet temperature profiles.
Effect of hot water inlet temperature
In order to investigate the effect of the hot water inlet temperature on the system cooling capacity, both cooling and chilled water inlet temperatures are kept constant at 30°C and 14°C, respectively. Dependency of the adsorption/desorption time upon the cooling capacity at different hot water inlet temperatures is illustrated in Figure 4. Obviously, for a constant hot water inlet temperature, the cooling capacity has a convex trend, that is, it increases as the adsorption/desorption cycle time increases until it reaches a peak value and then decreases. This trend can be attributed mainly due to the impact of the instantaneous uptake desorbed refrigerant as shown in Figure 5.

Variation of the system cooling capacity with the adsorption/desorption time at different hot water inlet temperatures.

Instantaneous uptake desorbed refrigerant as a function of time at different adsorption temperatures.
As the adsorption/desorption cycle time increases, the instantaneous uptake desorbed refrigerant increases till reaching the optimum time and then remains slightly constant due to the exponential relationship of the instantaneous uptake with the adsorption/desorption time (equations (1)–(3)). The convex trend of the system cooling capacity with the adsorption/desorption cycle time agrees with the reported work of Saha et al. 30 Figure 4 also depicts the effect of the hot water inlet temperature on the system cooling capacity. It can be observed that the system cooling capacity is directly proportional to the hot water inlet temperature. In order to prove this trend, a presentation of the adsorption isotherm diagram for two-cycle processes at different hot water inlet temperatures (55°C and 95°C) at constant cooling water inlet temperature (30°C) is shown in Figure 6. The cycle (1-2-3-4-1) represents the lower hot water inlet temperature, whereas the cycle (1-2-3′-4′-1) represents the higher hot water inlet temperature. Significantly, when the hot water inlet temperature increases from 55°C to 85°C, the net uptake increases (Δq2 > Δq1). The reported relation of the system cooling capacity with the hot water inlet temperature accords with the obtained results by Wang et al. 23

Effect of saturation pressure on the adsorption equilibrium uptake at different adsorption temperatures.
Figure 4 illustrates a variation of the optimum adsorption/desorption time at which a maximum cooling capacity is obtained with the hot water inlet temperature. Clearly, as the hot water inlet temperature increases, the optimum adsorption/desorption time decreases. In order to interpret this trend, a presentation of adsorption kinetics at different hot water inlet temperatures is shown in Figure 5. Obviously, the increase in hot water inlet temperature provides a decrease in the response diffusion time constant. It should be noted that the diffusion time constant is deemed as a characteristic of the first-order ODE, that is, it is related to the response speed of the adsorption kinetics. Hence, the higher hot water inlet temperature (adsorption temperature) has a faster response and consequently, the optimum point location becomes earlier. Therefore, as the hot water inlet temperature increases from 25°C to 95°C, the diffusion time constant decreased from τ1 to τ2, as explained in Figure 5. A similar trend of the optimum adsorption/desorption cycle time with the hot water inlet temperature was observed by Mitra et al. 21
Effect of cooling water inlet temperature
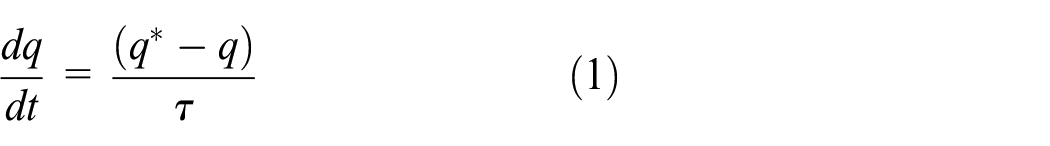
The effect of the cooling water inlet temperature on the system cooling capacity can be explained with the help of Figures 7 and 8. It should be noted that the cooling water inlet temperature is changed from 25°C to 40°C while both hot and chilled water inlet temperatures are kept constant at 85°C and 14°C, respectively. Figure 7 depicts the influence of the adsorption/desorption time on the system cooling capacity at different cooling water inlet temperatures. Remarkably, the system cooling capacity is inversely proportional to the cooling water inlet temperature. This can be attributed to the decrease in adsorption net uptake as the cooling water inlet temperature increases as shown in Figure 8. The cycle (1-2-3-4-1) is the lower cooling water inlet temperature (30°C), while the cycle (′1-2′-3′-4′-1′) is the higher cooling water inlet temperature (40°C). Both cycles operate at constant hot water inlet temperature of 85°C. It should be noted that when the hot water inlet temperature increases from 30°C to 40°C, the net uptake decreases (Δq1 > Δq2). Likewise, Jribi et al. 12 expressed that the increase in cooling water inlet temperature provides a lower system cooling capacity.
Dependence of the system cooling capacity on the adsorption/desorption time at different cooling water inlet temperatures.
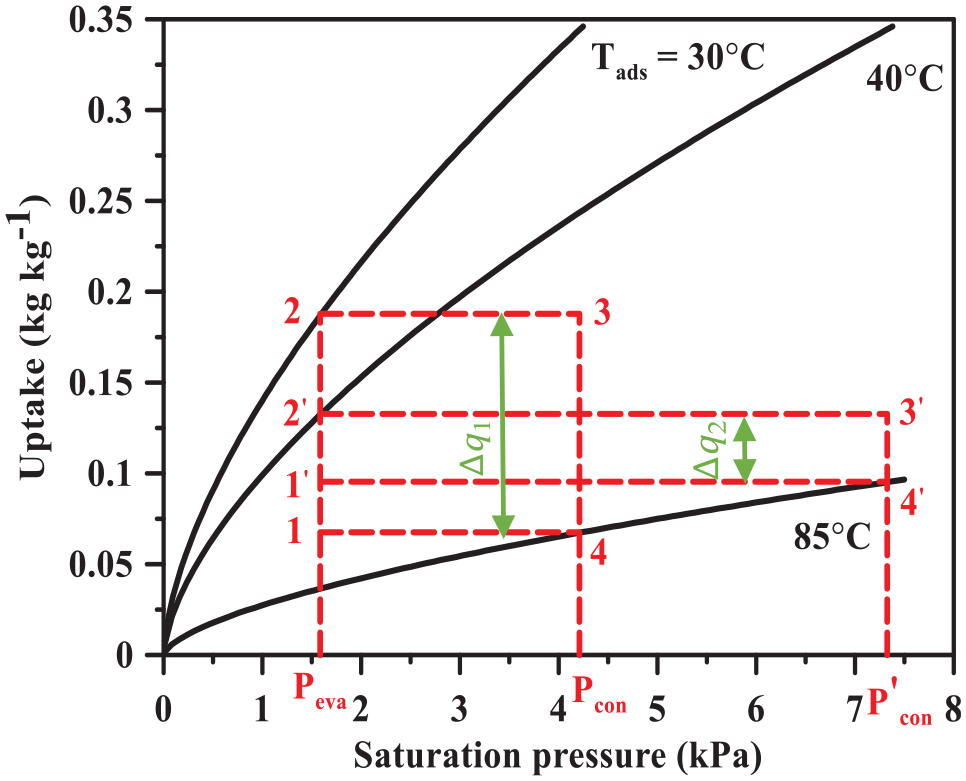
Effect of the cooling water inlet temperature on the adsorption net uptake.
The optimum adsorption/desorption time locations at different cooling water inlet temperatures can be predicted also from Figure 7. Evidently, the increase in the cooling water inlet temperature leads to a decrease in the optimum adsorption/desorption time. As shown previously in Figure 5, the higher adsorption temperature provided a shorter diffusion time constant and consequently an increase in the optimum adsorption/desorption cycle time.
Effect of chilled water inlet temperature
Influence of the adsorption/desorption time on the system cooling capacity at different chilled water inlet temperatures is illustrated in Figure 9. It should be stated that the chilled water inlet temperature is changed from 10°C to 22°C, whereas hot and cooling water inlet temperatures are kept constant at 85°C and 30°C, respectively. It can be noticed that the system cooling capacity increases with the increase in chilled water inlet temperature as a result of the attributed increase in the adsorbed refrigerant uptake. Actually, as the chilled water inlet temperature increases, the evaporator pressure increases and, consequently, the adsorbed refrigerant uptake increases.

System cooling capacity as a function of the adsorption/desorption at different chilled water inlet temperatures.
This fact is explained in Figure 10. The cycles (1′-2′-3-4′-1′) and (1-2-3-4-1) are the higher and lower chilled water inlet temperature, respectively. Both cycles operate at constant hot and cooling water inlet temperature of 85°C and 30°C, respectively. Obviously, from Figure 10, the higher chilled water inlet temperature yields a higher adsorption net uptake (Δq2 > Δq1). Regarding previous studies, Jribi et al. 12 and Wang et al. 23 reported the same trend of the system cooling capacity versus the chilled water inlet temperature.

Effect of the saturation pressure on the adsorption equilibrium uptake.
Variation of the optimum adsorption/desorption time with the chilled water inlet temperature is also depicted in Figure 9. As the chilled water inlet temperature increases, the optimum adsorption/desorption cycle time increases. It is worthy to mention that the optimum adsorption/desorption cycle time is only dependent on the adsorption temperature (equation 2). Therefore, as the chilled water inlet temperature increases, the average adsorption temperature decreases and accordingly leads the optimum adsorption/desorption time to increase as illustrated in Figure 11.
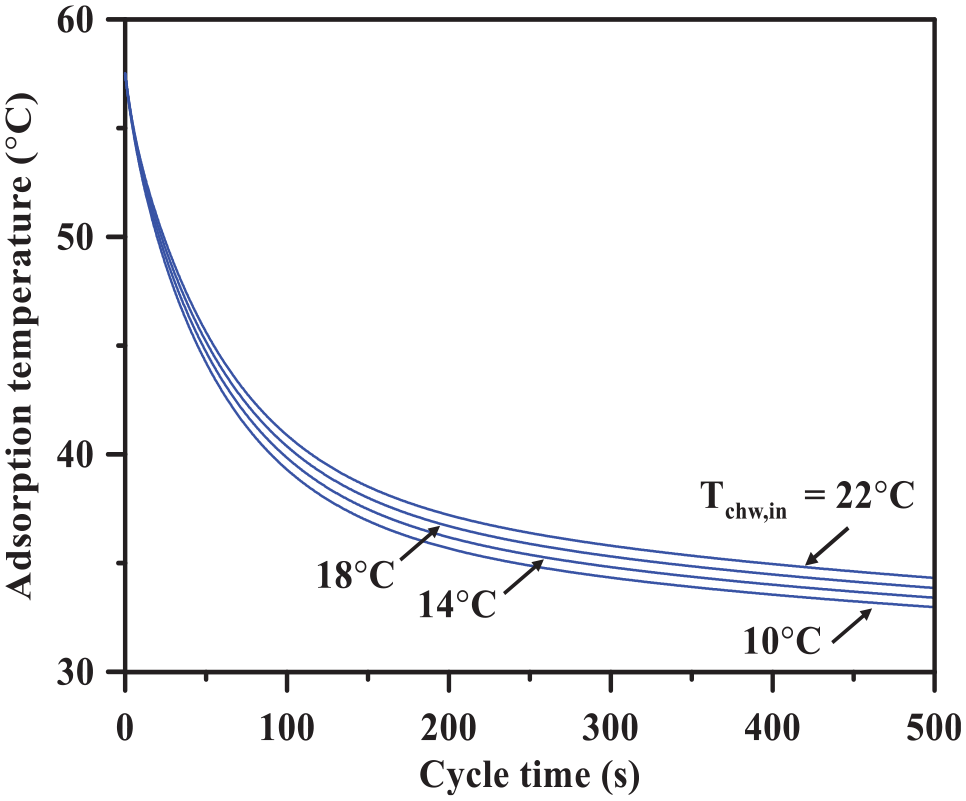
Variation of the adsorption kinetics with the cycle time at different chilled water inlet temperatures.
Optimum system correlations
In fact, the cycle time consists mainly of the adsorption/desorption time and the switching time. However, the aforementioned system cooling capacity has been estimated based on the adsorption/desorption time. Therefore, an estimation of the system performance is implemented using the total cycle time taking into account the switching time of 30 s. The optimum adsorption/desorption time, the cyclic system cooling capacity, and the cyclic system COP are correlated in a wide range of hot water inlet temperatures (55°C–95°C), cooling water inlet temperatures (25°C–40°C), chilled water inlet temperatures (10°C–22°C) as in the following form

where Y represents the optimum adsorption/desorption time and/or the cyclic system cooling capacity, and/or the system COP. Numerical coefficients of the proposed correlations are given in Table 1. Regarding the previous correlation, the maximum system cooling capacity can be achieved at the hot, cooling, and chilled water inlet temperatures of 95°C, 25°C, and 22°C, respectively. The maximum cyclic system cooling capacity is 21.4 kW at an optimum cycle time of 389 s.
Regression coefficients of the predicted correlations.

COP: coefficient of performance.
Optimized system versus conventional system at different operating conditions
System performance percentage change has been defined in equations (12) and (13) for both cooling capacity and COP. The conventional system cycle time (450 s) as reported in the literature for a chiller system has the same specifications. 20 In case of evaluating the system cooling capacity, it is denoted that the system cooling capacity percentage change increases, whereas it decreases in case of assessing the system COP. The percentage changes are examined over a wide range of hot, cooling, and chilled water inlet temperatures as shown in Figure 12. As compared with the conventional system, the system cooling capacity increases while the COP decreases when using the optimum cycle time allocation at all operating conditions. This behavior is resulted from considering the system cooling capacity as the main goal of the optimization procedure. Moreover, the adsorption refrigeration system is driven by a low-grade energy source. Therefore, enhancing its cooling capacity is more pronounced than its COP.

Cooling capacity and COP percentage change at different system operating conditions: (a) hot water inlet temperature, (b) cooling water inlet temperature, and (c) chilled water inlet temperature.
Influence of the hot water inlet temperature on the system performance percentage change for the system cooling capacity and COP is investigated over a range of (55°C–95°C) while the cooling and chilled water inlet temperatures are held constant at 30°C and 14°C, respectively, as depicted in Figure 12(a). Obviously, the system cooling capacity percentage change decreases then increases with the increase in hot water inlet temperature. On the contrary, the system COP percentage change increases, as the hot water inlet temperature increases. It should be mentioned that the highest enhancement of the system cooling capacity is attained at a hot water inlet temperature of 95°C.
Dependency of the system performance percentage change based on the cooling water inlet temperature is illustrated in Figure 12(b). Variation of the cooling water inlet temperature of 25°C, 30°C, 35°C, and 40°C is executed while the hot and chilled water inlet temperatures are remained constant at 85°C and 14°C, respectively. Clearly, the system cooling capacity percentage change increases with the increase in cooling water inlet temperature.
On the contrary, the system COP percentage change decreases then increases as the cooling water inlet temperature increases. The highest enhancement of the system cooling capacity is achieved at a cooling water inlet temperature of 40°C. It should be mentioned that the system cooling capacity decreases while the system cooling capacity enhancement ratio increases with the increase in cooling water inlet temperature (Figures 7 and 12(b)). Therefore, using the optimum cycle time allocation at higher cooling water inlet temperature is essential to compensate the reduction in the system cooling capacity.
Figure 12(c) reveals the variation of the chilled water inlet temperature with the system performance percentage change. The percentage change at various chilled water inlet temperatures of 10°C, 14°C, 18°C, and 22°C is investigated. However, the hot and cooling water inlet temperatures are held fixed at 85°C and 30°C, respectively. As the chilled water inlet temperature increases, the system cooling capacity percentage change decreases while the system COP percentage change decreases. Obviously, the highest system cooling capacity enhancement is obtained at a chilled water inlet temperature of 10°C. On contrary to the system cooling capacity trend with the chilled water inlet temperature (Figure 9), the enhancement increases at lower chilled water inlet temperatures (Figure 12(c)).
Hence, using the optimum cycle time allocation at lower chilled water inlet temperatures compensates the cooling capacity reduction. Eventually, it can be noted that the adsorption chiller operation under the extremely hot, cooling, and chilled water inlet temperatures of 95°C, 40°C, and 10°C yields a superior system cooling capacity enhancement of 15.6%. Collective numerical results for the optimal cycle time and performance ratios at different operating temperatures are summarized in Table 2.
Numerical results for the optimal cycle time and performance ratios at different operating temperatures.
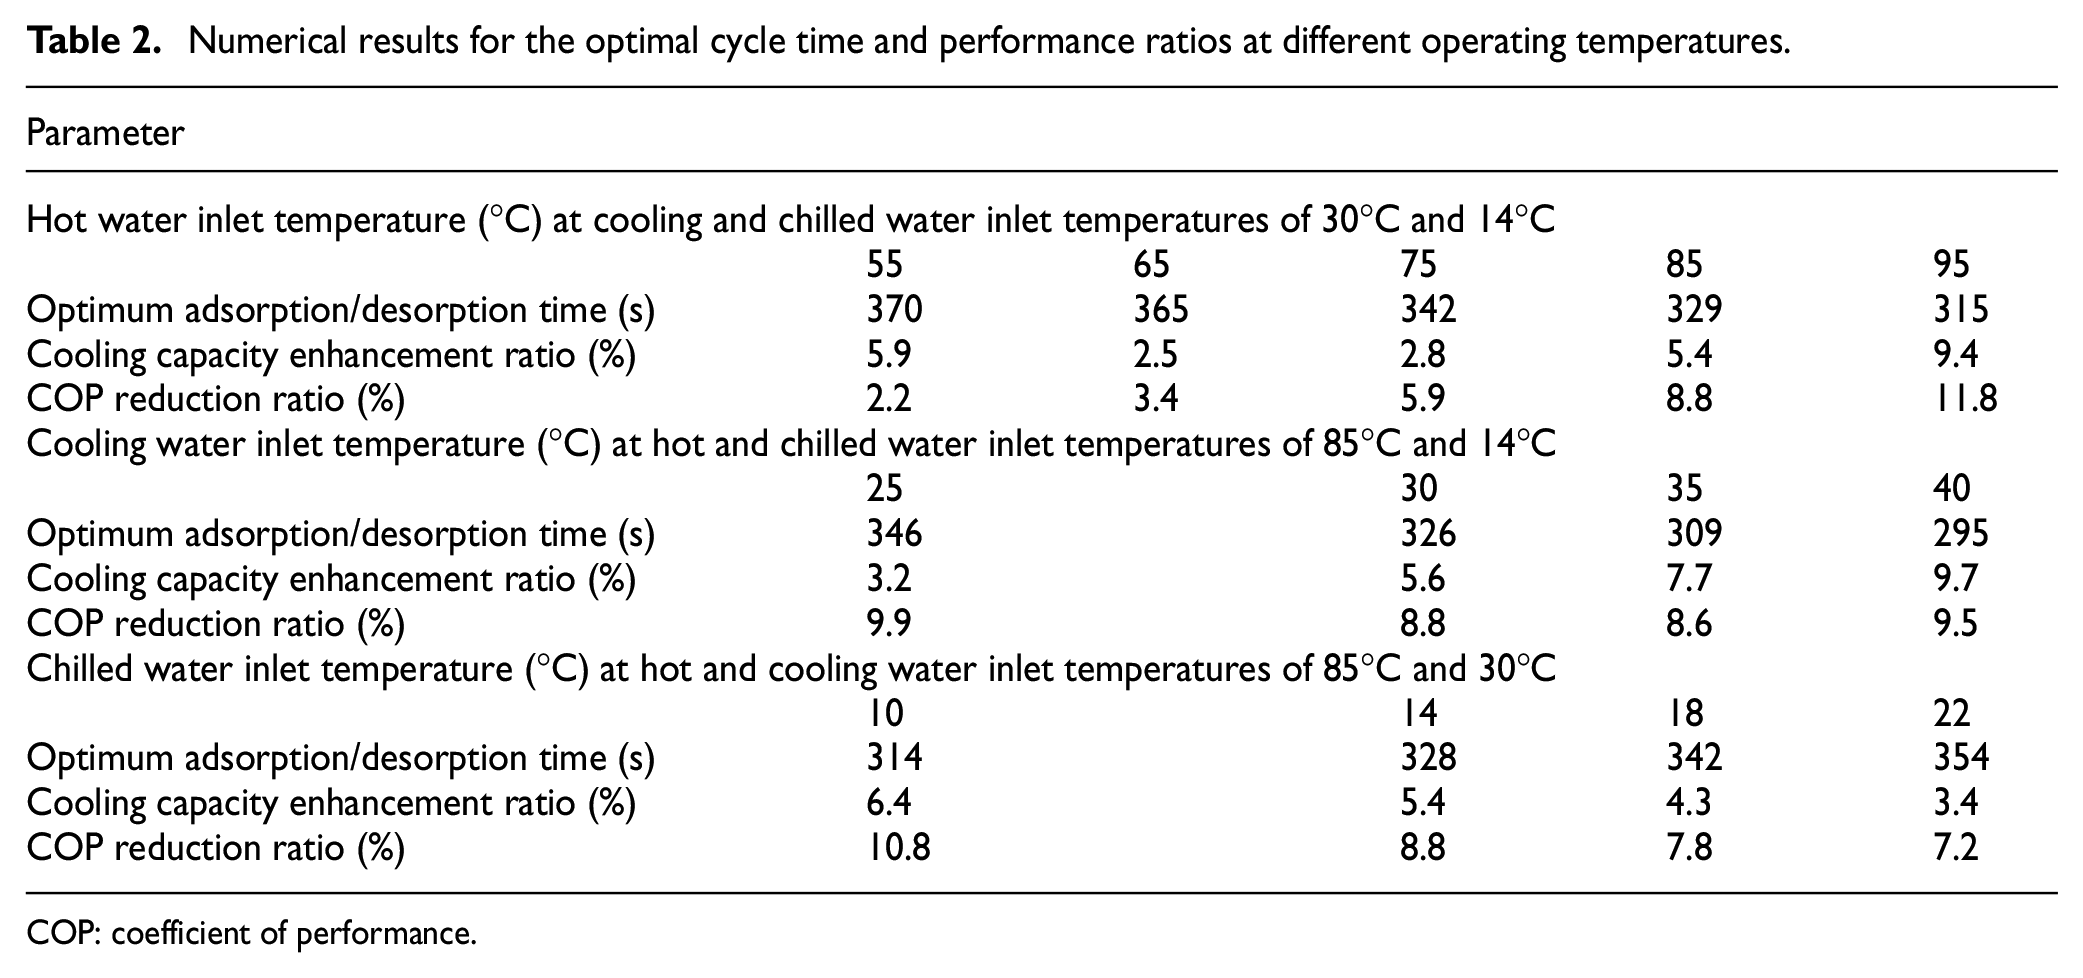
COP: coefficient of performance.
Conclusion
A lumped parameter transient model has been established to simulate the performance characteristics of a two-bed adsorption chiller using silica gel/water pair. In addition, the effect of the adsorption/desorption time at different operating conditions has been predicted in order to obtain the optimum value of the adsorption/desorption cycle time which achieves maximum system cooling capacity. Then, a comparison between the optimum and conventional systems has been performed for the system cooling capacity and COP at different operating conditions. Based on the reported results, the following conclusions have been obtained:
As compared to the experimental data from the literature, the mathematical model has a good agreement with a cyclic average error in the desorber, adsorber, condenser, and evaporator temperature profiles of 5%, 1.3%, 8%, and 2.8%, respectively.
The optimum adsorption/desorption cycle time inversely proportional to hot and cooling water inlet temperatures, whereas it is directly proportional to the chilled water inlet temperature.
Correlations for the optimum adsorption/desorption time, system cooling capacity, and COP have been derived as a function of system operating temperatures with a determination coefficient (R2) of 0.979, 0.996, and 0.996, respectively.
The enhancement of the system cooling capacity is doubled using the optimum cycle time allocation at a hot water inlet temperature of 85°C as compared with 65°C at constant cooling and chilled water inlet temperatures of 30°C and 14°C, respectively.
Using the optimum cycle time allocation compensates the system cooling capacity reduction at the worst chiller operating conditions such as higher cooling water inlet temperatures and lower chilled water inlet temperatures.
Compared to the conventional system, the enhancement of the system cooling capacity can be increased by 15.6% using the optimum system at hot, cooling, and chilled water inlet temperatures of 95°C, 40°C, and 10°C, respectively.
Footnotes
Appendix 1
Handling Editor: James Baldwin
Declaration of conflicting interests
The author(s) declared no potential conflicts of interest with respect to the research, authorship, and/or publication of this article.
Funding
The author(s) disclosed receipt of the following financial support for the research, authorship, and/or publication of this article: This research paper is supported by a research project with a title of “‘20 Cubic Meter Solar Energy Powered Absorption Cold Store Refrigeration System.” The project is funded by STDF (Science & Technology Development Fund) with a project ID. 18622.