
Abstract
Hydraulic disturbance of a vibrator is the main cause of distortion of the vibroseis geophysical exploration signal that is caused by high-frequency fluid vibration during servo valve cavity commutation. This disturbance is closely related to the structure, size, and arrangement of the hydraulic flow path of the vibrator reaction mass. In this work, a vibrator disturbance–suppression mechanism was examined, an experimental study was carried out on an improved design of the hydraulic flow channel, and the source of the hydraulic disturbance of the horizontal channel vibrator was determined. The vibrator hydraulic flow channel was changed to a vertical flow channel in the piston rod. In addition, the structure of the track was designed, and the angle of the oil inlet of the piston rod was tested at 0°, 45°, and 90°. Then, the fluid flow state and fluid–solid coupling analysis method were used to improve the vibration-suppression effect of the vibrator. The results showed that the optimal oil inlet angle is 90°, for which the turbulent intensity of the oil inlet is the smallest, the pressure drop loss is reduced, and the influence of the oil flow on the piston rod deformation is minimal. The vibration reaction mass test of the vibrator showed that the disturbance inhibition rate of the piston rod with a 90° inlet structure design reaches 64.087%; the hydraulic disturbance had the best suppression effect and effectively reduced the distortion of the seismic prospecting signals with this oil inlet angle, improving the quality and efficiency of oil and gas exploration.
Keywords
Introduction
By creating a geophysical signal-excitation source controlled and driven by a hydraulic servo, vibroseis is recognized as a highly efficient, safe, and environment friendly geophysical prospecting technology compared to the traditional explosive source. In actual seismic exploration operations, it is difficult to avoid the signal distortion of the vibroseis, which greatly reduces the accuracy of oil and gas exploration and work efficiency and even leads to the failure of geophysical exploration operations. The distortion of the vibroseis excitation signal mainly arises from two factors. First, the distortion of the reference signal generated by the vibroseis electronic control system is a congenitally deficient output signal. Second, a source-induced noise is produced by the nonlinear perturbation of the mechanical–hydraulic execution structure. 1 The majority of the source-induced noise of the vibroseis originates from the vibrator hydraulic system and the servo control component and is expressed as the hydraulic flow nonlinear disturbance of the high-frequency hydraulic servo valve and the flow channel, which is destructive and difficult to eliminate. In 2003, Zhang’s 2 research showed that the nonlinearity of the flow pressure characteristic curve of an electro-hydraulic servo valve and the nonlinear disturbance of a hydraulic flow channel are the main causes of distortion of the output signal. Based on the aforementioned factors, many researchers have studied the mechanism of hydraulic disturbance and disturbance-suppression analysis. In the 1980s and 1990s, some researchers both domestically and abroad carried out experimental studies on the pressure fluctuations in the internal flow field of servo valves and other valves. In 2005, Wu 3 commented on the results of Ziad et al. (Switzerland), who found that the shear layer excitation of the fluid caused pressure fluctuations in the valve. The interaction between the shear layer oscillation and the acoustic wave resonator will generate high-frequency self-excited noise, which is also known as high-frequency self-oscillation and has been a common problem in electro-hydraulic servo valves domestically and abroad. In 2004, Jyotil4,5 and colleagues simulated a typical two-dimensional cylindrical flow field using computational fluid dynamics (CFD) simulation software and obtained the expression relating the length of the recirculation zone, the drag coefficient, and the boundary layer separation angle to the Reynolds number and flow width. In the same year, Chen and Stoffel 6 simulated the laminar and turbulent flow patterns of an open-cycle valve for an entire week and obtained the velocity and pressure distribution in two states that verified the basic feature of the turbulence flow field. Amirante et al. 7 conducted a study on the pre-stage high-frequency whistle of a dual-nozzle baffle servo valve and found that the oil supply pressure has a certain relationship with the whistling frequency. It was proposed that a damping element can be installed in the return oil pipeline for effective control of the servo valve high-frequency howling. In 2015, studies carried out by Mu 8 indicated that pressure pulsations caused by shear layer oscillations or vortices lead to unstable operation of hydraulic valves or hydraulic systems, severely affecting their working performance and thereby resulting in stress in the flow field. Studies of the pulsation and its suppression are important for enhancing the stability of hydraulic systems and improving the working performance of hydraulic components. Wang and Zhao 9 provided a general description of the current status of electro-hydraulic servo technology, such as the electro-hydraulic servo valves, the electro-hydraulic servo systems, and the practical applications. Finally, they predicted the future development direction. Zhang 10 studied the flow characteristics of the pre-stage jet flow field of the servo valve. The mathematical model of the jet flow field between the nozzle baffles was established; the jet pressure pulsation and pre-stage structural parameters and servo valve work have been researched. The research results supplied a theoretical basis for further study of the jet flow field characteristics of the nozzle flapper servo valve and the high-frequency noise-generation mechanism. Gao 11 studied the numerical simulation and visualization of the complex flow field in a hydraulic system and verified the correctness of the mathematical model by experiments. Zhong 12 carried out the analysis of the hydraulic servo system of the vibroseis vibrator. The transfer function of the servo-vibration cylinder system was established, mastering the relationship between the system load pressure and the input signal frequency.
In summary, the hydraulic flow disturbance of a vibroseis high-frequency electro-hydraulic servo valve is mainly caused by the high-frequency commutation of the fluid in the valve chamber, the excitation of high-frequency vibration, and the structure, size, and arrangement of the hydraulic flow path of the vibrator. In this work, by studying the mechanism of the perturbation in the original oil inlet mode of the vibrator, we have elucidated the origins of the disturbance of the vibrator in the horizontal inlet mode. Based on this work, an improved design of the vibrator’s hydraulic flow channel was adopted. The fluid flow channel analysis and the fluid–solid coupling analysis method were adopted. After the improved design was implemented, the vibration disturbance suppression mechanism of the vibrator was studied, and a vibration reaction mass test was carried out to verify the turbulent reducing effect. The optimal strategy and design structure for the disturbance suppression of the hydraulic flow in the vibrator were determined. Through the designing of the heavy-reaction mass oil–feeding methods and optimizing the oil-feeding angle of the piston rod, we intend to improve the flow pattern of the vibroseis vibrator hydraulic system, and reduce the hydraulic disturbance in the vibrator hydraulic channel, with the purpose of improving the accuracy of vibration signal excitation. The findings of this research can effectively reduce the distortion of seismic prospecting signals and improve the quality and efficiency of oil and gas exploration.
Analysis of the mechanism of the influence of the horizontal oil inlet on the vibroseis vibration
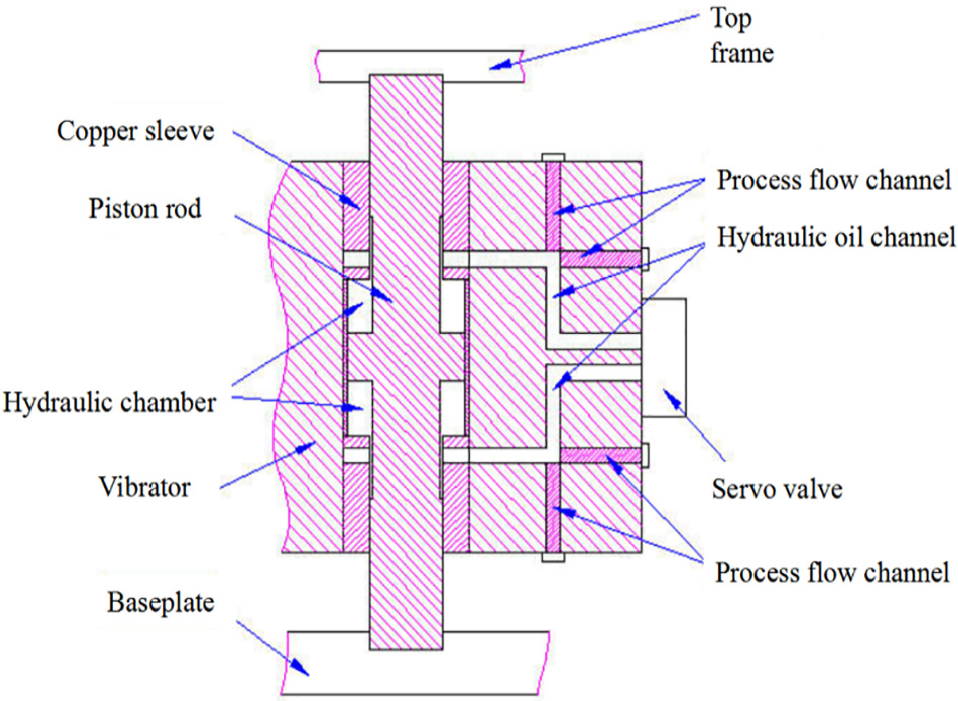
In the working process of the vibrator, the use of a horizontal oil inlet means that the hydraulic flow path is set inside the reaction mass. 13 As shown in Figure 1, the high-pressure oil enters the upper and lower chambers of the reaction mass alternately by operation of the servo valve so that the oil flow in the reaction mass will have two different connections. The pipe shown in yellow in Figure 2 is the upper oil passage connected to the upper chamber of the vibrator. The pipe shown in light orange is the lower oil passage connected to the chamber of the vibrator located below. A constant pressure variable-displacement pump is used during the operation of the vibrator. The inlet pressure is 17.5 MPa, and the outlet pressure is 0.62 MPa. 14

Schematic diagram of the horizontal reaction mass.

Horizontal oil inlet flow channel.
As shown in Figure 3, regardless of the type of connection of the flow channel, since the high-pressure oil always passes through the right side of the reaction mass, a force F is generated at the corner Q. The force F is translated in the same plane, and according to the translation theorem of force, the force at Q is translated to the x axis, generating a force acting in the negative x direction of the reaction mass and a rotational torque M around the z axis. During the reaction mass movement, F will cause x direction interference of the reaction mass. The reaction mass will be deflected counterclockwise around the piston rod, creating an interference in the x and y directions.

Different connections of the hydraulic flow channels.
Study of the disturbance suppression of the improved vertical oil inlet design
Vertical oil inlet vibrator structure
As is known from the previous analysis, the deflection torque and bias force of the reaction mass in the horizontal oil inlet (as shown in Figure 4) are the main sources of the large vibration of the vibrator. Therefore, to reduce the effect of the lateral oil inlet on the vibration of the vibrator, the design of the vibrator oil inlet mode should be improved; here, we eliminate the hydraulic channel of the reaction mass and vertically open the hydraulic channel to the inside of the piston rod, obtaining the vertical oil inlet mode, as shown in Figure 5.
Improvement of the horizontal oil inlet mode.

Vertical oil inlet mode.
Comparison and analysis of the simulation results of two types of oil inlets
The fluid–solid coupling problem is a branch of mechanics at the interface of fluid mechanics and solid mechanics, which mainly studies the influence of the solid surface deformation on the static and dynamic flow field and the various deformation behaviors of the solid under the action of the flow field, 8 eventually changing the distribution and magnitude of the fluid load. In the field of fluid–solid coupling research, Khalak and Williamson 15 performed a systematic experimental study on a cylindrical vibration system with a low mass damping ratio and classified the vortex-induced vibration system based on the reduction damping coefficient. As a typical pipeline infusion system, the hydraulic system has a highly significant impact on the safety of the hydraulic system. The fluid–solid coupling method has become an effective approach for the study of coupled pipeline vibration. Based on the traditional water hammer theory, Tijsseling 16 studied the fluid–solid coupling phenomenon in thick-walled liquid-filled pipes. Zhang and Vairavamoorthy 17 studied the linear analysis method of the transient flow in a fluid conveying pipeline. In 2002, Bilir 18 proposed a numerical simulation of the convective solid coupling problem using the immersion boundary method. The coupling characteristics, the coupling degree and the mathematical description are given in his work. To date, this calculation method has been successfully applied to fluid mechanics calculations. In this approach, the simulation model of the vertical oil inlet vibrator is set up according to the vibrator structure of the vertical oil-entering mode, and the simulation analysis of the piston rod deformation is carried out using the coupled fluid–solid numerical simulation theory.
The fluid–solid coupling governing equations are composed of fluid governing equations, solid governing equations, and fluid–solid coupling equations.
1. Fluid governing equations
The hydraulic oil in a hydraulic pipeline of the vibrator reaction mass is an incompressible fluid, and the flow state of the oil is a highly complex three-dimensional unsteady flow at a high-speed reversal time of the servo valve. In engineering, the Navier–Stokes (NS) equation is usually used to describe a turbulent flow. The time-averaged control model is given by Wang: 19
Continuity equation

Momentum equation

where ρ is the density of the flow, t is the time, xi is the spatial coordinate along the x direction (i = 1, 2, 3), ui is the time-averaged velocity along the i direction, p is the pressure, and μ is the time-averaged viscosity.
The Reynolds stress equation is given by
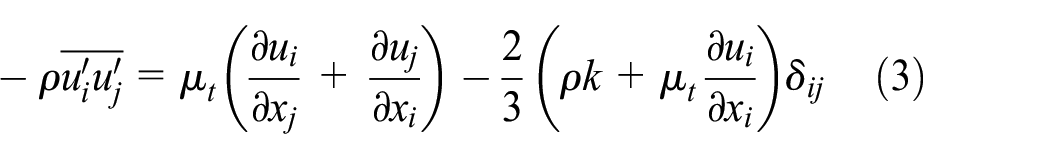
where k is the turbulent kinetic energy, ut is the turbulent viscosity coefficient, and δij is the Kronecker function specified as
The equations for turbulent kinetic energy k and dissipation rate ε for steady incompressible fluids are given by


where Gk is the stress source term

The turbulent kinetic energy k and the dissipation rate ε represent the energy-consumption level and signal difference in the vibrator that are caused by the turbulence from the high-frequency commutation of the vibrator. k and ε are highly related to the characteristic parameters of the hydraulic oil flow field, such as the force of the piston rod, flow field trace, pressure loss, and turbulence intensity.
2. Solid governing equation
The solid governing equation is derived from Newton’s second law, it is given by

where ρs is the solid density, σs is the cauchy stress tensor, fs is the volume force vector, and
The energy equation is not considered in the aforementioned solid governing equation. If the energy equation is necessary, the thermal deformation term caused by temperature difference should be added to the solid part, it is given by

where
3. Fluid–solid coupling equations
The fluid–solid coupling obeys the basic conservation principle. Therefore, the variables of the fluid and solid, such as stress τ, displacement d, heat flux q, and temperature T should be correspondingly equal and conservative. The fluid–solid coupling equations are given by

where f is the fluid part, and s is the solid part.
Comparison and analysis of the deformation of the piston rod
The deformation of the piston rod causes the deviation of the reaction mass motion trajectory that further increases the vibration disturbance of the vibrator and affects the quality of the output signal. Therefore, reducing the deformation of the piston rod will help reduce the disturbance of the vibrator and will improve the quality of the output signal. A vertical piston rod model of the oil inlet mode was established. As shown in Figure 6, a fluid–solid coupling analysis of the piston rod under the vertical oil inlet mode was carried out. To set the boundary conditions, the upper and lower ends of the piston rod were fixed on the roof and the plate, respectively, creating a fixed constraint, as shown in Figure 7. Therefore, a fixed-support was selected. The contact between the piston rod and the fluid occurred at the fluid–solid coupling surface. After the fluid–structure interaction calculation was completed, the deformation of the piston rod was extracted and compared to the results obtained for the lateral oil entry mode.

Vertical oil inlet model of the piston rod.

Schematic diagram of the forces of the piston rod.
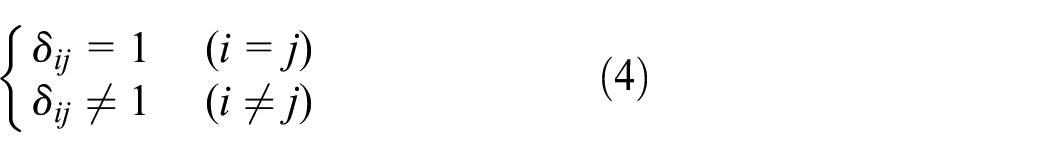
The analysis of Figure 8(a) shows that the lateral deformation and amplitude of the piston rod in the x direction are smaller than those of the vertical oil-injection mode. However, Figure 8(b) shows that the deformation of the piston rod in the negative x direction is much smaller than that of the lateral entry piston rod. Generally, the total equivalent deformation of the vertical inlet piston rod is smaller than the equivalent deformation of the transverse piston rod. Therefore, after the vertical oil inlet model is applied, the x direction deformation of the piston rod is significantly reduced, and the effect of the interference of the x direction deformation of the piston rod on the vibrator is reduced.
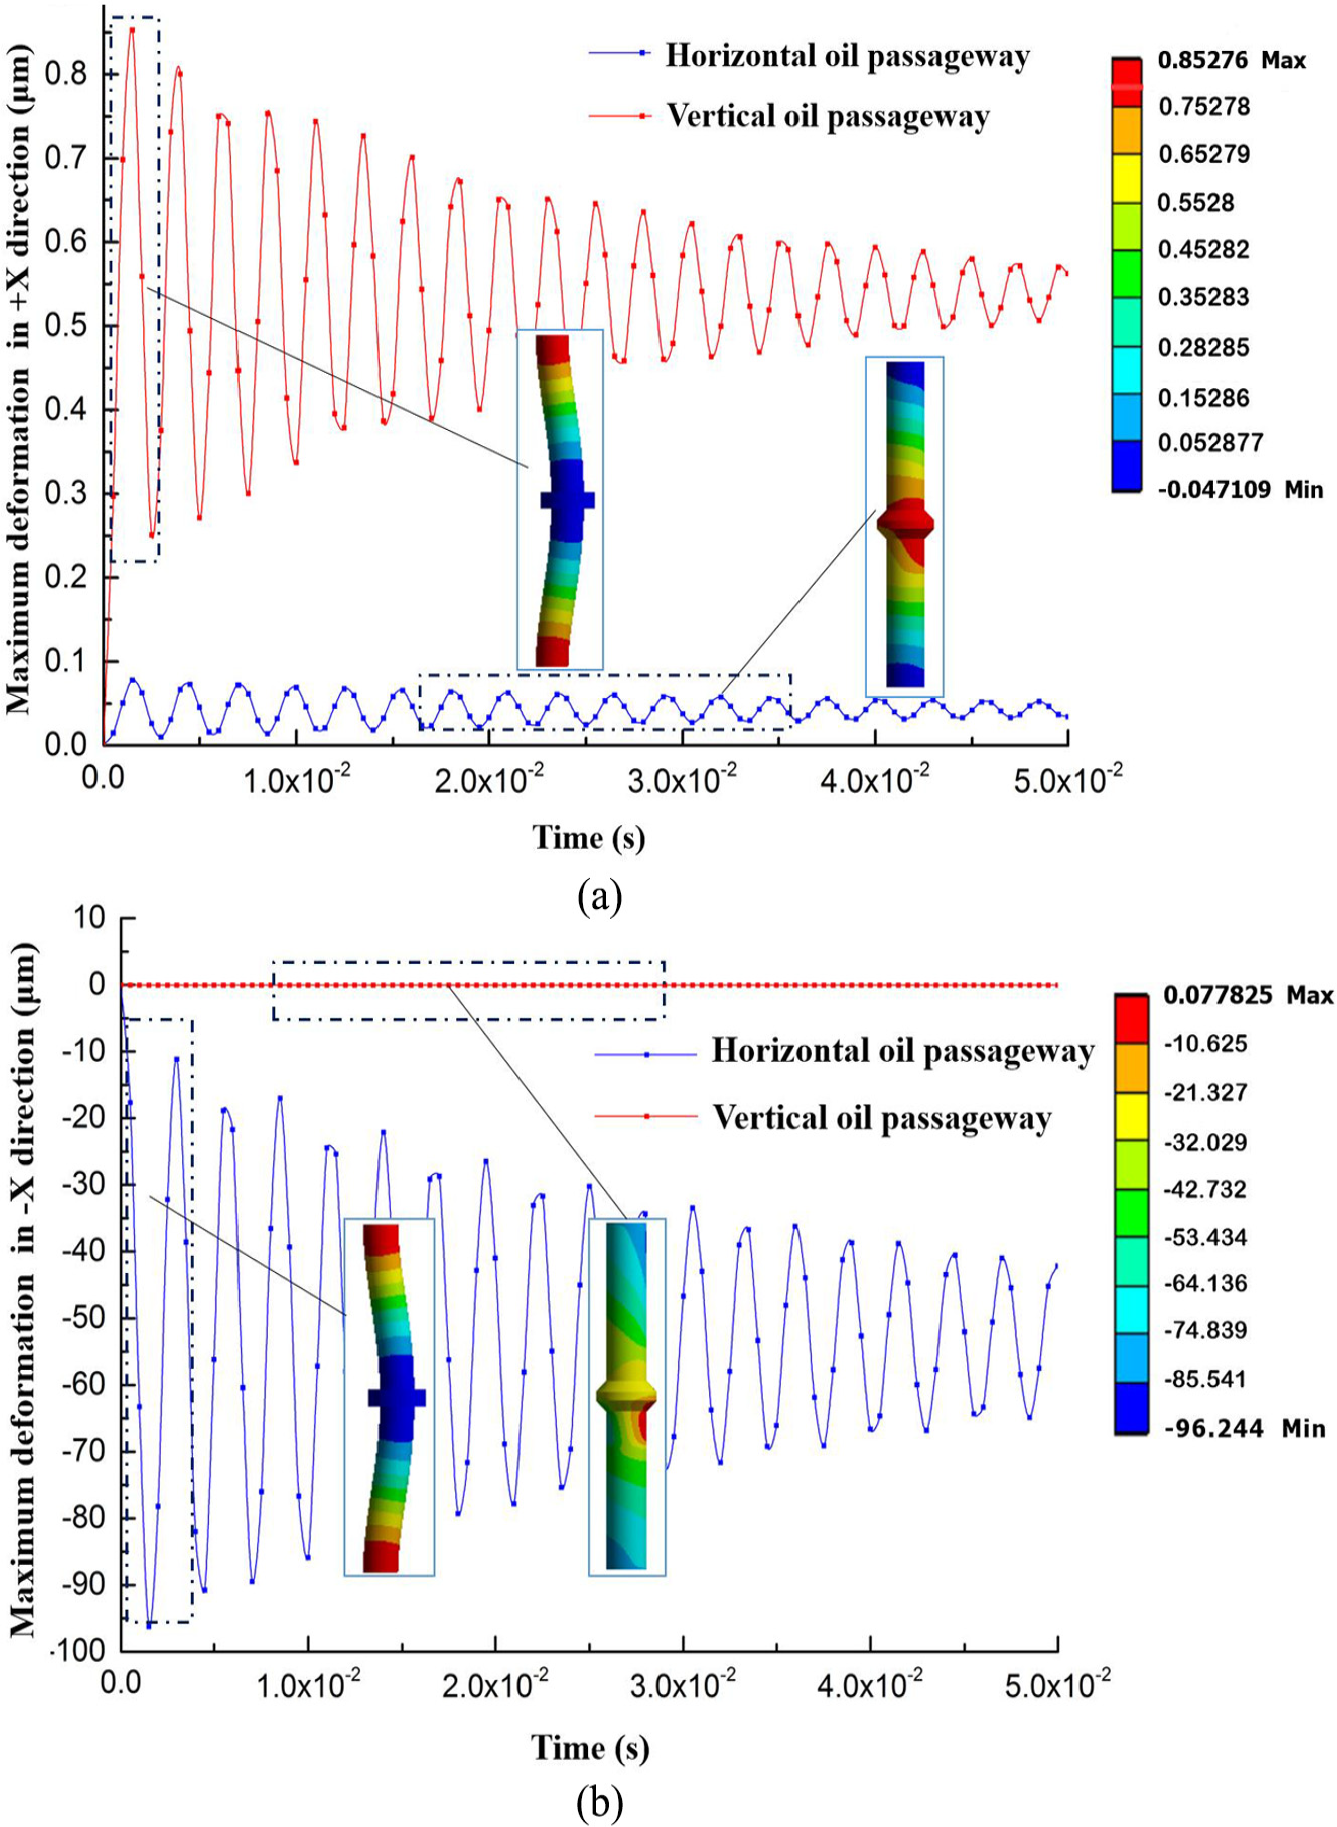
Comparison of the piston rod deformation in the x direction: (a)+x direction and (b) –x direction.
An examination of Figure 9 shows that the deformation of the vertical and straight piston rod in the y direction is smaller than that of the lateral piston rod and that the amplitude of the fluctuations is also lower. Therefore, the influence of the y direction deformation of the piston rod on the vibrator disturbance is reduced by adopting the vertical oil inlet mode.

Comparison of the piston rod deformation in the y direction: (a) +y direction and (b) –y direction.
In summary, after the vibrator is used in the vertical oil inlet mode, the reaction mass is no longer deflected, and the deformation of the piston rod is noticeably reduced, strongly reducing the effect of the deformation of the piston rod on the vibration of the vibrator. Thus, the vibration disturbance and the output signal of the vibrator will be significantly improved.
Further optimization of the vertical inlet oil vibrator
Structure design and modeling of different inlet angle vibrators
The vertical inlet method of the vibrator can effectively reduce the disturbance experienced by the vibrator. To further analyze and optimize the oil inlet flow path of the vibrator, the effects of different oil inlet angles on the disturbance of the vibrator under the vertical oil inlet mode are studied. The 45° oil inlet angle is commonly used in the vertical inlet method vibrator. The 0° and 90° oil inlets are two extreme design structures. To determine the law governing the influence of the different oil inlet angles, three vertical oil inlet vibrators are proposed that differ in the angle between the inlet and outlet of the upper cavity and the piston rod axis (or vertical flow channel), with oil inlet angles of 45° (Figure 10), 0° (Figure 11), and 90° (Figure 12).

Schematic of the 0° oil inlet vibrator.

Schematic of the 45° oil inlet vibrator.

Schematic of the 90° oil inlet vibrator.
Using the flow field model and the piston rod physical model, simulations were performed for the comparative analysis of the vibrators with the three different inlet angles (0°, 45°, and 90°). The boundary conditions are shown in Figures 13 and 14.

0° oil inlet simulation model: (a) fluid domain model and (b) piston rod model.
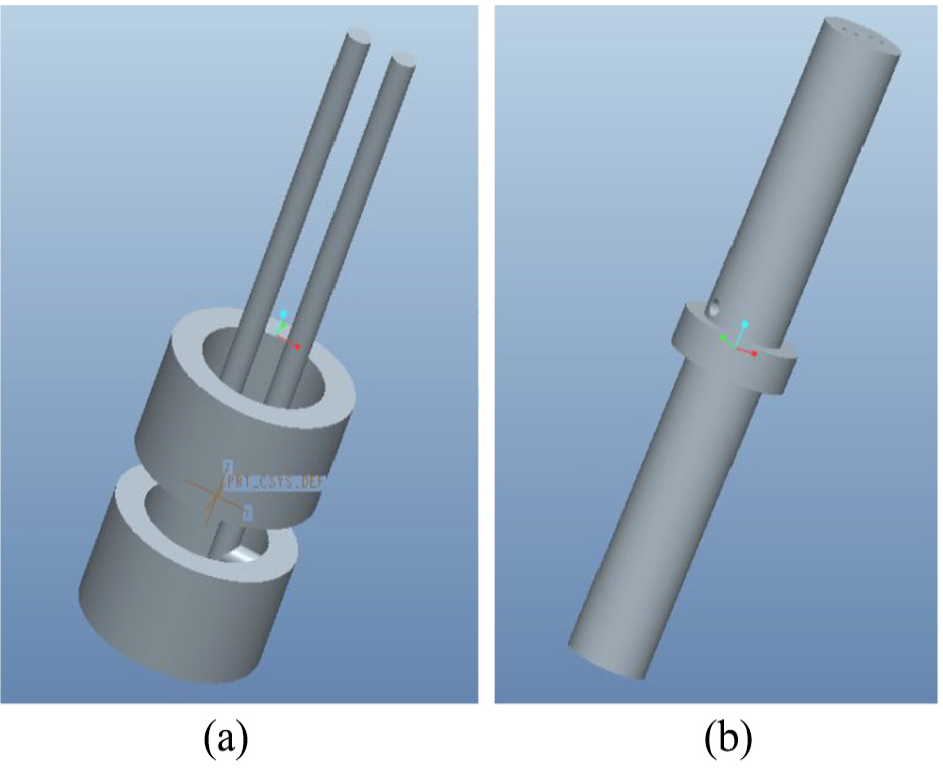
90° oil inlet simulation model: (a) fluid domain model and (b) piston rod model.
Comparative analysis of the deformation of piston rods at different inlet angles
The maximum deformation curve and the deformation diagram of the piston rod were compared for the three different inlet angles. In the following figures, the red curve shows the deformation of the piston rod for the 45° inlet, the green curve shows the deformation of the piston rod for the 0° inlet, and the blue curve shows the deformation of the piston rod for the 90° inlet.
Deformation analysis of the piston rod in the x direction
The maximum deformation curves of the piston rod in the x direction at the three different inlet angles are compared in Figure 15.
Analysis of Figure 15 shows that under the conditions of the 45°, 0°, and 90° oil inlets, the maximum positive and negative deformation curves of the piston rod show approximately multiperiodic weakening. The comparison shows that the deformation of the 90° oil inlet rod is the smallest in the positive and negative x directions compared to the displacement of the piston rod for both the 0° and 45° oil inlets.
From the analysis of the deformation of the piston rod in the x direction, the following is observed. (a) The x positive deformations of the 45°, 0°, and 90° oil inlet rods are mainly concentrated in the middle and lower positions of the piston rod, and the deformation of the 90° oil inlet piston rod is the smallest at 0.82145 μm, less than both the 0° (1.1935 μm) and 45° (0.85276 μm) oil inlet piston rod deformations. (b) The x negative deformation regions of the 45°, 0°, and 90° oil inlet rods are mainly concentrated at the two ends of the piston rod and that of the 90° oil inlet mode is equal to 0.066353 μm, which is smaller than those of the 0° (0.06939 μm) and 45° (0.06728 μm) oil rod deformations.

x direction deformation curves and contours of the piston rod: (a) +x direction (b) −x direction.
Deformation analysis of the piston rod along the y direction
The piston rod deformation curve in the y direction is shown in Figure 16.
The change in the +y and –y deformation curves of three piston rods with different inlet angles are almost periodic and decrease, but the decrease in the change target is not zero.
The piston rod deformation in the +y positive direction of the 45°, 0°, and 90° oil inlets are mainly concentrated in the central part of the piston rod, and the 0° oil inlet deformation is 0.096823 μm, smaller than those of the 45° (0.10156 μm) and 90° (0.14199 μm) oil inlets.
In the three oil inlet modes, the deformations in the –y direction are mainly concentrated in the middle of the piston rod on the right side. Among these, the deformation of the 90° oil inlet is smaller and is equal to 0.11449 μm, which is smaller than the values for the 45° (0.16744 μm) and 0° (0.19829 μm) inlets.

y direction deformation curves and contours of the piston rod: (a) +y direction (b) −y direction.
The total maximum deformations in the x and y directions and in the xy plane were analyzed and calculated; Table 1 provides the results for the three vibrators with different angles.
Maximum total deformation for the three inlet angles.
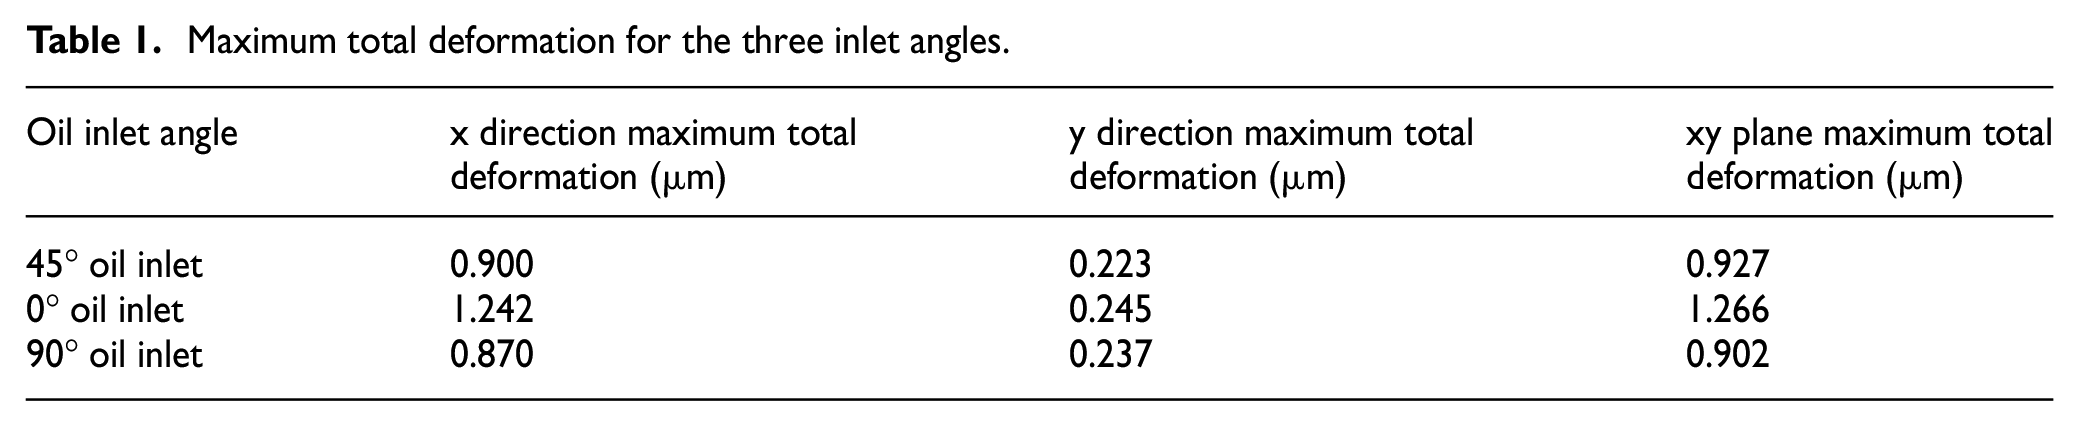
The maximum total deformation in the xy plane was analyzed, and the results show that the deformation of the 90° oil inlet is 0.902 μm, 28.752% and 2.697% smaller than those of the 0° and 45° oil inlets, respectively. It was observed from the comparison of the deformations of the piston rod that the 90° oil inlet piston rod is better than that with the 45° or 0° oil inlets; thus, the 90° oil inlet structure has the minimal perturbation effect on the piston rod.
Flow simulation analysis of different oil inlet angles
45°, 0°, and 90° oil inlet channel models were established, and the flow analyses of the reaction mass were carried out to determine the influence of the different oil inlet angles on the reaction mass flow. The disturbance mechanism of the reaction mass piston rod was understood by changing the flow field and pressure distribution to optimize the oil inlet angle. Controlled by the servo valve, the oil inlet and outlet of the reaction mass changed alternately in the upper and lower cycles. For the first half of a cycle, the entrance was set as the pressure inlet, and the entrance pressure was 17.5sin2πft MPa, while the export was set as the pressure outlet and the export pressure was 0.62 MPa, as shown in Figure 17. In the second half of the cycle, the entrance was set as the pressure outlet, and the outlet pressure was 0.62 MPa, while the export was set as the pressure inlet, and the entrance pressure was 17.5sin2πft MPa, as shown in Figure 18; the vibrator frequency f was 20 Hz.

The boundary conditions of the first half of a cycle.

The periodic boundary conditions of the second half of a cycle.
The flow path of the reaction mass reflects whether the flow is in the turbulent fluid state. The pressure distribution determines the magnitude of the pressure loss; a greater pressure loss corresponds to a lower efficiency of the hydraulic system. Therefore, the fluid trace and flow pressure distribution of the flow field of the reaction mass were analyzed according to the different inlet angle structures.
1. Fluid trace analysis
The fluid traces of the 45°, 0°, and 90° oil inlet channels are shown in Figures 19–21, respectively.

Flow field trace of the 45° oil inlet vibrator.

Flow field trace of the 0° oil inlet vibrator.

Flow field trace of the 90° oil inlet vibrator.
The flow trajectories of the 45° oil inlet at different times are shown in Figure 19. When t = 0.0025 s, the upper and lower fluids are in the laminar flow state. With an increase in time, at t = 0.0125 s, the vibrator hydraulic pressure reaches peaks, and the forward flow into the cavity of the turbulent vortex is the highest; at t = 0.0375 s, the hydraulic oil changes directions, and the flow turbulence vortex is high with no decreasing trend; and when t = 0.0500 s, the pressure is 0, and while the vibrator is moving, the fluid is not moving, so that the flow path is disordered and irregular.
The flow trajectories of the 0° oil inlet at different times are shown in Figure 20. The flow traces change from laminar to turbulent gradually. At t = 0.0025 s, the hydraulic flow was laminar; at t = 0.0125 s, the flow field in the cavity passage began to trace the vortex, albeit not on a large scale; and with an increase in time t = 0.020 s, the turbulent vortex intensity flow trace shows that the maximum turbulence occurs mainly in the upper and lower flow passages, the fluid inlet, and the upper and lower corners. During the second half of a cycle, the hydraulic oil flow is reversed, and at t = 0.04 s, the number of turbulent vortices decreased; for the vibration at the end at t = 0.0500 s, when the pressure is 0, while the vibrator is in motion, the fluid does not move, so that the flow path has a random distribution.
The flow trajectories of the 90° oil inlet at different times are shown in Figure 21. When t = 0.0025 s, the upper and lower cavity fluid flows are in a laminar state until the liquid pressure peaks at t = 0.0125 s. At this point, the fluid trace at the upper cavity flow line starts to tend toward stochastic flow, with a very small-scale eddy current. For the lower half-period hydraulic oil commutation at t = 0.0375 s, the turbulence-enhancement trend is not obvious, with a small disturbance in the corner of the runner and flow in and out of the upper and lower cavities. When t = 0.0500 s, the pressure is 0, and the fluid trace is disordered.
To summarize, ① three different inlet flow field traces were observed in the transition from laminar flow to turbulent flow, and the turbulence mainly occurs in the channel section with a sudden change in position. ② For the 45° oil inlet, hydraulic flow turbulence is observed at the earliest time, whereas for the 90° oil inlet, the onset of the turbulent flow of the hydraulic oil occurs later, showing that for the minimum strength, the internal fluid flow is relatively stable and has the smallest disturbance.
2. Analysis of the pressure distribution in the flow field
The pressure distribution in the flow field of a reaction mass directly affects the response accuracy of the hydraulic excitation signal of the source and the degree of the disturbance of the vibrator reaction mass. The pressure field of the reaction mass passage was analyzed under the 45°, 0°, and 90° oil inlet scenarios, and the analysis results are shown in Figures 22–24.
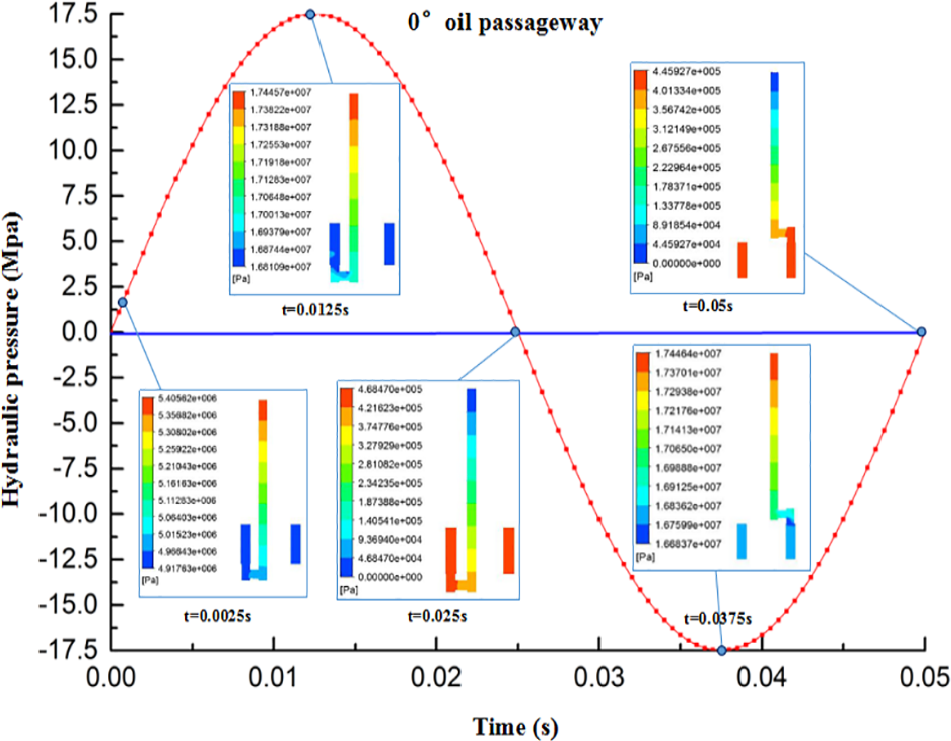
Pressure distribution of the high-pressure channel at the 0° oil inlet at different times

Pressure distribution of the high-pressure channel at the 45° oil inlet at different times.

Pressure distribution of the high-pressure channel at the 90° oil inlet at different times.
In Figure 24, the pressure distribution of the high-pressure channel at the 90° oil inlet is shown at different times.
t = 0.0025 s (exerting pressure): the inlet pressure of the 45°, 0°, and 90° inlet flow channels is 5.4056 MPa, and due to the pressure loss, including loss of pressure and loss of local pressure, the pressure distribution is stepped.
t = 0.0125 s (1/4 cycles): at the same time, the entry pressure peaks and the runner pressure increases; the pressure distribution is stepped; and there is a reduction in the local pressure at the corner of the runner, causing pressure loss in the passage through the oil inlet.
t = 0.0250 s (half cycle): at this point, the inlet pressure is 0, but the flow pressure is not 0. This is due to the lag phenomenon of the pressure transition.
t = 0.0375–0.0500 s (3/4 cycle): hydraulic oil enters the lower chamber; the pressure of the channel changes with the change in the inlet pressure; and the pressure distribution is stepped, with pressure fluctuations observed in the corner of the flow channel.
The excessive pressure loss along the flow path results in the difference between the excitation signal and the input excitation signal. The local pressure loss at the elbow, joint, valve port, and sudden change section of the runner causes pressure fluctuation in the hydraulic flow channel. This is the source of the hydraulic disturbance of the reaction mass. Thus, by analyzing the magnitude of the pressure drop, we further analyze the advantages and disadvantages of the different inlet angles, and the pressure drop curves of the three different inlet angles are shown in Figure 25.
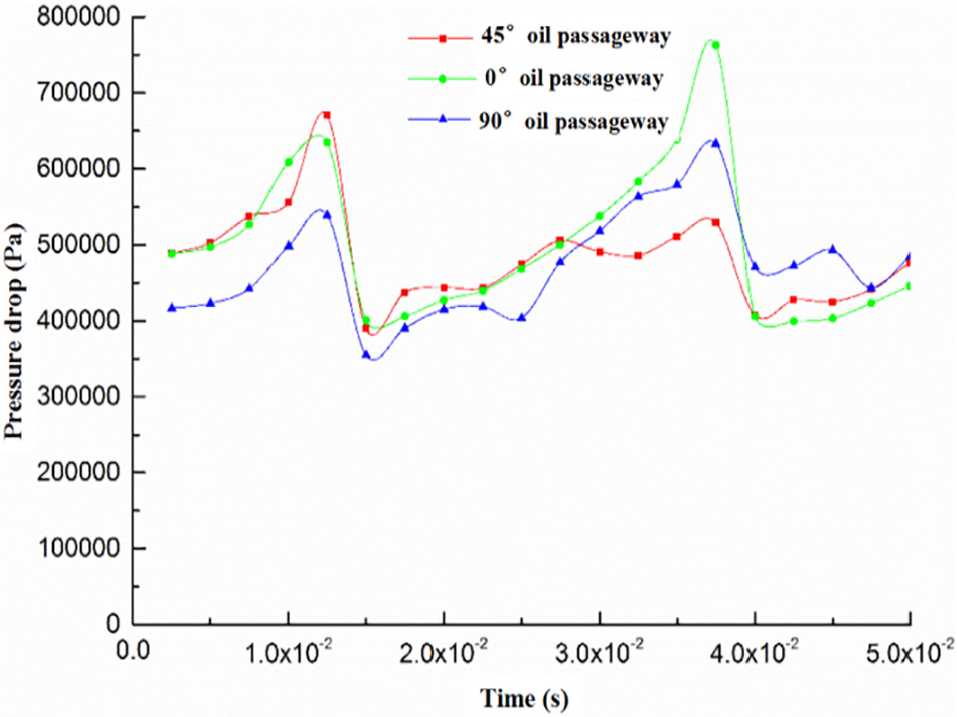
Curves of the pressure drop as a function of time.
The aforementioned analysis shows that the effects of different inlet angles on the flow field and piston rod deformation differ slightly. Comparative analysis of the flow field shows that 90° oil injection is slightly better than 45° oil injection and 0° oil injection. Comparison and analysis of the deformation of the piston rod shows that the deformation of the piston rod for the 90° oil inlet is smaller than those for the 45° and 0° oil inlets. In summary, under the vertical oil inlet mode, 90° oil injection is better than the preceding 45° oil injection, and the 90° oil injection is better for controlling the kinetic energy of the vibrator; therefore, in the design and manufacture of vibroseis equipment, it is recommended to use the 90° oil inlet vibrator structure.
The vibrator disturbance test
To comparatively analyze the law governing the effect of the new hydraulic flow channel on the vibrator disturbance and verify the flow channel disturbance rejection effect of the optimized structure, disturbance testing was carried out for the horizontal and vertical (90°) oil inlet modes.
The experimental principle
Currently, the detection and evaluation of the vibrator disturbance is carried out by measuring the reaction mass disturbance curve. 20 For the convenience of the sensor layout and wire connection (as shown in Figure 26), three vertices on the top surface of the vibration reaction mass were chosen as the install sites of three orthogonal acceleration sensors; thus, a total of nine acceleration sensors were installed, as shown in Figure 27.

Test wire connection.
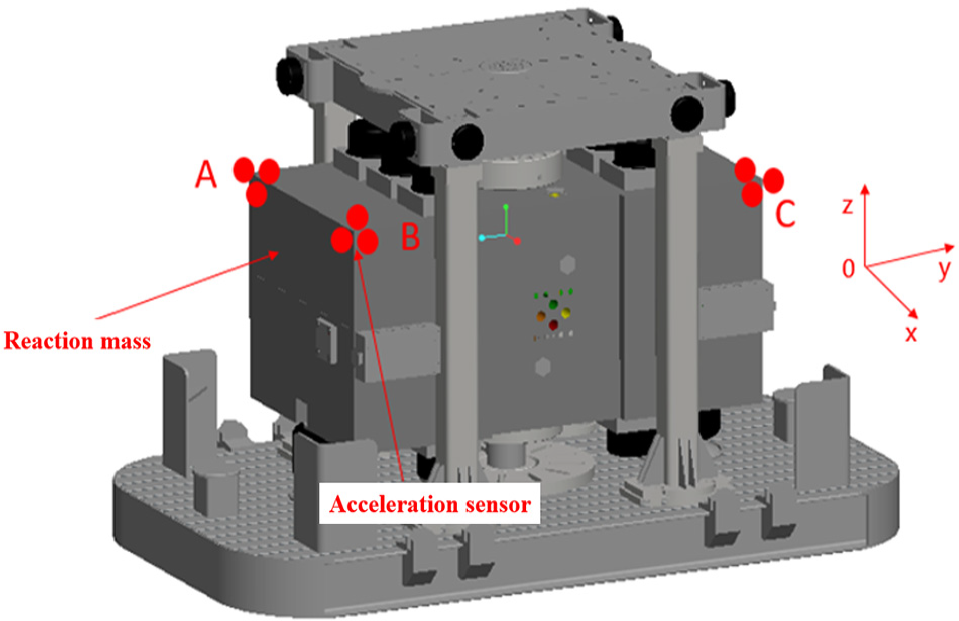
The position of the reaction mass acceleration sensors.
The acceleration of each point in the vertical direction and two orthogonal directions in the horizontal plane were measured, and the acceleration for all of the sampling times was used to obtain the acceleration curve of that point. Based on the acceleration curves of the three vertices, the disturbance curve of the reaction mass was obtained, and the disturbance of the vibrator was determined. The specific evaluation method used here indicates that if the reaction mass perturbation curve is a straight line in the vertical direction, there is no obvious disturbance in the vibrator. Otherwise, the vibrator is disturbed. Here, a greater deflection of the reaction mass perturbation curve corresponds to a larger disturbance. A smaller deviation from the vertical direction corresponds to a smaller disturbance.
According to the experimental principle, the testing equipment included data acquisition, processing, analysis, and display equipment, including a National Instruments (NI) tool and its supporting software LabVIEW.
The experimental process
The test process can be divided into three steps:
In the first step, the equipment layout was tested. The accelerometer was used to detect the acceleration in two orthogonal directions, namely, in the vertical direction and the horizontal plane of two types of vibrators (reaction mass and piston rod oil inlet model, as shown in Figures 28 and 29).
The second step was to obtain the test results. In the vibrator operation process, the acceleration sensor detection point of the acceleration was transmitted by the NI instrument to LabVIEW, and LabVIEW points were collected at each sampling for two orthogonal directions, namely, in the horizontal and vertical directions of the acceleration vector synthesis. Then, all the acceleration vector data of the sampling time were connected, obtaining the acceleration curve of the sampling points. Based on the acceleration curve of the three vertices, the curves of the reaction mass disturbance were obtained.
The third step is the analysis of the test results. The disturbance of the vibrator was determined based on the reaction mass disturbance curve.
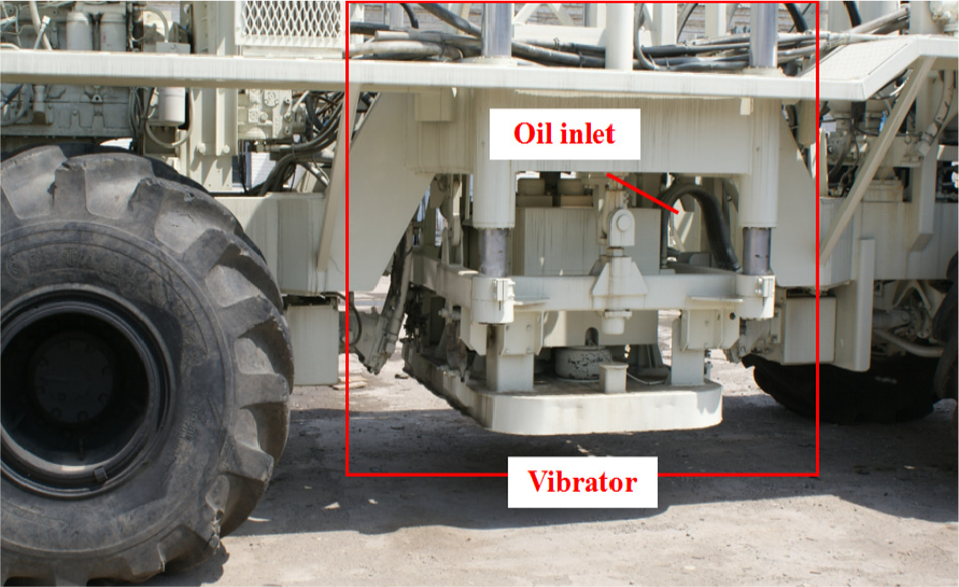
Reaction mass oil inlet mode vibrator (horizontal oil inlet mode).

Piston rod oil inlet mode vibrator (vertical oil inlet mode).
Experimental result analysis
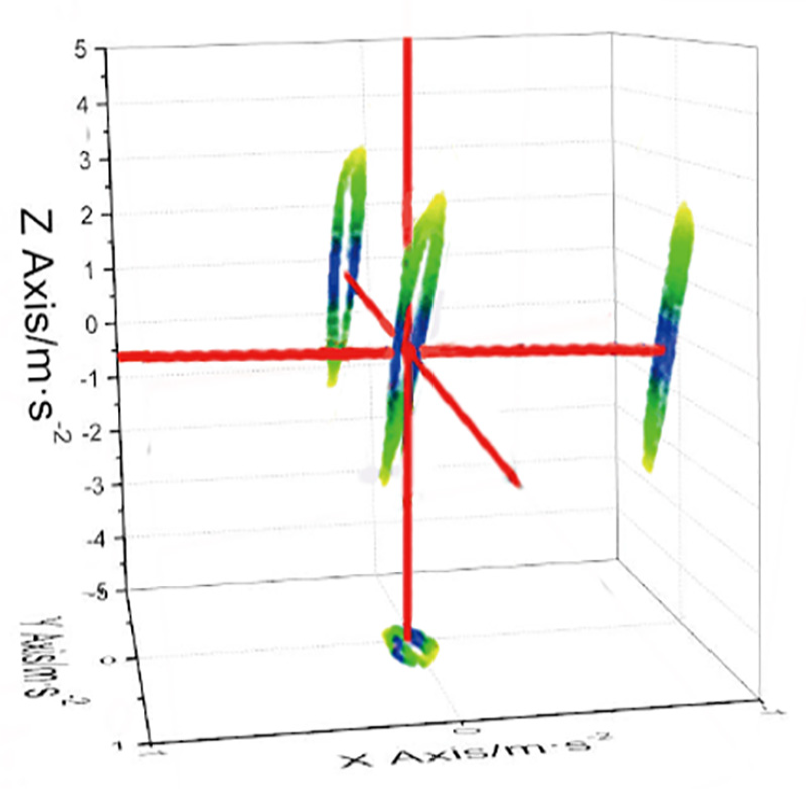
Figure 30 shows that in the horizontal plane (x and y directions), the reaction mass trajectory curve of the horizontal oil inlet exhibited a deviation from the theoretical trajectory and is a vertical space curve, causing a severe disturbance to the vibrator. In Figure 31, the trajectory of the 90° vertical oil inlet mode deviates from the theoretical vertical space curve, but compared to the horizontal model, the degree of deviation from the vertical direction decreases strongly, and the hydraulic disturbance was reduced.

The disturbance curve for the horizontal method.
The disturbance curve for the vertical method.
Extraction of the amount of disturbance in the x and y directions for the two types of oil inlets was performed for further comparison and analysis, as shown in Figure 32, where the blue-shaded area represents the reaction mass oil inlet, and the red-shaded area represents the oil inlet of the piston rod.

Comparison of the disturbance intensity between the horizontal and vertical oil passageways: (a) x axis and (b) y axis.
The quantitative analysis of the disturbance in the two types of oil inlets in the x and y directions indicated that the +x and –x disturbance amplitudes were reduced by 64.474% and 80.653%, respectively, and the +y and –y disturbance amplitudes were reduced by 63.873% and 42.808%, respectively. The perturbation values in the x and y directions were calculated by adding the absolute values of the disturbance in the corresponding direction, as shown in Table 2.
Comparison of the disturbance amplitude in the x and y directions for the two oil inlet modes.
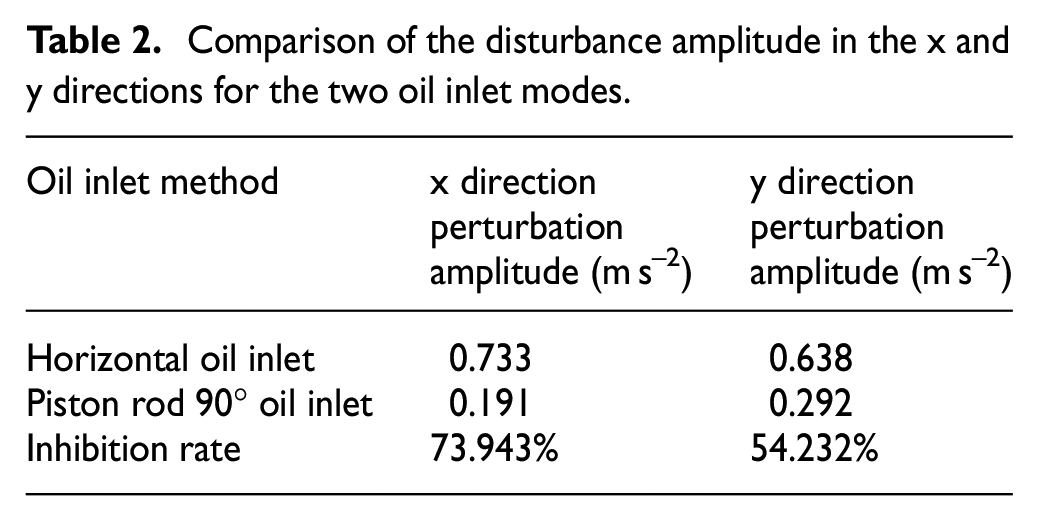
An examination of the data presented in Table 2 shows that compared to the result obtained for the reaction mass oil inlet mode, the disturbance amplitudes of the reaction mass in the x and y directions were reduced by 73.943% and 54.232%, respectively.
Although there is a large disturbance in the reaction mass in the x and y directions; when using the piston rod of the 90° oil inlet structure, the disturbance of the reaction mass was reduced by 73.943% and 54.232%, respectively. The average reduction is 64.087%. These results indicated that the level of reaction mass interference vibration was effectively suppressed and that the vibrator disturbance was reduced. Using the piston rod oil inlet method, the deformation of the piston rod is clearly reduced, as the reaction mass no longer suffered the effect of the radial force of the piston rod and the reaction mass deflection torque, greatly alleviating the interference with the vertical motion of the reaction mass. The vibration of the vibrator was clearly improved. Therefore, using the piston rod 90° oil inlet mode can effectively suppress the vibration disturbance.
Conclusion
The bias force and torque generated by the offset of the vibrator horizontal oil inlet are the important causes of the reaction mass hydraulic disturbance and signal distortion. Elimination of these forces and moments will help to reduce the disturbance of the geophysical signal.
After adopting the vertical oil inlet method, the amount of the deformation of the piston rod under the action of excitation was very small, the deformation had almost no effect on the trajectory of the reaction mass, and the disturbance amplitude of the vibrator was significantly reduced. The design of the oil inlet structure of the vibrator should be changed to include a vertical oil inlet structure.
Oil inlets with three different angles (0°, 45°, and 90°) were designed, and the deformation of the piston rod, the flow state of the hydraulic chamber, and the pressure drop were analyzed and compared. The results show that the 90° inlet flow channel design induces the smallest disturbances to the vibrator and the internal flow field. The turbulent intensity is the weakest, the duration is the shortest, and the pressure drop of the valve section is the smallest; thus, the 90° oil inlet structure is the best because the vibrator disturbance is minimized, leading to a significant improvement in the vibrator performance.
Through the comparative analysis of the 90° oil inlet design and the original reaction mass disturbance test, it was found that the improved hydraulic disturbance is greatly reduced, by 64.087%, and that the piston rod of the 90° oil inlet flow channel can effectively suppress the vibration signal distortion and improve the geophysical prospecting accuracy of vibroseis.
Footnotes
Handling Editor: James Baldwin
Declaration of Conflicting Interests
The author(s) declared no potential conflicts of interest with respect to the research, authorship, and/or publication of this article.
Funding
The author(s) disclosed receipt of the following financial support for the research, authorship, and/or publication of this article: This research received financial support from the National Natural Science Foundation of China (grant no. 41802198). This project was also funded by the Sichuan Science and Technology Program (grant no. 2019JDRC0093); it is supported by the China Postdoctoral Science Foundation (grant no. 2017M623309XB).