
Abstract
Fatigue life prediction of materials can be modeled by deterministic relations, via mean or median S-N curve approximation. However, in engineering design, it is essential to consider the influence of fatigue life scatter using deterministic-stochastic methods to construct reliable S-N curves and determine safe operation regions. However, there are differences between metals and composites that must be considered when proposing reliable S-N curves, such as distinct fracture mechanisms, distinct ultimate strengths under tension and compression loading, and different cumulative fatigue damage mechanisms including low-cycle fatigue. This study aims at conducting a review of the models used to construct probabilistic S-N fields (P-S-N fields) and demonstrate the methodologies applied to fit the P-S-N fields that are best suited to estimate fatigue life of the selected materials. Results indicate that the probabilistic Stüssi and Sendeckyj models were the most suitable for composite materials, while, for metals, only the probabilistic Stüssi model presented a good fitting of the experimental data, for all fatigue regimes.7
Introduction
Fatigue failure in materials, structural components, and structures is a factor that should be considered in engineering design to ensure safety and reliability during service life. This is even more critical in structural/dynamic (mechanical) designs that use a combination of metallic materials and polymer matrix composites, or when metallic materials are replaced by composites. It is important to underline the significant difference between the effects of cyclic stress at the microscopic and macroscopic levels, which may explain the heterogeneous fatigue behavior of these materials. The predominance of loading, in either the region of tension or compression, leads to significant differences between the composite with a much lower tensile fatigue limit in compression-compression than tension-tension, the opposite behavior to metals that do not undergo fatigue when compression is loaded.1,2 Fatigue damage in metals generally initiates near the surface and spreads perpendicularly to the load, behavior linked to cyclic plasticity and its isotropic mechanical properties.3–6 On the contrary, composites with a polymer matrix exhibit orthotropic mechanical properties, favoring far more complex fatigue damage than in metallic materials, including matrix cracking, delamination, fiber rupture, and failure occurring in a synergic, cumulative, and random manner. 7
Despite the differences in fatigue behavior of metallic materials and composites, both will fail when submitted to cyclic loads lower than the monotonic strength, and the predictability of this phenomenon suffers from inherent random nature of fatigue damage. This makes fatigue life analysis more complex and difficult to understand, because even in controlled experimental environments subject to constant nominal stress, identical samples exhibit high dispersions.8–10 As such, the stochastic nature inherent to the fatigue process of composite and metallic materials in deterministic approaches should not be overlooked. Knowing the scatter effects on the material behavior and its safe regions will result in reliable structural designs, since accurate predictions of material fatigue help to explain its effect on structural elements11–14 or components.14–18
One way of synthesizing the number of factors involved in fatigue life predictions is to reduce the model to the variables that explain cause and effect. That means fitting the fatigue test cycles,
This purely deterministic model generates average life curves, which are not relevant for design that needs to consider the influence of scatter when estimating confidence levels, in order to control the design safety factor and, in turn, costs. Thus, using deterministic-stochastic methods to construct probabilistic S-N fields (P-S-N fields) provides more reliable estimates for structural design.
In engineering, simple P-S-N curves are normally created by using linear regression of log(N) versus log(σ) data and determining an average S-N curve with its standard deviation, assuming a log-normal distribution for the number of cycles to failure. Next, safety margins are established by applying standard deviation–based corrections of 2σ or 3σ to the mean S-N curve, resulting in high safety levels in all fatigue regions. This is the case for most existing design codes, such as EC3, BS5400, and AASHTO, which do not take into account the statistical results of sample size, possible confidence/reliability levels required, or that the dispersion of the number of cycles to failure is far from the fatigue domain and may not be suitable for very high cycle fatigue lives. Nevertheless, this procedure is recommended by guidelines such as ASTM E739 standard. 19 However, Schijve 20 discusses the typical scatter in the S-N curves, which increases as fatigue life rises and stress amplitude declines, a property known as heteroscedasticity (see Figure 1).

P-S-N curve model at 5% failure probability: effect of increasing variability and reducing stress with a rise in fatigue life. 21
Creating P-S-N curves has been the object of study of several researchers22–27 in recent years, focusing primarily on suitable probabilistic distributions to represent fatigue life data. The most widely used probabilistic distributions for metallic materials and polymer composites are the log-normal and two- and three-parameter Weibull distributions.28,29 This was confirmed by Lee et al., 30 who conducted a goodness-of-fit test and concluded that the two-parameter Weibull distribution best adheres to the set of carbon fiber experimental data. It is also found in the scientific work developed by Hwang and Han 31 that the two-parameter Weibull distribution is more appropriate to estimate the scatter in fatigue-life for fiberglass composites when compared to the normal and log-normal distributions.
Two-parameter Weibull distribution was used by Whitney 32 and Sendeckyj 33 to model failure cycles and build P-S-N curves applied to composite materials. The first author used an approach presented by Wolff and Lemon, 34 who normalized the data of each stress range to a single group that fits two-parameter Weibull distribution and adopted the power law to formulate the S-N curve. The wear-out method applied by Sendeckyj also uses a two-parameter Weibull distribution, but this model transforms fatigue data into residual strength values, using interactive optimization of the distribution parameters and S-N curve fitting. Other researchers35–38 also suggest that fatigue data follow a two-parameter Weibull distribution. Barbosa et al. 39 also concluded that for a constant stress level, the failure cycles of composite materials preferably follow a two-parameter Weibull distribution.
For the case of metallic materials, log-normal and Weibull distributions are also widely used. The ASTM-E739 standard is widely applied to analyze the experimental fatigue life results of metals based on log-normal statistical distribution to estimate the confidence bands for the S-N and ε-N curves.40–45 Correia et al. 46 have used in its research work this ASTM standard with the purpose of generating the design curves for fatigue crack growth (FCG) rates applied to old steel bridges materials, demonstrating the applicability of this methodology to other laws. Raposo et al. 47 presented a methodology to generate P-S-N curves applied to the structural and mechanical components, based on the FCG modeling as a process of successive crack re-initiations, using local fatigue damage parameters (e.g. strain, Smith–Watson–Topper (SWT), etc.). Castillo and Fernández-Canteli 48 proposed a probabilistic fatigue life prediction model for the stress damage parameter based on three-parameter Weibull statistical distribution. This model was widely accepted by scientific community to describe the design fatigue behavior of the metals (see special issues49,50).
Schijve,20,51 Correia et al., 52 Zhao et al., 53 and Castillo and Fernández-Canteli 48 suggested that the Weibull distribution seems to be better suited to reproduce fatigue lifetime from a statistical standpoint, with theoretically justified distribution. Gallegos-Mayorga et al. 54 also used the Weibull distribution to evaluate the fatigue strength of double-shear riveted connections as well as the crack growth rate for metallic materials from old bridges.
Łukaszewicz 55 suggested a fatigue life evaluation of metals based on a complex stress state. On the contrary, Su et al. 56 presented a proposal of two strategies for time-dependent probabilistic fatigue analysis considering stochastic loadings and strength degradation based on the failure transformation and multi-dimensional kernel density estimation method. Kulkarni et al. 57 proposed a statistical wind prediction and fatigue analysis for wind turbine composite material blade under dynamic loads. Fatigue reliability evaluation for steel structural details/joints can be made using probabilistic stress-life method as proposed by Kang et al. 58
The aim of this review is to help designers in their decisions between the conventional models used to construct P-S-N curves for composite and metallic materials, choosing the appropriate probabilistic models for the specific material. It is worth mentioning that there are several differences between composites and metals, from their composition to the failure mechanisms. This results in differences in data scatter, fatigue threshold, deterministic S-N curve inflection points, and probability distributions. There are also differences between the various equations used, which may adapt better to a specific class of material, loading region set of experimental data. Thus, a more appropriate fatigue life estimation model can be used for the desired reliability level.
Fatigue models and methods for statistical analysis of stress life data
Fatigue models
The modeling of an S-N curve has been developed as a function of the number of parameters that constitutes the relationship between two of the main variables, the stress level (
The phenomenon of fatigue was observed by engineers in metal materials in the mid-19th century, due to the shortcomings of the railway wagons after a short period of work. In the 1850s, a German engineer, August Wöhler, conducted the first experimental fatigue program, testing wagon shafts to failure under alternating stress. The developed loads were recorded together with the number of rotations until failure, so it was possible to formulate the first S-N diagram or Wöhler curve

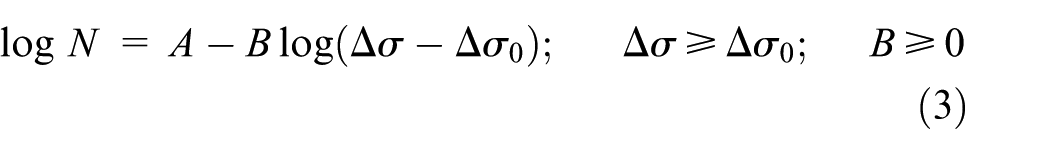
where A and B are regression parameters to obtain the linear relationship between the dependent variable, log N, and the independent variable,
In 1910, Basquin stated that the material resistance to fatigue follows a power law, with fatigue resistance being inversely correlated with the number of cycles required to the material failure. Basquin’s 59 model proposes a small difference with respect to the relation proposed by Wohler, using double logarithmic coordinates

Unlike the previous two models that are linear, the model of the Strohmeyer 60 model is not linear, since it proposes a smoothing of the linear models, inserting more parameters in the equations and making the estimation more complex
Although the fatigue limit (
Palmgren 62 added a parameter in the dependent term of the Strohmeyer relation, that is, log(N + D)

The equations (3) and (4) were the basis of the first analytical models used in the fatigue life prediction of bearings, according to scientific studies developed by Palmgren. 62
The S-N curves proposed by Weibull
63
incorporated the static stress (

In this way, this proposal makes it necessary to know and/or evaluate the five parameters, where two are constants of the material (
Kohout and Vechet 64 proposed a model based on the geometric modeling of the Basquin S-N curve, with smoothing in the high- and low-cycle fatigue regions, supported by the following relation

where
The previous models developed from the Basquin relation were modified using the fatigue limit of the metals to estimate the fatigue behavior throughout the life cycle. However, when it comes to composite materials, it is not possible to model an S-N curve by limiting to the fatigue limit parameters.
Composites are predominantly used models that consider the log N as an independent variable and σ as the dependent variable. The modification of the Basquin equation often used to create S-N curves of the composite materials is the generalized power law that obtained smaller estimation errors according to the scientific work developed by Freire Júnior and Belísio 28

where C is an exponential parameter of the material able to smooth the fall of the fatigue resistance in the low-cycle region.
The logistic S-N curve model was developed by Mu et al. 65 through the use of the logistic distribution to describe the fatigue life behavior of composite materials, since this function is very similar to the S shape, commonly observed in S-N curves (natural-logarithm). The logistic distribution adapted to model the S-N curve is given by equation (8)

where a, b, and c are material constants obtained by nonlinear least squares;
Methods for statistical analysis
ASTM standard practice
ASTM E739-91 standard is a common standard in S-N or ε-N curve construction, which considers the linear behavior of the curve on a semi-logarithm (equation (9)) and log-log scale (equation (10)). Curves are limited to the region of available experimental data and should not be extrapolated to predict fatigue life for a specific stress or strain ranges for reliability levels above 95% or failure likelihoods below 5%. The relationships between S-N curves are linear or linearized according to the expression desired for fitting


In these equations, stress, given by σ, can be the maximum stress or stress amplitude, and can be replaced by strain if the aim is to find the ε-N counterpart relation. The value of N corresponds to the number of cycles to failure, and in practice, including the samples that did not fail (run-out) in this model is not recommended. The values of “a” and “b” are the best-fitting parameters of the S-N curve that explain the cause/effect relation between stress level (independent variable) and number of cycles to failure (dependent variable). The probabilistic determination of fatigue life is not represented directly. To simplify this situation, the ASTM guideline assumes that the logarithms of the number of fatigue cycles are natural. In addition, the useful life variance is constant along the S-N curve, exhibiting heteroscedasticity with low- and high-cycle regions and the same dispersion for a constant stress or strain level. Assuming that log(N) is the random dependent variable and log(σ) or log(ε) is the independent variable, denominated Y and X, respectively, in a linear fit equation is given by equation (11)

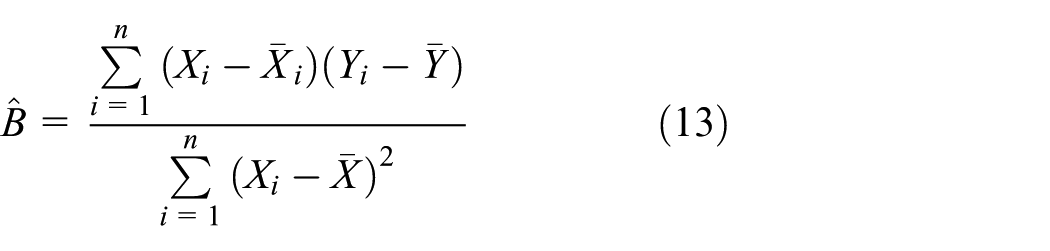
where the best-fit parameters A and B are the linear fit coefficients of the model that can be estimated by regression, considering the maximum likelihood method. To that end, equation (11) values are substituted by those estimated in equation (12)

where
Given that the model of the guideline stipulates that the number of cycles to failure follow a log-normal distribution, variance is given by equation (14)
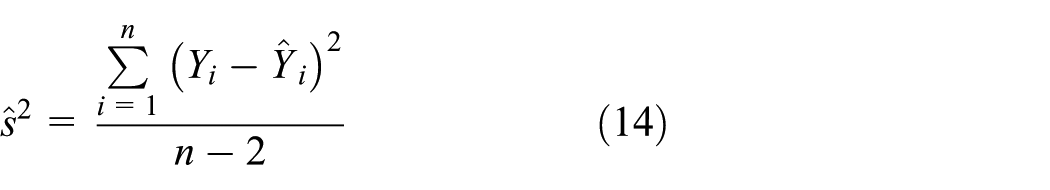
in which

in which
Although

The ASTM E739 standard 19 recommends a minimum number of specimens for the application of this standard practice that depends on the type of test program. For exploratory research and development tests as well as research and development testing of components and specimens, a minimum number of specimens ranging from 6 to 12 are required. For design allowables and reliability data, 12–24 specimens need to be conducted. The number of specimens for each material used in this study can be found in Table 1 and are within the limits indicated by the ASTM E739 standard.
Fatigue curve constants based on ASTM standard.

Figures 2 and 3 show examples of the generation of S-N reliability curves using experimental fatigue data (stress R-ratio equal to −1) of metallic material from the Luíz I Bridge in Portugal 66 and experimental data of laminate DD16 (stress R-ratio equal to 0.8) collected from Mandell and Samborsky, 67 respectively. The laminate DD16 is a glass fiber–reinforced plastic, manufactured by the resin transfer process using an orthopolyester matrix, reaching a fiber volume ratio of 36%. Its configuration is [90/0/±45/0]s, and in the 0° and 90° layers, D155 glass fiber fabric (527 g/m2) is used, and at ±45°, DB120 (393 g/m2). 67 A good agreement can be observed between experimental data and with the percentile curves corresponding to probabilities of failure of 5% and 50% for both materials under consideration. In Table 1, the obtained parameters using ASTM standard for both materials are showed.

S-N reliability curve based on ASTM E739 standard for the experimental fatigue data of the metallic material from the Luíz I Bridge, R = –1.

S-N reliability curve based on ASTM E739 standard for the experimental data of laminate DD16 collected from Mandell and Samborsky, 67 R = 0.8.
The S-N curve drawn according to the ASTM guidelines at probabilities of failure of 5%–95% would represent a confidence band, similar to the confidence interval, which uses the log-normal distribution (two parameters) to estimate the confidence band of estimators A and B. ASTM R739-91 standard does not recommend that the S-N or ε-N curves can be extrapolated outside the interval of testing.
Despite the simple application of ASTM E739 and the need for a small experimental dataset, its limitations include being unable to describe the fatigue behavior of the material, restricting application to the region where the experimental data are found; being unable to simultaneously assess regions with low- and high-fatigue cycles, as reported by Barbosa et al.; 66 and only allowing the use of log-normal distribution, neglecting the recognized importance of the Weibull distribution in failure analysis.
Sendeckyj’s wear-out model
Sendeckyj’s
33
wear-out or strength degradation model is based on three assumptions. The first is that the deterministic S-N equation is based on a physical phenomenon that considers damage accumulation with the application of cyclic loads. The second is that the material loses strength as damage accumulates, creating a cause and effect relation between the number of cycles and residual strength of the material. Finally, it assumes that static strength data can be described by a two-parameter Weibull distribution. To model S-N curves using the Sendeckyj method, deterministic equation parameters must be fit (equation (17)) simultaneously with the Weibull distribution parameters. Fatigue data (

In equation (17),

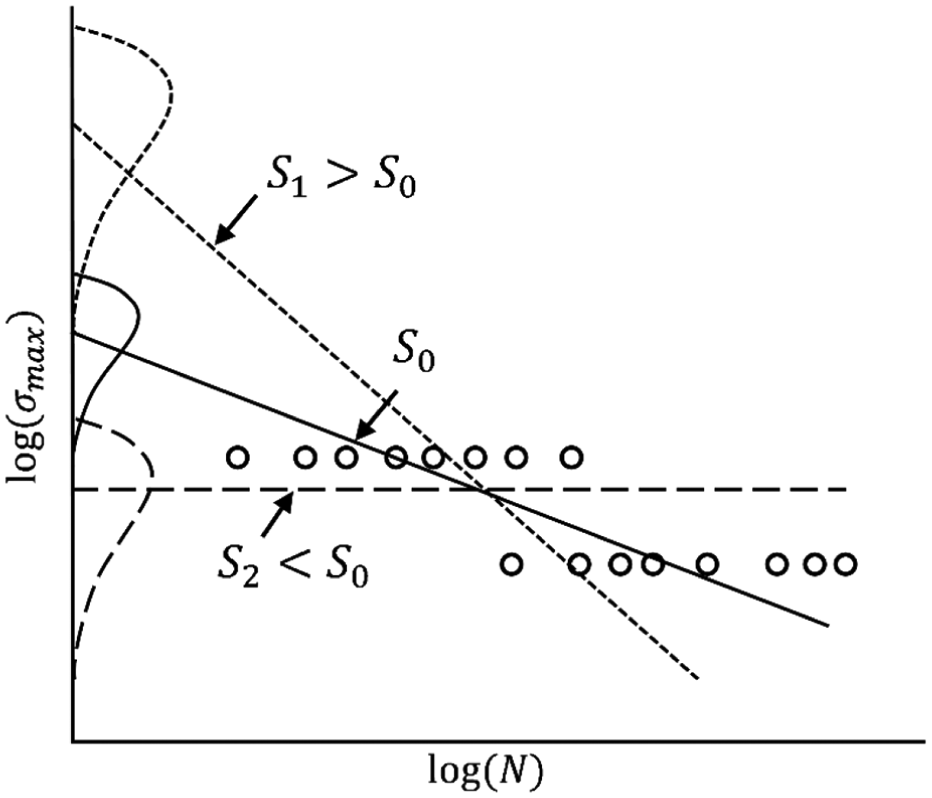
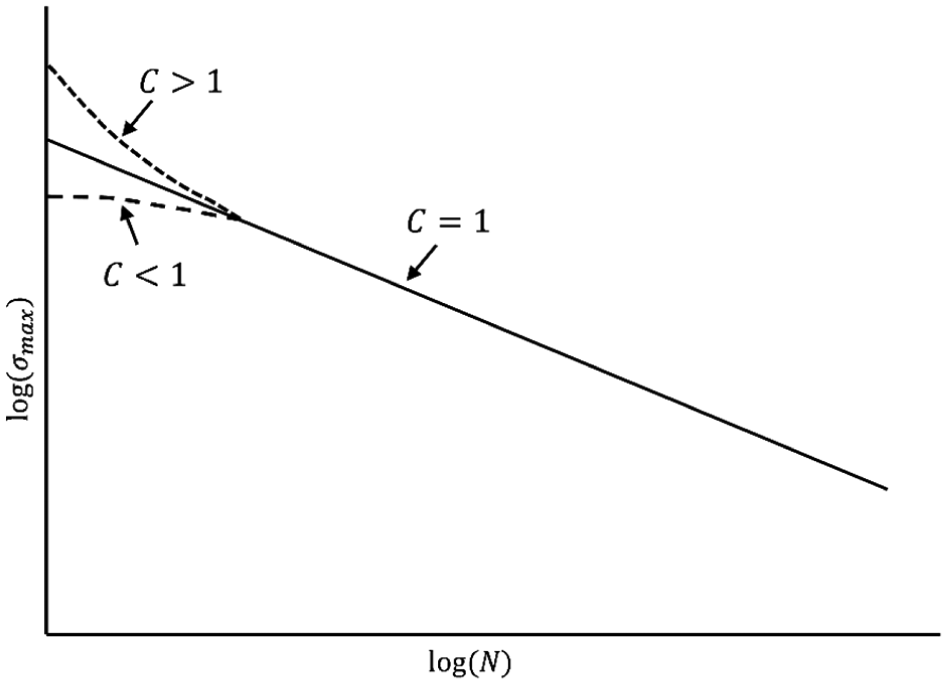
Parameter C of the previous equation (equation (18)) determines the S-N curve fitting in the low-cycle fatigue region. For C = 1, the S-N curve equation is reduced to the power law model. For C > 1, it is characterized by a high decline in static behavior to low-cycle region (Figure 4), and for C < 1, it characterizes a smoothed transition from static fault behavior to fatigue failure in the low cycle region, characterizing the expected behavior for most of the composites. 33 In the log-log graph (Figure 5), the S parameter determines the best-fit for clustering equivalent static stress data, that is, less dispersion.
Effects of C parameter on S-N curve fitting in the low-cycle region.
Effect of the slope on curve fitting and dispersion of equivalent static strength.
A heuristic fit between the parameters C and S and maximization of the Weibull distribution shape value (α) of equivalent static stress data should occur interactively until the lowest static data dispersion is found, resulting in the best fitting S-N curve to fatigue data. The two-parameter Weibull distribution is more appropriate for the static stress data. The evaluation of the Weibull parameters is made using the weighted least squares estimation (WLSE) method, taking into account the good performance for few experimental data as presented by Barbosa et al. 39
The likelihood of equivalent static data’s surviving is given by equation (19)

The probabilistic distribution of the fatigue life for a given maximum applied stress is obtained by combining equations (18) and (19). This procedure can be seen in Sendeckyj, 33 and the resulting equation is given by the following relation

The parameters C, S, α, and β of equation (20) are estimated using an interactive optimization process. An estimation of parameters is achieved when α reaches the maximum value.
The S and C constants of material are used to fit the S-N curve to the experimental data. Parameter S influences the slope of the equivalent static stress distribution curve (Figure 5), converging to equivalent static stress data with less dispersion. The ideal value of S0 converges to static data distribution with less dispersion, but when S1 > S0 and S2 < S0, values do not converge to lower equivalent static stress data dispersion; the resulting S-N curve slopes move further away from experimental fatigue data.
An example of applying Sendeckyj’s wear-out curve for both materials under consideration in this study, metallic material from the Luíz I Bridge and laminate DD16, can be observed in Figures 6 and 7, respectively. A good agreement can be considered in all fatigue regions for the DD16 laminate. For the metallic material from the Luíz I Bridge, a good agreement between quasi-static and low-medium fatigue regions is verified; however, in the medium-high cycle fatigue regime, a reasonable agreement between the experimental data and the percentile curves for 5% and 50% is not observed. In Table 2, the obtained parameters using Sendeckyj’s wear-out model for both materials are showed.

S-N reliability curve based on Sendeckyj’s wear-out model for the experimental fatigue data of the metallic material from the Luíz I Bridge, R = –1.
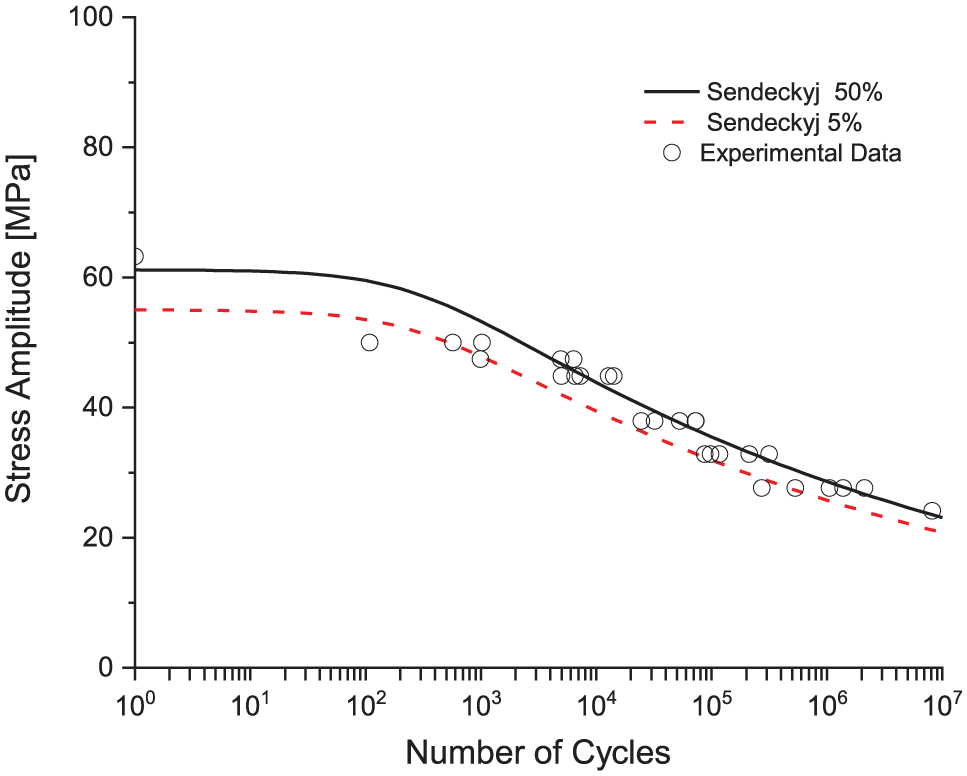
S-N reliability curve based on Sendeckyj’s wear-out model for the experimental data of laminate DD16 collected from Mandell and Samborsky, 67 R = 0.8.
Fatigue curve constants based on Sendeckyj model.

In Figures 8 and 9, the S-N percentile curves of 5% and 50% obtained based on Sendeckyj’s wear-out model and ASTM E739 standard for the experimental fatigue data of the metallic material from the Luíz I Bridge (R = –1) and for the experimental data of laminate DD16 collected from Mandell and Samborsky 67 (R = 0.8) are presented, respectively. For the metallic material from the Luíz I Bridge (Figure 8), Sendeckyj model when compared with the ASTM E739-91 standard presents a good agreement between experimental results and percentile curves until a number of cycle to failure of 105. On the contrary, for the number of cycles to failure above 105, high-cycle fatigue region, the ASTM standard exhibits better results. Figure 9 shows that the Sendeckyj model produces a better fit to the experimental data in the region below 103, due to C parameter of equation (18). The ASTM E739-91 model does not fit well to the low-cycle region, compromising the analysis in this region. When deciding which of the two curves to use to analyze reliability regions for composite materials from the low-cycle region, researchers will achieve a more reliable analysis by applying the Sendeckyj method.

S-N reliability curves based on Sendeckyj’s wear-out model and ASTM E739 standard for the experimental fatigue data of the metallic material from the Luíz I Bridge, R = –1.

S-N reliability curves based on Sendeckyj’s wear-out model and ASTM E739 standard for the laminate DD16, R = 0.8.
Although the Sendeckyj model is currently used in composite materials, it can also be applied to metallic materials, since its three premises can be used with any material. This is due to its ability to model fatigue behavior in low- and high-cycle regions and inclusion of the Weibull failure distribution model, which may be an interesting proposal for designers. However, it also has three drawbacks: the static strength of the material must be known in order to build the curves, the dataset cannot be small, and an interactive optimization model must be used to obtain its constants. In other words, if the dataset is not large enough and the static strength of the material is unknown, the model presented in “Fatigue models” section is more suitable.
Overview of probabilistic models by Castillo and Fernández-Canteli
Castillo and Fernández-Canteli proposed a set of probabilistic models for fatigue damage modeling, based on the Weibull distribution and its limiting Gumbel distribution for β → ∞. These models are supported by both physical and statistical assumptions, leading to basic P-S-N and ε-N fields; through a reduced set of dimensionless variables, a dimensional analysis is performed and a set of compatibility conditions and constraints are proposed for the model to be implemented. 68 These fields can be applied to describe the fatigue behavior of both smooth and sharp notched specimens, corresponding to mechanical details and structural components, including run-outs. This model can be implemented through the ProFatigue Software in Fernández-Canteli et al. 69
P-S-N field for a fixed stress level
Castillo and Fernández-Canteli 48 derived a Weibull regression model for variable stress range and fixed stress level (e.g. stress R-ratio, mean stress). This model, being formulated in the stress space, is recommended for medium to high or even very high cycle fatigue. The derivation of the model is based on satisfaction of physical conditions (identification of involved variables, dimensionless analysis) and statistical requirements (weakest link principle, stability, limited range, limit behavior). In addition, fulfilling the necessary compatibility condition between lifetime distribution for a given stress range and stress range distribution for a given lifetime leads to a functional equation, the solution of which provides the following distribution, defining the P-S-N field 48

where N is the lifetime; Δσ is the stress level; F() is the cumulative probability distribution function (CFD) of N for given Δσ; B = log(N0), N0 being a threshold value of lifetime; C = log(Δσ0), Δσ0 being the endurance fatigue limit; and λ, β, and δ are nondimensional model parameters (β: Weibull shape parameter; δ: Weibull scale parameter; λ: Weibull location parameter defining the position of the zero-percentile curve). The model defined by equation (21) has been studied and successfully applied to different lifetime assessments.35,48,70,71 Equation (21) may be rewritten for normalized number of cycles (N*) and normalized stress range (Δσ*)

where

Probabilistic S-N field according to the Weibull model proposed by Castillo and Fernández-Canteli.
Both asymptotes of the S-N field limit its domain of applicability to specific subdomains of the field. The vertical asymptote is more controversial given that the plastic effects that appear in the region of low-cycle fatigue make the real percentile curves to inflect downward at this region. The horizontal asymptote is not controversial even for those materials that do not exhibit a clear fatigue limit as is the case of some aluminum alloys, since the model encompasses the case C = 0.
An alternative for the equations (21) and (22) was also proposed by the authors, using the Gumbel distribution as a limiting case of the Weibull distribution when β → ∞, or even for β > 8

or for non-dimensional variables

with the same meaning of the symbols as before. Concerning the parameter identification, the process includes two steps: (a) estimation of the threshold parameters B and C using the constrained least squares method and (b) estimation of the Weibull parameters λ, β, and δ by the maximum likelihood method, 48 once the threshold parameters are known.
In order to illustrate the procedure, let (Δσi, Nii)|i = 1,2,…, n be a set of pairs, where Δσi is the deterministic stress range of the specimen i and Ni is the resulting experimental random lifetime. The procedure to estimate the threshold parameters is based on a constrained least squares method, from which result the following equation and constraints


where wi are the weights. The constraints listed by equation (26) are included to guarantee that the values B and C are valid threshold values for all data points. If the sample contains run-outs, that is, right censored data points, associated with a certain given limit number of cycles, their lifetimes are not known; thus, an iterative process may be used to assign them to the expected final number of cycles. 48
Once B and C have been estimated, the Weibull constants may be evaluated using a constrained maximum likelihood method. All the data points can be pooled together, in sets of equal lengths, by calculating

The log-likelihood for broken specimens, that is, run-outs that without loss of generality can be assumed to be the first n1 < n specimens, becomes
and for the run-outs
Finally, an optimization problem is solved

subjected to

where α can be taken as 0.01. The constraint defined by equation (31) is imposed to avoid data below the threshold value of lifetime, that is

The solution of the maximization problem leads to an unbounded likelihood value. It states that the minimum value must be greater than its corresponding α 100 percentile value, that is

More details about the parameters identification procedure can be found in Castillo and Fernández-Canteli. 48
This model was initially proposed to generate P-S-N and ε-N fields.72,73 Correia et al. 22 and De Jesus et al., 74 taking into account the robustness of this probabilistic fatigue model, proposed a generalization of this model for several fatigue damage parameters applied to experimental fatigue results of metallic materials and steel connections.
This probabilistic fatigue model has been used to evaluate the non-linear (and/or bilinear) cumulative fatigue damage of the P355NL1 pressure vessel steel. 75 Correia et al. 76 and Blasón et al. 77 evaluated the cumulative fatigue damage of riveted metallic connections with puddle iron from Fão bridge for different percentile curves with the purpose of interpreting the Miner number for fatigue life prediction. The same path was made by Fernández-Canteli, 78 where this author used the probabilistic fatigue model to evaluate the cumulative fatigue damage of the concrete.
In Figures 11 and 12, the S-N percentile curves of 5% and 50% obtained based on probabilistic fatigue model proposed by Castillo and Fernández-Canteli for the experimental fatigue data of the metallic material from the Luíz I Bridge (R = –1) and for the experimental data of laminate DD16 collected from Mandell and Samborsky 67 (R = 0.8) are presented, respectively. Based on the figures, it is observed that the model exhibits good results for medium- and high-cycle fatigue regions. However, for ultra-low-cycle and low-cycle fatigue regions, it does not present satisfactory results due to the limitation of the model, since it has a vertical asymptote. In Table 3, the obtained parameters using probabilistic fatigue model proposed by Castillo and Fernández-Canteli for both materials are presented.

S-N reliability curve based on Castillo and Fernández-Canteli model for the experimental fatigue data of the metallic material from the Luíz I Bridge, R = –1.

S-N reliability curve based on Castillo and Fernández-Canteli model for the experimental data of laminate DD16 collected from Mandell, 67 R = 0.8.
Fatigue curve constants based on Castillo and Fernández-Canteli model.

Generalized probabilistic model allowing for various fatigue damage variables
The fatigue damage model proposed by Castillo and Fernández-Canteli and presented in “P-S-N field for a fixed stress level” section is limited to simple fatigue damage parameters such as the stress or strain. De Jesus et al. 74 suggested the first generalization of the probabilistic fatigue model proposed by Castillo and Fernández-Canteli. These authors applied this probabilistic fatigue model to derive the probabilistic stress–life curves for a single-shear riveted connection based on a probabilistic ε-N field obtained using the experimental strain–life data and based on the Neuber or Glinka rules. Correia et al. 22 decided to generalize this probabilistic fatigue model to other fatigue damage parameters, such as SWT, Walker-like strain, and energy for uniaxial and multiaxial loading conditions. This proposal proved to be feasible for fatigue damage parameters under uniaxial and multiaxial loading conditions for different metallic materials.
The onset of a macro-crack is considered a failure criterion by fatigue and can be represented by a deterministic parameter

The parameter ψ represents the fatigue damage and q is a decreasing function of the total life in terms of number of reversals to failure,

The variable ψ0 is the limit of fatigue resistance, and k and α are material constants. Through this generic damage formulation, it will be possible to propose a generalization of the probabilistic fatigue model proposed by Castillo and Fernández-Canteli for several fatigue damage parameters.
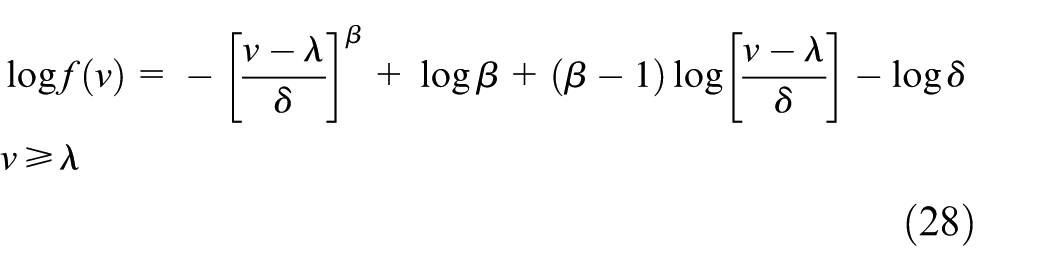
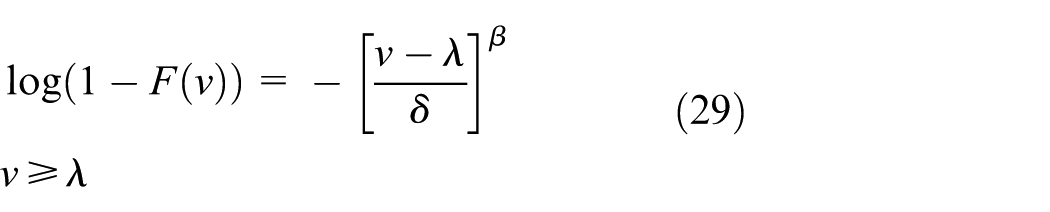
Considering the same physical and statistical assumptions of probabilistic fatigue model proposed by Castillo and Fernández-Canteli, 48 the modeling of the random variable of equation (27) can be generalized to other damage parameters

This random variable v follows a three-parameter Weibull distribution
The generalized probabilistic field is then written as
where p is the probability of failure; N0 (
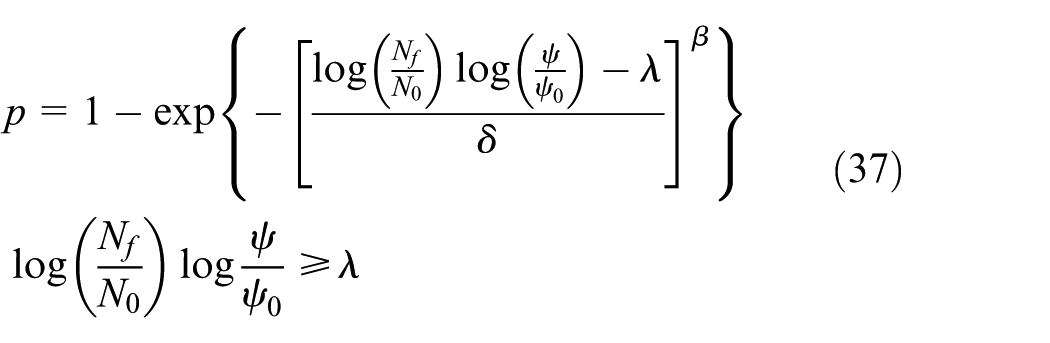
The generalized probabilistic fatigue damage model can be specified using the SWT deterministic variable in equation (37) as proposed by Correia et al. 22

where
Other deterministic variable as the Walker-like strain damage parameter for uniaxial loading conditions can be used in equation (37)

where
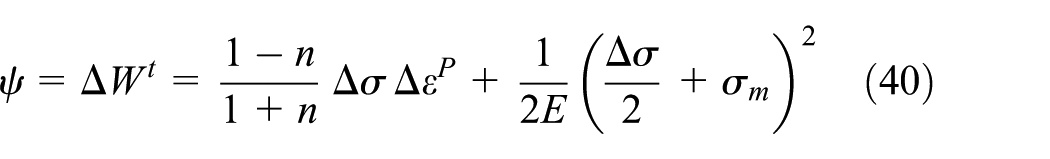
In this way, Correia et al. 22 proposed the use of energy criterion under uniaxial loading conditions suggested by Golos and Ellyin79,80 as a generic damage variable of the generalized probabilistic fatigue model (equation (37)), and some applications were presented. The energy-based fatigue damage parameter used in their studies was the following (equation (40))
Correia et al.
22
also demonstrated the damage parameter generalization for multiaxial proportional and non-proportional loading conditions based on an energy-based damage parameter. The multiaxial damage parameter used in his research work is recommended for non-proportional loading based on multiaxial constraint ratio (
The multiaxial fatigue damage can also be represented by the critical plane parameters based on shear strain. Jiang et al. 81 defined this fatigue damager parameter for a material as the critical plane, and it is suitable as an energy failure criterion under multiaxial loading. The multiaxial fatigue damage parameter based on the critical plane can be presented as a damage variable, ψ, and is given by

where
An example of application of the generalization of the probabilistic fatigue model considering the damage gradient as a multiaxial parameter for both proportional and non-proportional loading was presented by Muniz Cavalcante et al. 82
Probabilistic full-range fatigue prediction and Stüssi models based on the Weibull model proposed by Castillo et al
The Stüssi nonlinear function was proposed to represent S-N curves, based on the geometric principle of material behavior during its useful life. To that end, this model must estimate fatigue threshold and ultimate tensile strength parameters for the equation to be able to model S-N curve fitting in the low- and high-cycle fatigue regions. However, this model is based only on the average behavior of the number of failure cycles in the material, and does not consider the randomness of failure. The nonlinear equation of the S-N curve for the material proposed by Stüssi is given by

where
In order to estimate the two geometric parameters (a and b) of equation (43), it is essential to know the two parameters of the material (Rm and Δσ∞). The first is obtained from the average ultimate tensile strength results and the second is the fatigue threshold, which can be obtained by solving equation (30) using nonlinear optimization. After these values are obtained, the logarithm is applied in equation (26) to linearize it, followed by simple linear regression to estimate the values of a and b. Once the parameters of equation (26) are known, the S-N curve can be obtained from the Stüssi function in its log-log scale, depicted in Figure 13. The study by Toasa Caiza and Ummenhofer 83 provides a more detailed explanation on the estimation of these geometric parameters.

S-N curve based on the Stüssi log-linear scale by Caiza and Ummenhofer. 83
Given the limitation of the model, Toasa Caiza and Ummenhofer 83 proposed to include the Stüssi function in three-parameter Weibull distribution in order to model a probabilistic method to describe S-N reliability curves. The three-parameter estimation model of the Weibull distribution, W(α, β, δ), is based on the Castillo and Fernández-Canteli 48 model mentioned in “P-S-N field for a fixed stress level” section, which emphasizes the stochastic nature of fatigue, involving stress interval Δσ and time to failure, given by the number of cycles as random variables. 84
The probabilistic model of Stüssi’s equation is a combination of the three-parameter Weibull distribution and Stüssi function. To that end, the accumulated distribution function is used, given by

and equation (43) transformed into a random variable to be inserted into equation (44). The random Stüssi variable is given by

To obtain the probabilistic model, the random variable

where P is the failure probability, α∈
This model was developed based on the assumption that Stüssi’s random variable follows a three-parameter Weibull distribution composed of geometric and material parameters. The Castillo and Hadi 85 or probability-weighted moments (PWM) 86 methods can be applied to estimate the Weibull distribution parameters. Once these values are known, failure probability curves can be drawn for the material in question (Figure 14).

S-N curves based on the Stüssi model combined with a Weibull distribution. The plotted curves correspond to a failure probability of 5%, 50%, and 95%, according to Caiza and Ummenhofer. 83
The Stüssi method can model plastic fatigue behavior in the low-cycle fatigue region. From a geometric standpoint, Figure 14 shows that this is a well-fitting model for explaining fatigue behavior in the low-cycle regions of metals.
In Figures 15 and 16, the S-N percentile curves of 5% and 50% obtained based on Stüssi model combined with a Weibull distribution proposed by Caiza and Ummenhofer 83 for the experimental fatigue data of the metallic material from the Luíz I Bridge (R = –1) and for the experimental data of laminate DD16 collected from Mandell and Samborsky 67 (R = 0.8) are presented, respectively. The probabilistic fatigue analysis proposed by Caiza and Ummenhofer 83 based on Stüssi model combined with a Weibull distribution gives good results in all fatigue regions, from ultra-low-cycle to high-cycle, for both materials under consideration. In Table 4, the obtained parameters using the Stüssi model combined with a Weibull distribution proposed by Caiza and Ummenhofer 83 for both materials are presented.

S-N reliability curve based on Stüssi model combined with a Weibull distribution for the experimental fatigue data of the metallic material from the Luíz I Bridge, R = –1.

S-N reliability curve based on Stüssi model combined with a Weibull distribution for the experimental data of laminate DD16 collected from Mandell and Samborsky, 67 R = 0.8.
Fatigue curve constants based on Stussi model.

Results discussion: applicability of different probabilistic fatigue models
A single P-S-N mathematical model is generally applied for the fatigue life prediction of metallic or composite materials. However, researchers and engineers should consider the differences between the two types of materials in order to determine the modeling process that best represents the stochastic fatigue life behavior. Damage in composite laminates, with small cracks in the polymer matrix, occurs randomly and cumulatively on the surface and internally, increasing dispersion until final failure. However, the fatigue crack propagation in metals is identifiable on the fracture surface, with less dispersion in the number of cycles to failure. Aspects such as sample size, dispersion of the number of cycles to failure for different stress range levels, stress range or maximum stress, and the random variable(s) selected for a given probabilistic fatigue model under consideration influence the statistical distribution.87–90
The P-S-N curves discussed in this review are based on the two- and three-parameter Weibull and log-normal distributions. The ASTM E739 standard, Sendeckyj, Castillo and Fernández-Canteli, and Stüssi models are based on different probabilistic modeling processes that allow to be used in different applications according to the specificities of the material under consideration.
For metallic materials (Figure 8), the Sendeckyj model revealed to be more efficient when the fatigue percentile curves are compared with the experimental data, for the ultra-low-cycle until medium-cycle fatigue regions (
The probabilistic fatigue model based on Weibull statistical distribution for a range of variables and fixed stresses proposed by Castillo and Fernández-Canteli is recommended for the fatigue life prediction in finite life and high-cycle fatigue regions. This model is based on physical assumptions (identifying the involved variables and dimensionless analysis) and statistical requirements (weakest link principle, stability, limited reach, threshold behavior). According to Figures 11 and 12, the percentile curves are adjusted reasonably in fatigue regions with number of cycles to failure above of
The Stüssi model based on three-parameter Weibull statistical distribution was proposed by Caiza and Ummenhofer. These authors used the same regression method proposed by Castillo and Fernández-Canteli, proposing the extension of the fatigue life prediction for the low-cycle fatigue region but based on Stüssi relation. In their studies, Caiza and Ummenhofer used experimental fatigue data from the specimens made of steel S355J2+N and showed that the probabilistic Stüssi model was able to estimate failure probabilities in the low-cycle fatigue region (see Figure 17). The probabilistic Stüssi model presented a good adjustment in all fatigue regions (since ultra-low fatigue to high-cycle fatigue) when compared with the probabilistic fatigue model proposed by Castillo and Fernández-Canteli (see Figure 17).

The Castillo and Fernández-Canteli model as well as probabilistic Stüssi model proposed by Caiza and Ummenhofer are more suitable for the metallic materials, since these kinds of materials require the fatigue strength threshold of the material to generate reliability curves, while composite materials do not exhibit a quantifiable fatigue strength threshold.
However, in Figures 15 and 16, a good adjustment between the percentile curves (5% and 50%) and the range of experimental data for the metallic and composite materials is observed, respectively. In this sense, this probabilistic Stüssi model proves to be effective for the metallic and composite materials.
In Figures 18 and 19, the S-N percentile curves of 50% and 5% obtained for all models under consideration for the experimental fatigue data of the metallic material from the Luíz I Bridge, R = –1, are presented, respectively. All models present good adjustment results with experimental data for fatigue regions with number of cycles to failure above

S-N reliability curves to probability of failure of 50% for all methods under consideration for the experimental fatigue data of the metallic material from the Luíz I Bridge, R = –1.

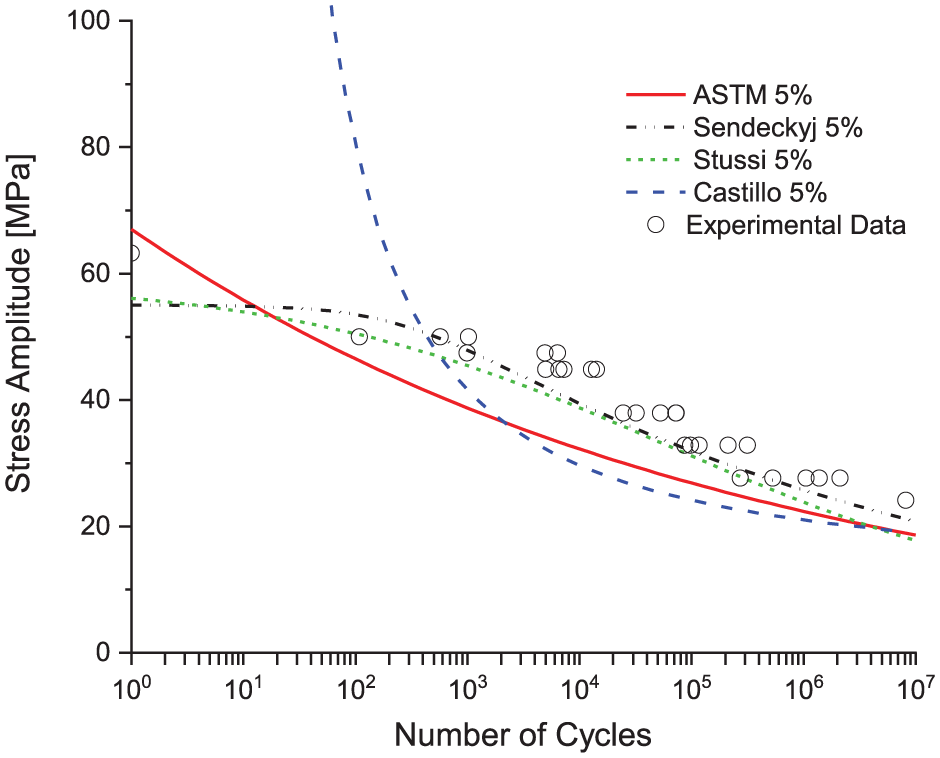
S-N reliability curves to probability of failure of 5% for all methods under consideration for the experimental fatigue data of the metallic material from the Luíz I Bridge, R = –1.
In Figures 20 and 21, the S-N percentile curves of 50% and 5% obtained for all methods under consideration for the experimental data of laminate DD16 collected from Mandell and Samborsky,
67
R = 0.8, are presented, respectively. All models present good adjustment results with experimental data for fatigue regions with number of cycles to failure above

S-N reliability curves to probability of failure of 50% for all methods under consideration for the experimental data of laminate DD16 collected from Mandell and Samborsky, 67 R = 0.8.
S-N reliability curves to probability of failure of 5% for all methods under consideration for the experimental data of laminate DD16 collected from Mandell and Samborsky, 67 R = 0.8.
In order to evaluate the performance of the P-S-N curves according to the ASTM E739 standard,
19
the probabilistic Stüssi model proposed by Toasa Caiza and Ummenhofer,
83
the Sendeckyj
33
model, and three-probabilistic fatigue model proposed by Castillo and Fernández-Canteli,
48
the quality of fitting provided by the mean S-N curves was quantified comparing it with the available experimental data. In this way, the root mean squared error (RMSE) between
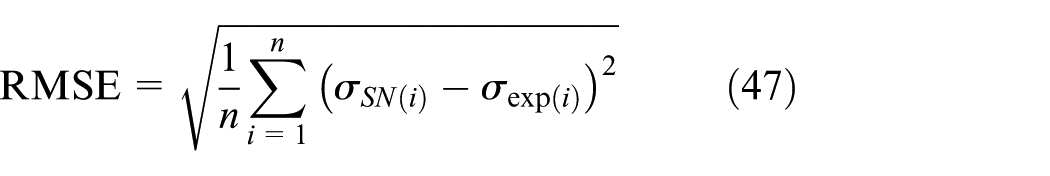
where
The performance of the mean S-N curves (50% percentile curves) evaluated for the several models under consideration when compared with experimental fatigue data was determined using the RMSE estimator separately for low-cycle and high-cycle fatigue regions as well as for the full-range fatigue regimes.
Figures 22 and 23 present the values of the normalized RMSE for the metallic material from the Luíz I old riveted bridge and the DD16 composite material, considering separately low-cycle and high-cycle fatigue regions (

Normalized RMSE for different fatigue regions.

Normalized RMSE for all fatigue regimes.
Normalized RMSE values for different fatigue regimes.
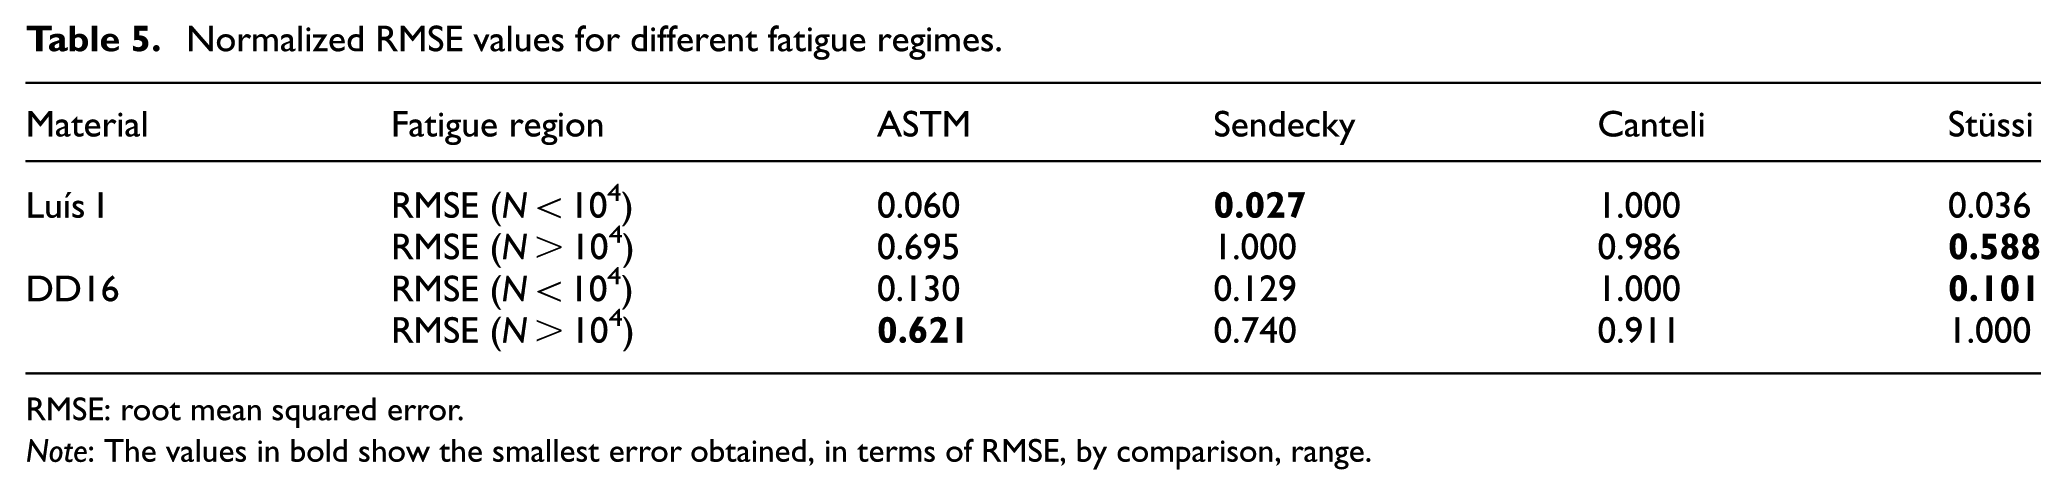
RMSE: root mean squared error.
Note: The values in bold show the smallest error obtained, in terms of RMSE, by comparison, range.
Normalized RMSE for all fatigue regions.

RMSE: root mean squared error.
Note: The bold values for RMSE represent the smallest error obtained, and the bold values for R show the largest value that corresponds to the best fit.
Conclusion
In this research work, a state of the art on probabilistic fatigue models based on statistical distributions applied to metallic and composite materials was made. In this study, the differences between probabilistic fatigue models such as ASTM E739 standard, Sendeckyj, Castillo and Fernández-Canteli, and Stüssi applied to the metallic and composite materials are presented.
For the metallic material, all models exhibit good adjustment when compared with the experimental data from low-cycle to high-cycle fatigue regimes, excluding the Sendeckyj model, which did not present a good fit for the high-cycle fatigue region. For all fatigue regions, only the probabilistic Stüssi model presented very good adjustment results when compared with experimental data. However, for metallic materials, in most practical cases (design situations), the most relevant fatigue regions are those of medium-cycle and high-cycle with a defined fatigue limit described by Basquin law. In this way, the probabilistic fatigue models such as the Castillo and Fernández-Canteli, ASTM standard, and Stüssi seem to be the most suitable.
For the composite material, the probabilistic Stüssi and Sendeckyj models reveal to be effective for all fatigue regions. The remaining models have only good adjustments to particular fatigue regimes such as medium-cycle and high-cycle fatigue.
The probabilistic Stüssi and Sendeckyj models were the most suitable for composite materials, while, for metallic materials, only the probabilistic Stüssi model presented good adjustment results, for all fatigue regions (from ultra-low-cycle to high-cycle).
Footnotes
Appendix 1
Handling Editor: James Baldwin
Declaration of conflicting interests
The author(s) declared no potential conflicts of interest with respect to the research, authorship, and/or publication of this article.
Funding
The author(s) disclosed receipt of the following financial support for the research, authorship, and/or publication of this article: This study was financed in part by the Coordenação de Aperfeiçoamento de Pessoal de Nível Superior—Brasil (CAPES)—Finance Code 001. In addition, this work was also financially supported by national funds through FCT—Fundação para a Ciência e a Tecnologia; UID/ECI/04708/2019—CONSTRUCT—Instituto de I&D em Estruturas e Construções funded by national funds through the FCT/MCTES (PIDDAC); post-doctoral grant SFRH/BPD/107825/2015 provided by FCT to the second author; and grant number POCI-01-0145-FEDER-030103 FiberBridge—fatigue strengthening and assessment of railway metallic bridges using fiber-reinforced polymers by FEDER funds through COMPETE2020 (POCI) and by national funds (PIDDAC) through the Portuguese Science Foundation (FCT/MCTES). Also, financial supports of the National Natural Science Foundation of China (No. 11672070), Sichuan Provincial Key Research and Development Program (No. 2019YFG0348), and Science and Technology Program of Guangzhou, China (No. 201904010463) are acknowledged.