
Abstract
Due to transmission backlash of precise cable drive in electro-optical targeting system, it is difficult to predict force and pointing precisely during target detection. This article aims to develop a rigorous model for predicting the cable tension and transmission backlash of precise cable drive in electro-optical targeting system to better evaluate the performance in the preliminary design stages. The model of transmission backlash in different phase is established by satisfying the system’s geometric and equilibrium constraints, which is applicable to cable drive systems with any external load, pretension, and motion trajectories. Simulations are conducted to reveal the changes of cable deformation, cable tension, and deflection angles. The model is validated by experiments using a suitable experimental setup, predicting transmission backlash with the error level of 8.27%. The sensitivities of the preload force and external load are tested, and corresponding results are in good agreement with the theoretical ones. The backlash plunges dramatically when the preload force is small and flattens out when the preload force is larger than the threshold value. A proper preload force should be applied to keep the backlash in stable state. The threshold value could be predicted by the proposed model. The method presented in this article could provide a theoretic guide for system design and nonlinearity compensation.
Keywords
Introduction
Electro-optical targeting system (EOTS) on unmanned aircraft systems (UASs) is primarily used for general situational awareness and high-contrast target detection and tracking.1,2 Wide looking angles, high pointing precision, and short settling time are desired for the EOTS to probe the potential targets, establish the line of sight connectively and compensate for undesired motion. Furthermore, as the weight and space is premium on such vehicles, it is desirable that the mechanisms could be as compact and lightweight as possible. 3 Precise cable drive4–7 is an elegantly transmission mode. Owing to its many advantages, such as high efficiency, flexible layout, and lightweight, it has been widely used in the EOTS.8–10 However, transmission backlash not only deteriorates the control accuracy, reducing the bandwidth, causing limit cycle oscillation and leading to steady-state vibration11–13 but also is a major factor giving rise to nonlinear dynamic response, such as, frequency jump, chaos, and bifurcation. 14 It restricts the improvement of the performance of the precise cable drive servo system. Hence, it is significant to model the backlash characteristics in precise cable drive to provide a theoretic guide for system design and nonlinearity compensation.
Precise cable drive is indeed one of the friction drives just as the belt drive. The creep theory 15 is also applicable to cables that are extensible. This theory assumes that friction is developed due to the relative slip motion between the string and pulley, and a Coulomb law describes the string-pulley friction. Later on, the researchers16–19 updated the classic creep theory to incorporate the effect of the inertia, bending rigidity, nonlinear friction, and extensibility. Based on the creep theory, analytical models on transmission capability, stiffness, and slip error were derived by Lu et al., 4 Werkmeister and Slocum, 20 and Baser and Konukseven, 21 respectively. Moreover, many researchers concentrated on the dynamic changes of friction coefficient between the cable and pulley. The effects of cable tension, groove shapes, lubricants, and surface roughness were discussed by Albro and Liu, 22 Peng et al., 23 and Tu and Fort, 24 respectively. However, most research literatures focused on the attributes of traction drives as power transmission elements rather than their operation performance, such as backlash properties, in precision measurement applications.
There are only a handful of studies concentrated on transmission backlash. Xie et al. 25 experimentally investigated the influence of the main design parameters on the backlash characteristics. The test results showed that the transmission backlash would change with several design factors, such as preload force, external load, and cable number. However, no theoretical model was established. Rajh et al. 26 presented a theoretical model focusing on the cable drive hysteretic backlash by means of piecewise function. But the model cannot depict the exact physical processes, which would limit the acceptance of these models. Snow 27 modeled the load–deflection behavior during loading and unloading by satisfying the system’s geometric, constitutive, and equilibrium constraints. The cable extension due to the external torque in different region was derived. Based on the model, the behaviors of softening spring behavior and hysteresis deflection were characterized. However, the models only focused on the elongation of cable resulting from external load, while the backlash characteristics were not addressed. Lu and Fan 28 developed an analytical model of the transmission backlash, in which the cable is lumped as several nonlinear spring. The slip angle and deformation of cable in different region were studied. Parametric analyses were conducted to investigate the sensitivities of the main design parameters on backlash characteristics. Based on Lu and Fan’s research, Xue et al. 29 extended the model by incorporating the cable’s bending stiffness. However, the above models only addressed the moment when the load initially applies to the preloaded cable, while ignored the process when the direction of motion is switched. Changes in cable tension, along with system states cannot be captured by the proposed models in the literatures. Moreover, the influences of the design parameters were only analyzed theoretically, without certification by the experimental findings. According to the studies stated above, it is still difficult to provide optimization design method to keep the backlash in stable state, as the generating mechanisms of transmission backlash are not fully clarified yet.
The contribution of this article is mainly to develop a rigorous model for predicting the cable tension and transmission backlash of precise cable drive in EOTS. Instead of addressing the moment when the external load initially applies to the preloaded cable in previous studies, this article models the transmission backlash in different phase by satisfying the system’s geometric and equilibrium constraints, which is applicable to cable drive systems with any external load, pretension, and motion trajectories. In addition, simulations are conducted to reveal the changes of cable deformation, cable tension, and deflection angles. The experimental setup is built, and experimental results are presented and compared with the simulation results. At last, the effects of preload force and external load on transmission backlash are tested. And a proper pretension force could be obtained in the design phase to keep the backlash in stable state. The theoretical models are verified by experiments. Ultimately, the developed models can be used to provide a theoretic guide for system design and nonlinearity compensation.
Theoretical modeling of transmission backlash
An EOTS has been developed to support high-performance camera for acquisition, tracking, and pointing functions. The shape diagram and mechanical structure of the EOTS is shown in Figure 1. The 2 degrees of freedom is driven by separate precise cable drive. A basic component of precise cable drive is shown in Figure 1(c). The motion transmits from input pulley to output drum by preloaded steel cable in a figure eight pattern. The cable is wound around the input pulley with several circles to increase the wrap angle. And the output drum is usually grooved to keep the cable in the preset route. Turnbuckles at the point where the cable terminates on the pulley surface are used as the preload mechanism. In the transmission process, the backlash exists due to the elasticity of the cables and the load acting on it. The main work in this section is to develop the model to analyze tension and transmission backlash of the basic component of precise cable drive.

Mechanical structure of the developed electro-optical targeting system: (a) shape diagram, (b) mechanical structure, and (c) basic component of precise cable drive.
System-governing equations
Transmission backlash is originated from the change in elastic elongation of the cable, which in turn results from the abrupt change in applied load. Determining the cable tension requires the knowledge of the equilibrium tension profile in the contact region, which could be derived by the classical creep theory. To model the motion and tension of the cable, we assume that the cable inertia effects can be neglected, and constitutive behavior of the cable is defined by the standard Hooke’s law.
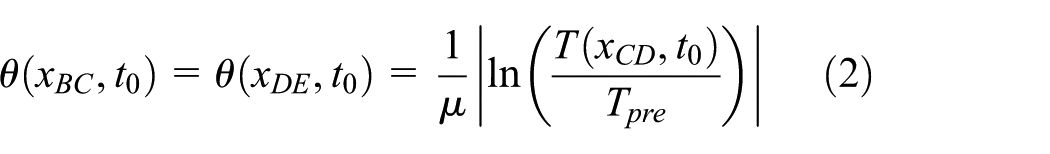
Figure 2 shows the tension and affected angles of wrap in such a configuration. At t = t0, an external load Ml(t0) starts to apply to the output drum, the cable tension of the free length CD and GH change to T(xCD,t0) and T(xGH,t0) from a uniform preload force, Tpre, respectively. The affected slip angles can be divided into three parts on input pulley (radius, ri) θ(xDE,t0), θ(xEF,t0), θ(xFG,t0), and four parts on output drum (radius, ro) θ(xBC,t0), θ(xHI,t0), θ(xBI,t0), θ(xIJ,t0), respectively. Assuming that the output drum rotates in the counterclockwise direction initially. Thus the free-length CD and GH become tight side and slack side, respectively. Based on the torque equilibrium equation, the cable tension of the free length can be obtained as


Tension and affected angles of wrap.
According to Euler’s equation, the affected slip angles between the cable and pulleys could be derived with friction coefficient, μ

In the region of θ(xAB,t0), θ(xEF,t0), and θ(xIJ,t0), the cable tension remains its original value Tpre, without any elongation. From Hooke’s law, the cable strain, ε(x,t), resulting from cable tension T(x,t) is defined as

where G denotes the tensile modulus of the cable. The cable strain ε(x,t) can also be obtained from the cable deformation, dδ(x,t), in the small segment, rodθ

Based on equations (4) and (5), the cable deformation can be calculated when the tension T(x,t) acts on the small segment, rodθ

Backlash modeling during initial loading
During initial loading, affected angles and tension profile on output drum are shown in Figure 3. When the cable tension of the free length changes from Tpre to T(xCD,t1) or T(xGH,t1), the tension profile T(xBC,t1) in the affected region BC can be obtained as


Tension profile during initial loading.
Thus, the cable elongation of the affected region BC, δ(xBC,t1), on output drum during initial loading can be deduced as

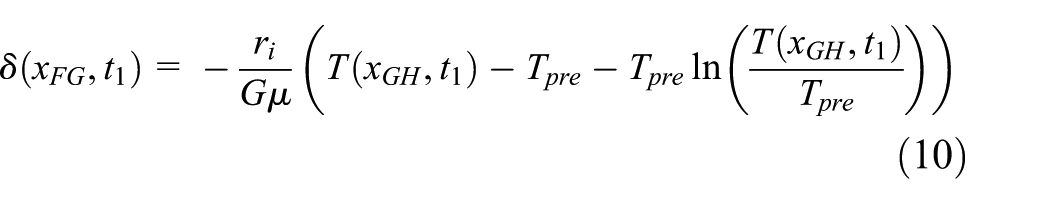
Likewise, the cable elongation of other affected angles of wrap, δ(xDE,t1), δ(xFG,t1), δ(xHI,t1), and of the free length, δ(xCD,t1), δ(xGH,t1) are


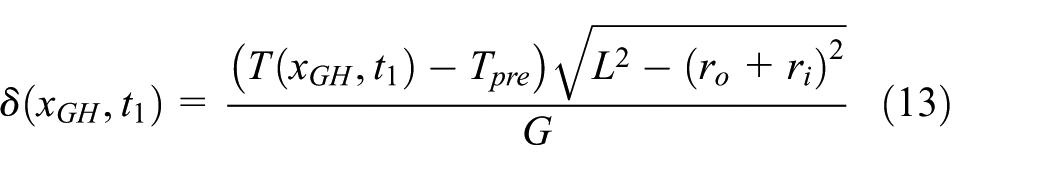
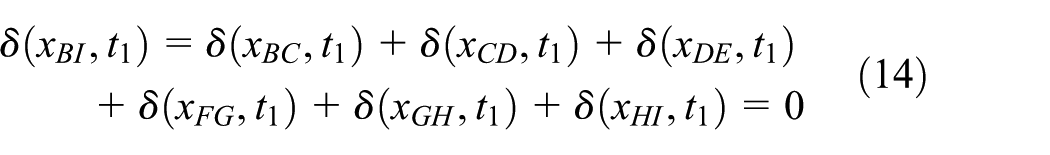
where L is the center distance between the pulleys. Assuming that the overall length of the cable remains unchanged, the geometric constraint is therefore
Substituting the torque equilibrium equation (1) and the constitutive relation equations (8)–(13) into the geometric constraint equation (14) to get the cable tension on free length, T(xCD,t1)

The pulleys usually are close together to increase wrap angle and decrease the axial force of the pulleys in the proposed prototype. The free length distance would be very small in this configuration. And the friction coefficient, μ, generally range from 0.15 to 0.2. We could assume that

Then, equation (15) could be simplified as

Solving for T(xCD,t1) we find
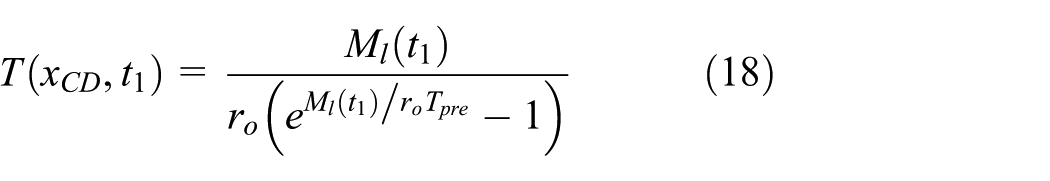
The transmission backlash, Δγ(t1), is equal to the cable deflection on one side, δ(xBE,t1) or δ(xFI,t1), divided by the output drum radius, ro
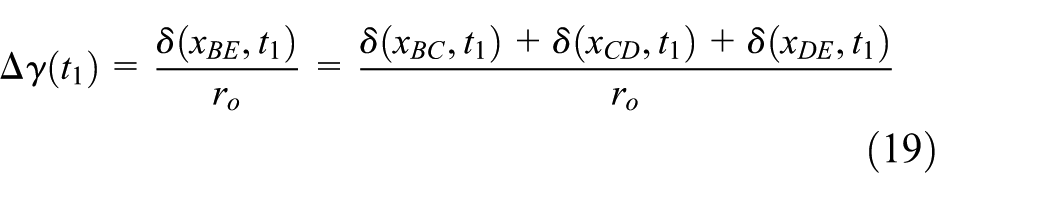
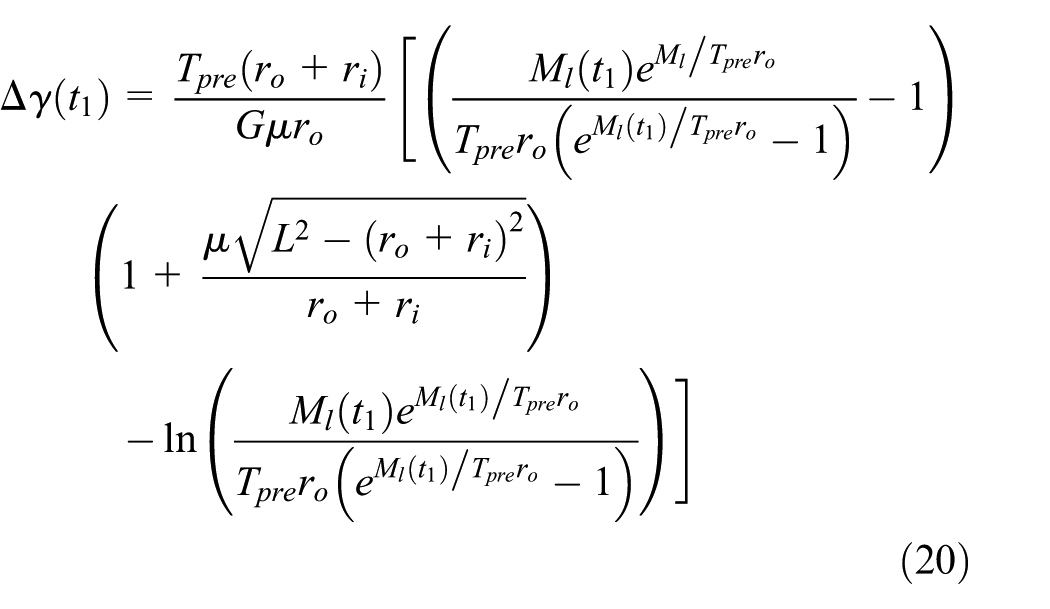
Substituting equations (8), (9), and (12) into equation (19), we can obtain the backlash angle, Δγ(t1), of the precise cable drive during initial loading
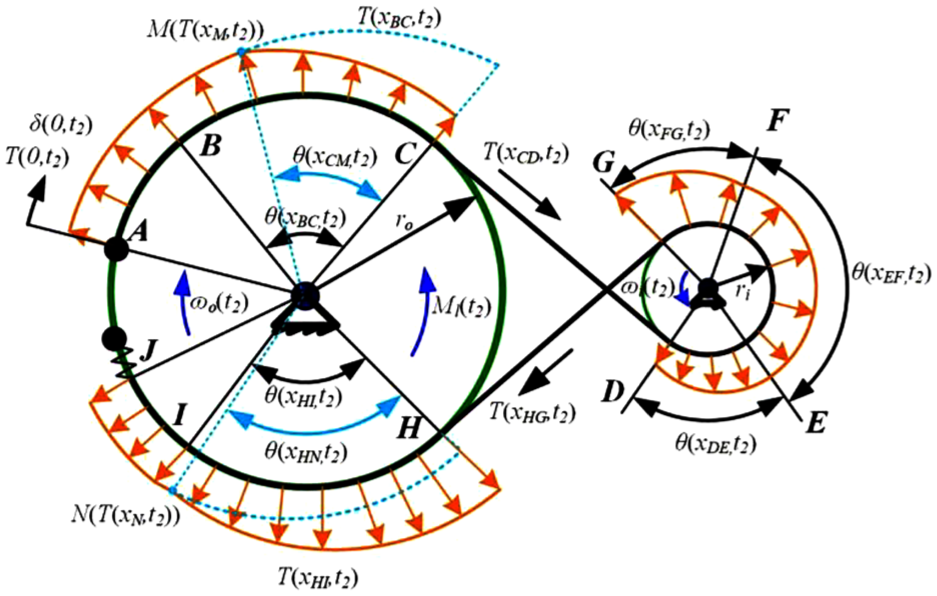
Backlash modeling during reverse rotation
The affected angles and tension profile on output drum during reverse rotation are shown in Figure 4. The load on the output drum would vary from Ml(t1) to Ml(t2) when the direction of motion is changed. The cable tension, T(xCD,t1), would change to T(xCD,t2). In turn, the cable tension on the approaching slip region would also decrease. We define as the region of cable whose tension varies in this process as a new affected angle of wrap, θ(xCM,t2)

where T(xM,t2) denotes the cable tension on the tension bump, as shown in Figure 5. It could be calculated on both sides

Tension profile during reverse rotation.

Simulation results for cable tension: (a) the time histories of external load, (b) cable tension of the overall length, (c) cable tension on the slip region θ(xBC,t), (d) cable tension on the slip region θ(xDE,t), (e) cable tension on the slip region θ(xFG,t), and (f) cable tension on the slip region θ(xHI,t).
As the affected angle θ(xBC,t2) is determined by the peak value during initial loading, T pk (xCD,t1). By substituting equation (2) into equation (22) to eliminate θ(xBC,t2), we can obtain the new affected angle θ(xCM,t2)

Thus the cable tension T(xBC,t2) on the slip region of θ(xBC,t2) is
The variation of the cable elongation on the slip region of θ(xBC,t2) during reverse rotation, Δδ(xAB,t2–t1), can be obtained by substituting equations (2) and (8) into equation (24)

Likewise, the variation of the cable elongation on the other slip region during reverse rotation, Δδ(xDE,t2–t1), Δδ(xFG,t2–t1) and Δδ(xHI,t2–t1), can be obtained as


According to the geometric constraints, the gross deflection equation during reverse rotation could be obtained
Substituting equations (1), (22), and (24) into (29) to get the cable tension of free length after changing the direction of rotation

Thus, the backlash angle, Δγ(t2), during reverse rotation can be calculated according to equations (19) and (30)

According to equations (20) and (32), we can conclude that the transmission backlash is not only affected by the applied load Ml(t) in the operation, and also depends on the cable’s load history so that the precise cable drive becomes a sort of mechanical memory device. Furthermore, it is obvious that the transmission backlash is determined by the design parameters, including radius of the pulleys ri, ro, tensile modulus G, friction coefficient μ, center distance L, and preload force Tpre.
Simulation results
Simulations are carried out for the basic component of the precise cable drive. The parameters for the simulation are given in Table 1.
The parameters for the simulation of transmission backlash.

Analysis for cable tension
The amount of the cable tension affects the parameters describing the dynamics of the system. These parameters include transmission backlash and stiffness in the joints. Based on the theoretical models, simulations are conducted to reveal the changes of cable tension, along with system states.
A sinusoidal oscillatory motion of amplitude of 100 mrad and frequency of 0.1 Hz is applied as the input. An external load with amplitude of 3.5 N m is exerted on the output drum. Simulation results are shown in Figure 5. The external load would abrupt change when the external load initially applies to the preloaded cable, or when the direction of rotation changes, as shown in Figure 5(a). According to equations (7), (18), (24), (30), and (31), the changes in cable tension of the overall length could be estimated, as shown in the Figure 5(b). The cable tension also undergoes a sudden change when the external load abrupt change. The detailed tension changes on the slip region θ(xBC,t), θ(xDE,t), θ(xFG,t), and θ(xHI,t) are shown in Figure 5(c)–(f), respectively. Based on the knowledge of the cable tension, we can accurately predict elastic elongation of the cable and backlash angle in the joints.
Analysis for transmission backlash
To better understand the generating mechanism of the transmission backlash, we define transmission error as the deviation between the actual position output, θo, and the desired position output (position input, θi, divided by transmission ratio, ic), namely

The system is excited by a sinusoidal oscillatory motion of amplitude of 100 mrad and frequency of 0.1 Hz in position closed-loop control mode. An external load with amplitude of 0.7 N m is exerted on the output drum. Input and output angles of cable drive are shown in Figure 6(a). It can obviously find the jump phenomenon of the transmission error (time intervals 1–2, 3–4, and 5–6) in Figure 6(b). To understand the mechanism of motion propagation, the relation between transmission error and position output is plotted in Figure 6(c). Transmission backlash is defined as the amount of the abrupt variation. It is originated from the change in elastic elongation of the cable, which in turn appears at the moment when the external load undergoes a sudden change, namely, initial loading (time intervals 1–2) and reverse rotation (time intervals 3–4 and 5–6). From the figures, the reproducibility of the hysteresis characteristic in the angular transmission error with the position output can be precisely achieved by the models.

Simulation results for the transmission backlash: (a) the time histories of output angle and input angle, (b) the time histories of transmission error, and (c) transmission error varied with output angle.
The merits of the proposed model
While the previous models only addressed the external load being applied, our work also considered the influence of the cable’s load history. To clarify the merits of the model proposed by this article, the simulation results between the backlash model proposed by Lu and Fan 28 and proposed model are compared and analyzed.
The comparison results are shown in Figure 7. The models are simultaneously excited by a sinusoidal oscillatory motion of amplitude of 100 mrad and frequency of 0.1 Hz in position closed-loop control mode. The changes in cable tension of the free length T(xCD,t) could be estimated, as shown in the Figure 7(a). The curves are almost identical. The time history of the transmission error is shown in Figure 7(b). The differences lie in the backlash angle during reverse rotation. It also could be found in the Figure 7(c), which shows the relation between transmission error and output angle. Then the relation between transmission error and applied load are shown in Figure 7(d). Hysteresis can only be characterized by the proposed model, which is inherent to cable drives. The reason is that applying and removing a load creates a tension bump in the tensile profile of the wrapped cable. It has been analyzed in the proposed model.

Comparison results with model proposed by the previous study: (a) the time histories of cable tension, (b) the time histories of transmission error, (c) transmission error varied with output angle, and (c) transmission error varied with external load.
The comparison results indicate that the proposed model can capture well the motion and force transmission in both phases, which is particularly important for EOTS.
Experimental apparatus and results
An experimental test bench is built to prove the validity of the proposed theoretical model of transmission backlash, as shown in Figure 8. An uncoated steel cable with 7 × 7 construction, nominal diameter 0.81 mm and effective cross-section area 0.3117 mm2 is selected to impart the motion from the input pulley (radius, 20 mm) to the output drum (radius, 102.5 mm). The cable is pre-tensioned by the preload mechanism at one end. The load cell (Viste VS16) and the tension monitor (Viste VXT550) are used to monitor the real-time tension. The torque motor is installed at one end to drive the input pulley. The optical encoder A (SICK DFS60A) and the optical encoder B (HEIDENHAIN RON285) are used to obtain the rotational displacement of input and output shaft, respectively. The torque sensor (Kistler 9349A) measures the external load acting on the output shaft, and the load is simulated by the magnetic powder brake. A dSPACE system (DS-1103) is utilized to decode the feedback signals and generate real-time codes for such a system.

Experiment setup for the transmission backlash of the precise cable drive.
Backlash model validation
To correlate the experimental results with the simulations, the tensile modulus of the cable, G, and the friction coefficient, μ, are experimentally measured to be 1.4 × 10⁴ N and 0.2, respectively. The center distance L between the pulleys is 145.0595 mm. Adjusting the preload force to 100 N by turning the preload mechanism. The input voltage of the magnetic powder brake is set at 4.0 V to simulate external load on the output shaft. In order to keep the pulleys in quasi-static condition to avoid the cable vibration due to resonance, the torque motor is excited by a sinusoidal signal of frequency of 0.1 Hz and amplitude of 100 mrad in position closed-loop control mode.
Figure 9(a) shows the time history of the rotational displacement of the input pulley, output drum, and the external load. It illustrates that the abrupt change of the load appears at the moment during initial loading or reverse rotation. Figure 9(b) shows that the external torque and transmission error undergo a sudden change simultaneously. The experimental results prove that transmission backlash is originated from the abrupt change of the external load. From the experimental results, it is evident that the backlash of precise cable drive could reach the level of sub-mrad. While the position control accuracy of advanced EOTS is required to be superior to 0.1 mrad. It is significant to model the backlash characteristics in precise cable drive to effectively compensate it in such a system.
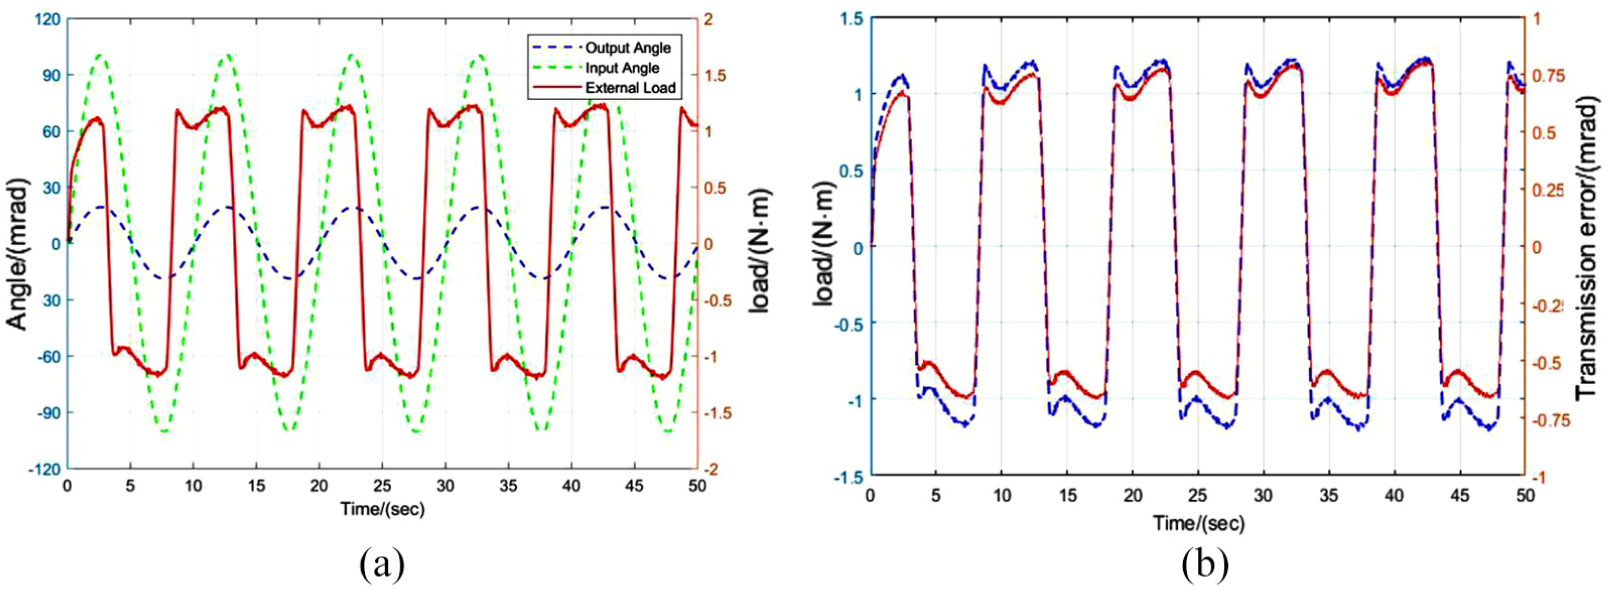
Test results for transmission backlash: (a) the time history of rotational displacements of the input, output pulleys, and external load and (b) the time history of external load and transmission error.
Figure 10 shows that each of the experimental and simulation results of transmission backlash versus position output. The simulation results are calculated by the experimentally measured external load and other parameters given above. The simulations capture all the major trends observed in experiments and match the numbers closely. In the experimental results, we observe that the transmission backlash emerges at the time when we apply external load initially to the preloaded cable and the time when we reverse the direction of the motion, as predicted by the simulations. We use root mean square error (RMSE) to evaluate the goodness of fit between the simulation and experimental results. The RMSE for the proposed model in this case is about 8.27%. It can be concluded that the results of the theoretical analysis are in good agreement with the experimental ones.

Comparison of experimental and simulation results of transmission backlash versus position output.
Effect of external load and preload force on transmission backlash
This section is to analyze the influence of external load and preload force on transmission backlash. When appropriate, we made comparison with simulation results using our proposed model. The experimental and simulation results of transmission backlash in different external load and preload force are shown in Figure 11. The curves represent the predicted results and the discrete points mean the measured results. Figure 11(a) shows that increasing preload force results in a decrease in transmission backlash at different external load. The backlash plunges dramatically when the preload force is small and flattens out when the preload force larger than 70 N. The RMSE at different external load (0.15, 0.47, 0.72, 1.0, and 1.3 N m) are 1.21%, 0.94%, 1%, 2.79%, and 3.82%, respectively. The predicting error mainly comes from the rapid decreasing area, namely the preload force less than 70 N in such a system. It points out that a proper preload force should be applied to keep the backlash in stable state. Fortunately, the threshold value of preload force could be predicted by the model proposed in this article.

Measured and estimated backlash results for different load and pretension force: (a) dependence of preload force on transmission backlash and (b) dependence of external load on transmission backlash.
Figure 11(b) illustrates that the transmission backlash obviously increases as the increases of external load at different preload force. The external load is adjusted from 0 to 3 N m with the magnetic powder brake. When the preload increases from 70 to 180 N, the transmission backlash would decrease slightly. The calculated RMSE at different preload force (70, 100, 140, and 180 N) are 1.99%, 4%, 7.06%, and 3.55%, respectively. From these results, a good agreement between the theoretical analysis and the experimental ones is obtained, which validates the theoretical derivation and numerical results.
Conclusion
In this article, we established a rigorous model of transmission backlash in precise cable drive for EOTS. Unlike previous models in the literature, which only focused on a single operation when the load initially applies to the preloaded cable, the proposed model in this article incorporates the process when the direction of motion changes. The model of transmission backlash in different phase is established by satisfying the system’s geometric and equilibrium constraints, which is applicable to cable drive systems with any external load, pretension, and motion trajectories. Simulations are conducted to reveal the changes in cable tension, along with other system state at all stages of the movement process. The model has been validated on the experimental test bench. The effects of preload force and external load on transmission backlash have been verified through experiments. The results of theoretical analysis are in good agreement with experimental ones. From the research results, the following conclusions could be drawn as follows:
The generating mechanism of the transmission backlash is clarified. It emerges at the moment when the applied load undergoes a sudden change, namely, initial loading and reverse rotation.
The backlash plunges dramatically when the preload force is small and flattens out when the preload force is larger than the threshold value. A proper preload force should be applied to keep the backlash in stable state. The threshold value could be predicted by the model proposed in this article.
The research results in this article would be very useful in the mechanical design, as well as for the purpose of devising precision motion control laws.
Footnotes
Handling Editor: James Baldwin
Declaration of conflicting interests
The author(s) declared no potential conflicts of interest with respect to the research, authorship, and/or publication of this article.
Funding
The author(s) disclosed receipt of the following financial support for the research, authorship, and/or publication of this article: This research was funded by the National Key Basic Research Program of China (973 Program) (grant no.: 2015CB057503).