
Abstract
A large luminance difference between outside and inside the entrance of a tunnel, with inappropriate lighting, could result in short-term visual impairment and other hidden dangers. At present, almost all countries use one luminance reduction coefficient index to evaluate the daytime lighting at the tunnel entrance, and their standard values vary. Studies have shown that light sources have three important characteristics: color temperature, color rendering, and luminous intensity, which all play significant roles in driving recognition efficiency. Based on the analysis of driving recognition safety, this article determines the mathematical relationship between recognition distance and luminance reduction coefficient under different color temperatures using experimental data from real vehicles, and studies the difference in recognition demand under different color temperatures. The gray target recognition experiment involved 12 drivers in 36 light environments combined with different color temperatures, luminance levels, and color rendering index of 70 at the tunnel entrance, with good alignment elements and sight distance at the speed of 80 km/h. The results indicate that recognition demands are different under different color temperature conditions and it is more efficient to use both luminance reduction coefficient and color temperature than only luminance index in the appraisal of daytime tunnel entrance lighting.
Introduction
The entrance is the transition section of the running environment from the outside to the inside of a tunnel. A large difference in environment between outside and inside the entrance of a tunnel, with inappropriate lighting, could result in short-term visual impairment, influencing the driving recognition and other hidden dangers in driving comfort and safety. The key to solving the impact on the driver’s vision is the effective luminance transition between outside and inside the entrance of a tunnel. The appropriate luminance transition can improve driving safety and comfort. 1 The luminance reduction coefficient can describe the difference in luminance between outside and inside the entrance of the tunnel. At present, almost all countries and research organizations use it to evaluate the daytime lighting at tunnel entrances. Their standard values vary greatly.2–7
The characteristics of light sources include color temperature, color rendering, luminous intensity, and so on. Therefore, studies have been carried out by various countries and international academic organizations on the correlation between the characteristics of light sources and the driving recognition. Berson and other scholars put forward that it is a good idea to improve the color rendering of the light source to increase the target visibility without increasing power, and that using high color temperature lighting is an effective method for raising visual acuity. 8 Cui and others created a simulation tunnel environment and took the reaction time as the evaluation index of the recognition experiment. Then through comparative analysis of the experimental results of small target recognition, they concluded that the lighting performance of compact fluorescent lamps with 6400 K is better than that with 2700 K color temperature, and the recognition accuracy of colored small targets can be improved by high color rendering light sources. 9 Yang tested visual cognition based on vision function methods under the condition of different speed and luminous environment. The test results show that under the same speed and luminance conditions, the reaction time of visual cognition corresponding to high color temperature is shorter than that corresponding to the low color temperature. 10 Our research team simulated the tunnel environment of the middle section, and studied the visual performance of small gray target recognition under the light environment combined with different color temperatures, color rendering indexes, and luminance levels. It is concluded that under specific color rendering index, color temperature, and different luminance levels; under specific color rendering index, luminance levels, and different color temperatures; or under specific color temperature, luminance levels, and different color rendering indexes, the drivers’ visual performance is different. 11 Deng selected two tunnels to carry out a small target identification experiment and a color temperature reaction time test and then analyzed the effect of tunnel lighting color rendering index and color temperature on the driver’s visual performance. The outcome shows that the bigger the color-rendering index, the better the driver’s visual performance is. 7 That is, the three important characteristics of light source color temperature, color rendering, and luminous intensity all play significant roles in the driving recognition efficiency.
Based on the above research status, the light source indicators affecting the quality of tunnel lighting mainly include color rendering index, color temperature, and luminous intensity. However, there is a lack of quantitative research at home and abroad on the indicators affecting driver’s driving naturally recognition effect in daytime tunnel entrance section, including index and corresponding values. This article through demand analysis of driving recognition safety, by adopting the advanced dynamic test method, studies the relationship between recognition distance and luminance reduction coefficient under different color temperatures. By examining the difference in recognition demand under different color temperatures, this article obtains the safety evaluation index system on daytime lighting of tunnel entrances.
Analysis of driving recognition safety demand
Tunnel lighting is primarily designed to help the driver recognize road conditions, vehicles, and obstacles ahead within a certain distance so that they can react appropriately and adopt safety measures in time. Stopping sight distance is a significant technical index used by all countries for highway design. The stopping sight distance of the design speed of 80 km/h is 110 m. 12 It is the premise for ensuring driving safety that drivers find the targets on the road in time beyond stopping sight distance. This article regards recognition distance as the dynamic recognition index in the light environment of the tunnel entrance. That the driver can find the target on the road at or beyond a stopping sight distance is the safety standard for the installed lighting at the entrance of the tunnel. We use a 20 × 20 × 20 cm3 gray cube with a 0.2 surface reflection coefficient, recommended by Commission Internationale de L’Eclairage as the test recognition target, 2 as shown in Figure 1.

Recognition target.
Experimental design
In order to study the differences in drivers’ target recognition demand under different color temperatures, this test created different daytime light environments with different characteristics of light sources at the tunnel entrance. The drivers drove to recognize the small gray target from outside of the tunnel at a speed of 80 km/h. In order to eliminate the influence of road alignment and traffic conditions on the driver’s recognition, the experiment was carried out at a highway tunnel entrance paved with asphalt concrete in Guizhou Province, which is straight, low in traffic volume, and gentle in slope gradient, and whose design speed is 80 km/h.
Test environmental conditions
This test selected higher than 6000 K (A1) and lower than 6000 K (A2) two color temperature levels outside the tunnel, and 3500 K (B1), 4000 K (B2), 4500 K (B3), 5000 K (B4), 5500 K (B5), 6000 K (B6) 6 color temperature levels of artificial light at the entrance of the tunnel. According to the principle of the balance of economy and recognition effect, lamps with color rendering index 70 are widely used on the road. Considering the engineering practicality, the color-rendering index 70 was used in this test. In order to ensure the coverage extent and effectiveness of the luminance, the luminance reduction coefficient of each orthogonal text ranging from 0.01 to 0.1, covered three conditions that drivers could find the target at more than one stopping sight distance (C1), a stopping sight distance (C2), and less than one stopping sight distance (C3). A total of 36 sets of experiments are shown in Table 1. Here, the luminance reduction coefficient is the ratio of luminance inside tunnel entrance to that outside the tunnel entrance. The luminance outside the tunnel entrance means the average of the luminance values measured in a conical field of view, subtending an angle of 20° (2 × 10°), by an observer located at the reference point and looking toward a centered point at a height equal to one-quarter of the height of the tunnel opening (L20), mentioned in the guide for tunnel lighting of most international academic organizations and countries.
Comprehensive test of different light sources inside and outside the tunnel.

– = omitted data.
Test drivers and vehicles
Test drivers
At present, the average sample size of studies in the field of driver’s visual cognition on the road is between 4 and 8. 13 Based on human cognitive statistics, according to random on-the-spot sampling, the test randomly selected 12 drivers who were healthy and highly skilled, with normal vision, and no eye diseases or adverse effects such as drinking and medication during the test period.
Test vehicles
The height of the eye of the car driver is lower than that of the truck driver. The car driver’s scope of degree of vision is low and it is more difficult for them to recognize the target on the road in the same environment. In order to ensure the validity of the test data, according to the most unfavorable principle, typical cars were selected as the tested vehicle, as shown in Figure 2.

Test vehicle.
Testing instruments and equipment
Spectral irradiance meter
The CL-500A can be used to detect the color rendering index, luminance, chromaticity, color temperature, and other parameters of light source, as shown in Figure 3(a). The measuring luminance ranges from 0.1 to 100,000l×. Accuracy ranges from 2% to 22% compared to the displayed luminance value.

Experimental instruments and equipment: (a) Spectral irradiance meter, (b) Luminous intensity detector, (c) Dynamic eye tracker and (d) Non-contact velocity sensor for a vehicle.
Luminous intensity detector
Luminous intensity detector was used to measure L20, as shown in Figure 3(b). The measuring luminance ranges from 0 to 6500 cd/m2, the angle is 20 vertical, and the ambient temperature is –25°C to 55°C, then do the real-time measurement and show the luminance level outside the tunnel portal.
Dynamic eye tracker
The SMI iView X 1.05 build 49 HED was used to dynamically record road environment information and the drivers’ fixation point, pupil diameter, and other information in the drivers’ vision. Screen resolution is 768*576 pixels; data acquisition frequency is 50 Hz; horizontal eye movements catch range is ± 30°, the vertical direction is ±25°; eye-tracking resolution is 0.1°; and eye focus accuracy is 0.5°–1.0°, as shown in Figure 3(c).
Noncontact velocity sensor for a vehicle
The test used CTM-8 C to locate the vehicles’ movement, detect and record the vehicle real-time running speed, and demarcate the drivers’ location when they saw the target and the target’s location, as shown in Figure 3(d). The minimum resolution of system speed is 0.01 km/h, and the maximum acquisition frequency is 50 Hz.
Test method
The target was placed at the starting point in the tunnel entrance without the influence of the light outside. The researchers adjusted the color temperatures and luminance levels. The driver wore the eye tracker, driving from outside into the tunnel at 80 km/h, to recognize the target, taking if finding target easily and quickly as the criteria. The vehicle was equipped with the noncontact velocity sensor to mark the location in which drivers found the target and target’s location, in order to calculate the recognition distance. The researchers detected and recorded the L20, color temperature outside the tunnel, and luminance, color temperature at the location of the target inside the tunnel. Then the researchers adjusted the color temperature and luminance level at the tunnel portal according to the last recognition, and drivers repeated recognizing. The dynamic eye tracker collected the information of the driver’s gaze to eliminate the invalid data and correct the location in which drivers found the target. In order to ensure the synchronism of the test instruments, the timer on the instruments must be calibrated before tests.
Result and discussion
In order to research the driving recognition safety demand under different color temperatures, we have organized and analyzed experimental data sets, eliminated anomalies, and finally got 50 effective test samples for color temperature lower than 6000 K outside the tunnel and 45 for higher than 6000 K. The average speed was used as the characteristic value of the vehicle’s speed. The luminance reduction coefficient was the ratio of luminance inside tunnel entrance to L20. The recognition distance was the actual distance between the location in which drivers found the target and the target’s location.
Analysis of the interactive relationship between recognition distance and luminance reduction coefficient under different color temperatures
We separately organized and analyzed experimental data sets of color temperatures lower and higher than 6000 K outside the tunnel, then obtained the correlation between recognition distance and luminance reduction coefficient under different color temperatures, as shown in Figures 4 and 5.

Correlation between recognition distance and luminance reduction coefficient when color temperature outside is lower than 6000 K: (a) Color temperature at 3500 K, (b) Color temperature at 4000 K, (c) Color temperature at 4500 K, (d) Color temperature at 5000 K, (e) Color temperature at 5500 K and (f) Color temperature at 6000 K.
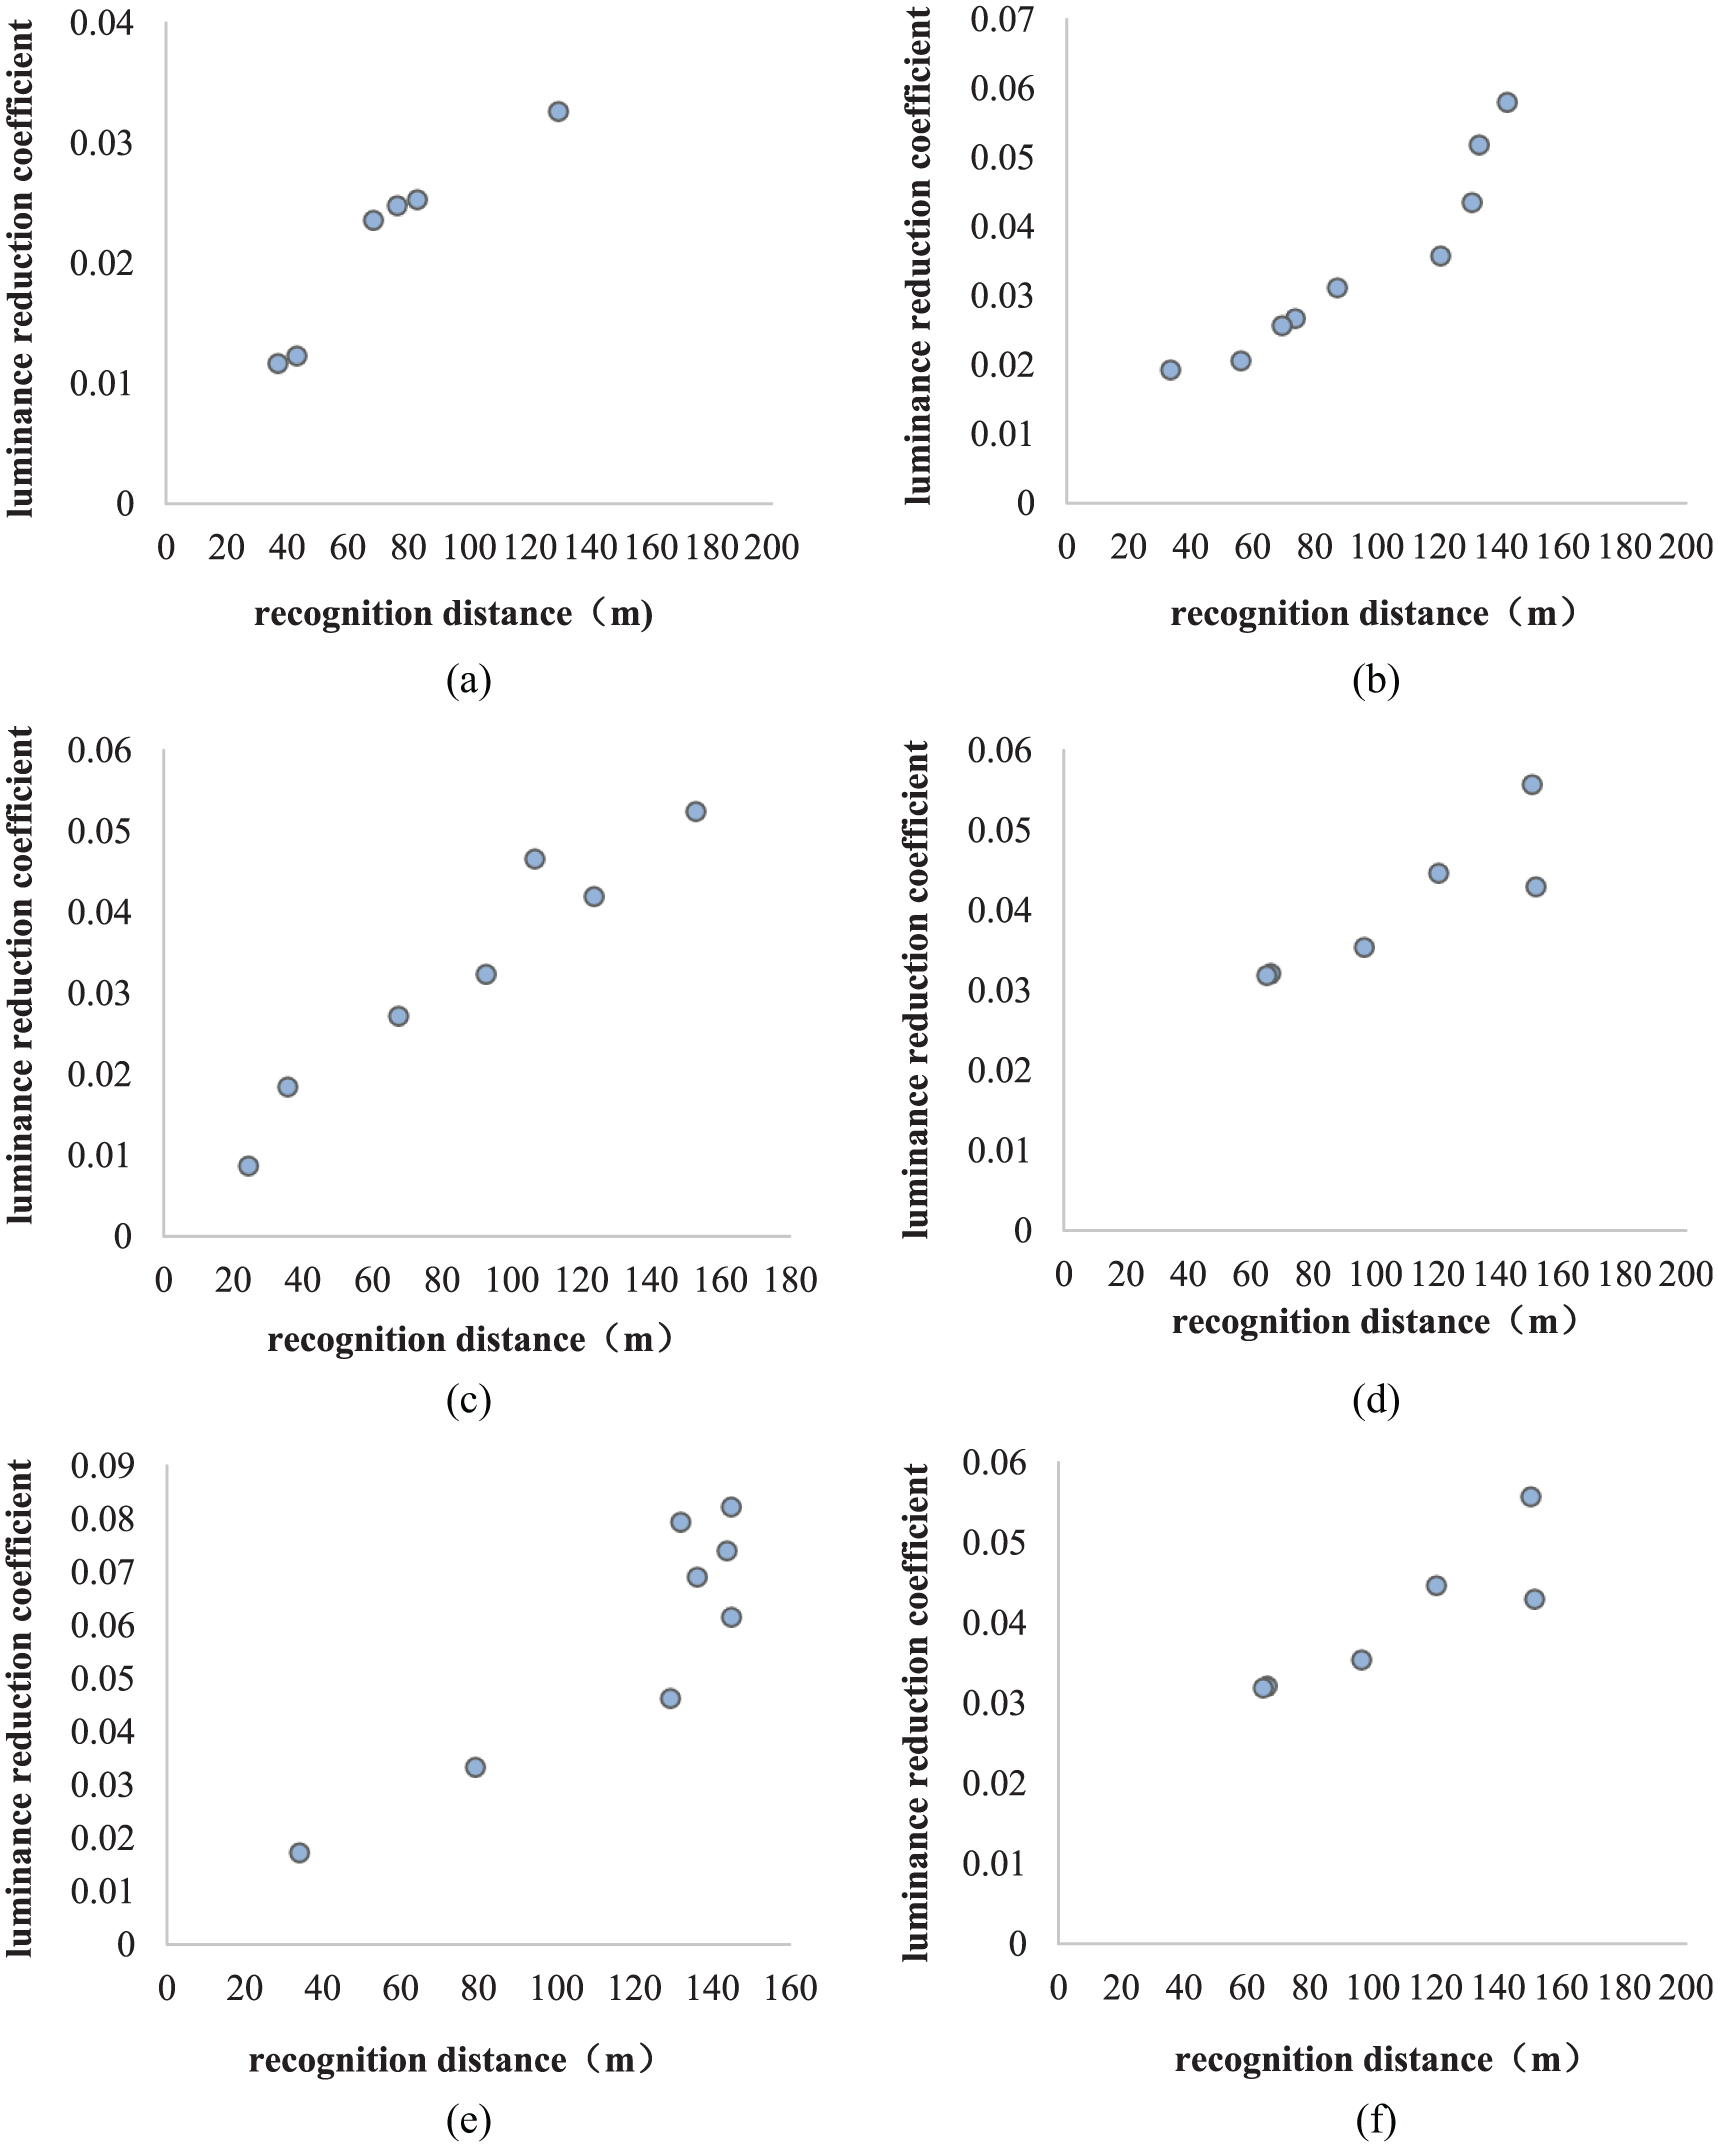
Correlation between recognition distance and luminance reduction coefficient when color temperature outside is higher than 6000 K: (a) Color temperature at 3500 K, (b) Color temperature at 4000 K, (c) Color temperature at 4500 K, (d) Color temperature at 5000 K, (e) Color temperature at 5500 K and (f) Color temperature at 6000 K.
Figures 4 and 5 show that when the color temperature is lower or higher than 6000 K outside the tunnel, the correlation between the recognition distance (D) and the luminance reduction coefficient (λ) is positive. That is, the higher the luminance reduction coefficient, the recognition distance shows an upward trend accordingly under different color temperatures. However, when the luminance reduction coefficient increases to a certain extent, the recognition distance no longer increases; the luminance reduction coefficient corresponding to the same recognition distance varies greatly under different color temperatures. This is because the increase in the λ in the tunnel entrance reduces the difference in luminance between inside and outside the tunnel, which enables the driver to recognize the road conditions at a longer distance. On the contrary, the lower the λ, the greater the difference in luminance between inside and outside the tunnel, which leads to decrease in the driver’s visual recognition ability and shortening of the corresponding D.
The relational model between recognition distance and luminance reduction coefficient under different color temperatures
In most cases, there is no way to know the probability distribution of unknown events. Normal distribution function is a better choice for the model because it is the most possible form of all probability distribution. The integral form of sigmoid function, which is expressed as
According to the distribution characteristics in Figures 4 and 5, we plotted the λ and D values obtained from the test and found that the correlation between recognition distance and luminance reduction coefficient under different color temperatures fit the sigmoid function model as expected. From the above analysis, under different color temperature conditions, the correlation between recognition distance and luminance reduction coefficient is different, so it is necessary to simulate separately to determine the parameters of the formula. The calculation process of parameters is explained by taking the case of color temperature lower than 6000 outside and 3500 K inside the tunnel as an example. The data of λ and D in the case of color temperature lower than 6000 outside and 3500 K inside the tunnel are shown in Table 2. We fit the λ and D with sigmoid function model in MATLAB and got the model regression coefficient β0 = 4.05, β1 = 166, β2 = 39.8, β3 = −2.8, and R2 = 0.952. After that we used the Broyden–Fletcher–Goldfarb–Shanno (BFGS) method of quasi-Newton method to determine the parameters, and finally drew the fitting curve of the model, as shown in Figure 6.
Data of λ and D in the case of color temperature more than 6000 outside and 6000 K inside the tunnel.


Model fitting curve under the condition of color temperature lower than 6000 outside and 3500 K inside the tunnel.
In the same way, all the final regression equations for all environmental conditions are as formulas (1)–(12), shown in Table 3. In the formulas, λ represents the luminance reduction coefficient, D is the recognition distance, and the models apply to the design speed at 80 km/h road tunnel. The goodness of fit of the test models is shown in Table 4. The regression model is significant with a good fitting degree.
Regression equation.

λ: luminance reduction coefficient; D: recognition distance.
Determination coefficient.

Driving recognition safety demand threshold under different color temperatures
According to the quantitative models of recognition distance and luminance reduction coefficient under different color temperatures, we took stopping sight distance 110 m corresponding to the designed speed of 80 km/h into D in models (1)–(12). Finally, we got the luminance reduction coefficient threshold values satisfying the driving recognition safety demand under different color temperatures of low-volume tunnel entrance during the daytime, as shown in Table 5.
Luminance reduction coefficient threshold of tunnel entrance during daytime.

As per the analysis in Table 5, when the color temperature outside is lower than 6000 K, with increase in the artificial lighting color temperature inside the tunnel entrance, the luminance reduction coefficient threshold value decreases, and it is the minimum under color temperature 6000 K inside.
When the color temperature outside is higher than 6000 K, with increase in the artificial lighting color temperature inside the tunnel entrance, the luminance reduction coefficient threshold value shows an upward trend accordingly. However, when the color temperature inside approaches 6000 K, it tends to be stable and the luminance reduction coefficient threshold value is the minimum under color temperature 3500 K inside.
Therefore, for the control of tunnel entrance lighting during the daytime, the color temperature of the artificial light at the tunnel entrance should be regulated and controlled to 6000 K when the color temperature outside is lower than 6000 K. When the color temperature outside is lower than 6000 K, the color temperature of the artificial light at the tunnel entrance should be regulated and controlled to 3500 K.
In short, luminance reduction coefficient threshold values satisfying the driving recognition safety vary by different color temperatures, and the difference is distinct. The index in the appraisal of daytime tunnel entrance lighting should be a comprehensive index system that includes color temperature and luminance reduction coefficient.
Conclusion
Based on the analysis of driving recognition safety, considering the engineering practicality, this article designed a natural driving recognition experiment in the different color temperature and luminance level environments with a color rendering index of 70. The experimental results show that when the color rendering index is 70, both luminance level and color rendering index directly affect the driver’s visual effect at the tunnel entrance during daytime. Furthermore, this article determines the mathematical relationship between recognition distance and luminance reduction coefficient under different color temperatures using experimental data from real vehicles, studies the difference in recognition demand under different color temperatures, and obtained the index and corresponding values in the appraisal of daytime tunnel entrance lighting. The conclusions are as follows:
Color temperature at the entrance of a tunnel influences the driver’s driving recognition safety during the daytime, and luminance reduction coefficient threshold values satisfying the driving recognition safety are different under different color temperatures. The index in the appraisal of daytime tunnel entrance lighting should be a comprehensive index system including color temperature and luminance reduction coefficient.
When the color temperature outside is lower than 6000 K, with increase in the artificial lighting color temperature inside the tunnel entrance, the luminance reduction coefficient threshold value decreases, and it is the minimum under color temperature 6000 K inside. When the color temperature outside is higher than 6000 K, with increase in the artificial lighting color temperature inside the tunnel entrance, the luminance reduction coefficient threshold value shows an upward trend accordingly. However, when the color temperature inside approaches to 6000 K, the luminance reduction coefficient threshold value tends to be stable, and it is the minimum under color temperature 3500 K inside.
When the color temperature outside is lower than 6000 K, the model between recognition distance and luminance reduction coefficient under different color temperatures is (1)–(6). When the color temperature outside is higher than 6000 K, the relationship model is (7)–(12). The luminance reduction coefficient threshold under different color temperatures of the low-volume tunnel entrance during daytime is obtained as per Table 5.
Footnotes
Handling Editor: Martin Baumann
Declaration of conflicting interests
The author(s) declared no potential conflicts of interest with respect to the research, authorship, and/or publication of this article.
Funding
The author(s) disclosed receipt of the following financial support for the research, authorship, and/or publication of this article: This work was supported by the National Natural Science Foundation of China (Project No. 61531005).