
Abstract
Road alignment, traffic flow, and sign information interact and create complex traffic situations. To evaluate the effects of freeway horizontal radius, slope grade, traffic flow, and sign information on subjective driving workload and performance, a simulated driving experiment based on an orthogonal test design was conducted. The National Aeronautics and Space Administration Task Load Index was used to measure self-reported workload. Data regarding speed and lane deviation were collected through the driving simulator. A multivariate analysis of variance results indicated that the radius of the horizontal curve significantly influenced workload score, average speed, and lane deviation. It was observed that in a high workload environment, participants exerted more effort on the driving task; however, driving performance still decreased. Although there was no significant correlation between slope grade and subjective driving workload or performance, the primary effect of slope grade on workload and average speed was statistically significant. The amount of sign information significantly influenced the driver’s perceived workload; however, it did not significantly impact driving performance. In addition, the low correlation coefficient between subjective workload and performance was obtained. These research findings can provide insights for the design of freeway alignments and traffic signs to maintain optimal workload and minimize safety risks.
Introduction
A recent report from the World Health Organization indicates that annually 1.24 million people die due to traffic crashes; in 2015 alone, 59,000 people died in motor vehicle crashes in China. 1 According to the relevant statistical data from Ministry of Public Security Traffic Management Bureau, 2 90% of crashes are caused by human factors. An analysis of these crashes relevant to human factors shows that in 41.4% of the crashes, drivers did not encounter any obvious irregularities nor did they make any subjective errors; the cause is that drivers failed to accurately perceive the surrounding environment. 3 With the ever-increasing number of accidents, there has been a growing concern for freeway traffic safety, and driving workload and performance have become the focus of freeway safety research. Driving is a complex task characterized by multiple simultaneous factors and actions that require a driver to process information and operate the vehicle continuously. According to Yerkes–Dodson’s law, 4 when drivers are at a high level of mental workload, they are prone to tension and stress, which potentially causes traffic accidents. Conversely, if drivers are under a low level of cognitive load for a long time, they are prone to sleepiness or distraction. Improper driving behavior induced by extreme driving workload often causes serious accidents, especially on freeways, due to fast vehicle speeds. Thus, it is crucial to harmonize the multifarious and diverse freeway traffic factors with drivers’ mental and physical workload to achieve excellent driving performance and reduce crashes.
In general, driving behavior determines the occurrence of accidents, while driving workload affects drivers’ cognition, reaction, and operation behavior. Investigating driving workload in different environments can provide an understanding of poor driving performance. Workload has been defined as a measure of the effort experienced by a human operator while performing a task, independent of the performance of the task itself. 5 There are three primary measurement methods for driving workload: subjective evaluation, driving performance analysis, and physiological testing. Among them, the subjective evaluation method has been frequently adopted for the advantage that its self-reported measures are provided directly by the operator, which can be collected directly after the task with no interference to the task. 6 These methods include the National Aeronautics and Space Administration Task Load Index (NASA-TLX) and the Subjective Workload Assessment Technique (SWAT).7,8 Driving performance is closely related to traffic safety. Indices, such as longitudinal velocity, rotational velocity, accelerator pedal, brake pedal, steering wheel, lane deviation, lane standard deviation, time-to-collision, reaction time, have been widely used to assess driving performance and traffic safety.9–11 Physiological measures place emphasis on physical reactions of the body, the rhythmical and morphological features of electrocardiographic, electroencephalogram and event-related potentials, eyelid movements and galvanic skin response, and so on have been effectively applied to quantifying the workload a person experienced.12,13
Zeitlin 14 found that driving workload consists of two parts: (1) the fixed workload caused by road alignment, speed, and traffic density, and (2) the varying workload caused by the uncertainty of the surrounding environment. The former is the focus of the present research. We already know that driving workload and performance are affected by a variety of factors, such as alignment, traffic flow, and sign information. However, while many researchers have studied the impacts of these factors on driving workload or performance separately, the present study looks at both factors together.
Prior studies examined the relationships between alignment and driving workload or performance.9,15 It was found that road alignment directly influences driving performance. On a curve segment, drivers must adjust vehicle speed and lane position to accommodate the severity of the curve, even adopting a corner-cutting maneuver when necessary, which requires greater control of the pedals and steering. 16 When driving in a longitudinal slope section, drivers must continuously control the pedal to adjust the output power and the braking force of the engine to maintain stability in vehicle speed. Sharp horizontal curves and vertical slopes increase the difficulty of vehicle control and the risk of running off the road or collision. 17 It has also been found that drivers must allocate more attentional resources to collecting information and more mental resources to making decisions, and, thus, they have less time for manual control on curve or slope driving tasks. 18 In addition, the particular road alignment of curves or slopes reduces sight distance, limiting drivers’ anticipation of the road ahead and leading to higher uncertainty about the course of the road, which leads to high cognitive load. 19 The large acceleration experienced by drivers when traversing a curve or steep slope causes discomfort for drivers and increases workload as they brake or speed up. Other studies used drivers’ notice and react time measures to study the relationships between driving performance and traffic flow. 20 Driving workload was found to likely increase due to heavy traffic compared to free driving. 21 While driving, drivers must properly perceive road signs, maintain alertness to make decisions, and perform driving actions at the right time. 22 Recognition time has been used to analyze the effect of different sign information on drivers’ mental workload. It has been found that when the amount of road sign information exceeds a certain threshold, drivers’ cognitive time increases significantly.23–25 Particularly, researchers have investigated the effect on drivers’ visual search of the number of road names displayed on traffic signs; the findings show that five or six is the threshold of the number of road names displayed on a single traffic sign. 26
Road alignment, traffic flow, and sign information are the most common driving elements that we encounter on freeways. These elements interact to create complex traffic situations. Under complex traffic situations, drivers must allocate more mental resources and exert greater physical effort to control the vehicle and accommodate changes in the traffic environment. 27 Although previous studies explored the influence of these factors on driving workload or performance separately, few studies have attempted to simultaneously study the effects of alignment, traffic flow, and sign information on both physical and psychological aspects of driving workload and performance. The present study addresses this issue. In this study, the effects of horizontal radius, slope grade, traffic flow, and sign information on the perceived driving workload and performance were evaluated using a simulated driving experiment of an orthogonal design. The NASA-TLX was used to measure self-reported workload ratings during the driving task. Key indicators of poor driving performance—inappropriate speed and lane deviation, which reflect the driver’s ability of longitudinal and lateral control—were investigated. Furthermore, the relationship between workload and performance was also examined by a Pearson correlation analysis. This investigation of workload and driving behavior in different environments can provide insights for improving traffic management and facility design.
Method
Apparatus
The driving simulation platform, as shown in Figure 1, located at the Intelligent Transportation Systems Research Center, Wuhan University of Technology was used to conduct the experiment and collect the data. It is a single-channel projection simulator composed of an instrumented vehicle and UC-win/road software. The computer collects data from the vehicle’s controller area network (CAN) and sends it to the simulator software as the input of operation behavior by the self-developed SDK plug-in. The simulator simulated driving along with the actual operation of an instrumented vehicle. It is a high-fidelity, high-performance driving simulator with an actual vehicle. The driving scenario was designed and edited by UC-win/road software, which has the advantages of simple, fast features for virtual traffic environment simulation and virtual road modeling.

Driving simulator and scene: (a) simulation platform, (b) freeway scenario, and (c) simulated driving.
Subjects
Eleven participants (10 males and 1 female) were recruited to take part in this study. Drivers ranged in age from 22 to 34 years (M = 27.55 ± 4.13), had held a valid driver’s license between 2 and 9 years (M = 4.36 ± 2.38), and drove between 5000 and 20,000 km/year (M = 11.55.45 ± 5.32). The participants had no short-term health problems, according to their self-report. All participants had normal or corrected-to-normal vision.
Scenario design
The present study focused on the effect of four factors—radius, slope grade, traffic flow, and sign information—on driving workload and performance. Taking into account the different levels of each factor, an orthogonal experimental design was used to reduce the number of trials. The parameters of the four levels for each factor were matched with the specifications of the Design Specification for Highway Alignment (JTG D20-2006) (in China). However, the maximum or minimum values slightly exceeded the specified range to induce high driving workload. Previous research shows that driving workload on downhill sections is higher than on uphill sections, 28 so only a downhill section was designed in this experiment.
Different complex traffic signs were used for loading cognitive workload. Information entropy calculation method was applied to measure traffic sign information. A detailed explanation of the quantization of traffic sign information was given by Lyu et al. 29 The amount of sign information in the range of (0 to 40 bit), (40 to 80 bit), (80 to 120 bit), and (120 bit to +∞) was marked as “level A,”“level B,”“level C,” and “level D,” respectively. This grading refers to the method of grading the traffic sign information studied by Fu et al., 30 and the effectiveness of traffic sign information on driving workload loading has been confirmed. 31
The values of each level for the four factors are shown in Table 1. Finally, an orthogonal test was designed according to the L16(45) orthogonal table, which includes 16 simulated driving test scenarios, as shown in Table 2.
Values of each level for the four factors.

Orthogonal test table.

As for the scene design process, the parameters of freeway alignment for each position in the scene were designed in advance. Traffic flow and signs were loaded into the specified location of the road through UC-win/road software and then generated the experimental scenes. All parameters about road alignment, traffic volume, vehicle motion corresponding to each position of the vehicle were recorded by time, design stake number, and coordinates. The simulated driving scene was a two-way four-lane freeway on a plain micro-hill area, and the designed speed was 100 km/h. The length of each test section was approximately 600 m. The start and end points of each test section were displayed by prominent signs, and a transition zone was provided between the test sections.
Experiment design and procedure
Driving task
The driving task consisted of a primary task and a secondary task. The primary task was to drive at a speed limit of 100 km/h and perform moderate driving maneuvers on the test sections. In order to reduce the interference of lane-changing maneuver on deceleration behavior, participants were required to drive in the inner lane as far as possible to avoid changing lanes during the experiment. Driving performance was indicated by speed control and lane maintenance ability. The secondary task was to recognize the signs during driving. Different complex traffic signs were used for increasing workload. These signs were located at the middle of the test sections. The prominent signs contained the destination name clearly marked and identified at the starting point of the test sections. The same destination name also appeared on the signs located in the middle of the segment. Participants were asked to recognize the signs and identify the correct direction of the destination given by the prominent signage and then report the direction to the experiment coordinator. Recognition mistakes were recorded on every test section. The driver’s operation and vehicle motion data were automatically recorded by the simulator.
Subjective workload measurement
In this study, the NASA-TLX was used to measure the driver’s subjective workload. Borghini et al. 32 indicated this method to be reliable for the measurement of different workload levels. After completing the driving task on a certain test section with unique radius, slope grade, traffic flow, and sign information parameters, participants were asked to subjectively rate their workload using the NASA-TLX workload questionnaire. Participants completed six-dimension questionnaires (10-point rating scale) in total, with each rating questionnaire assessing the subscales of workload: mental demand, physical demand, temporal demand, performance, effort, and frustration. The overall NASA-TLX workload score was calculated by multiplying each dimension with the corresponding rating.
Procedure
Before commencing the experiment, participants were briefed on the purpose of the study and instructed on how to complete the driving task. After briefing, participants were asked to read and sign an informed consent form and demographic information form. Experiment coordinators explained the NASA-TLX response sheet and the six subcomponents of workload. After, participants were brought to the simulator to perform exercises to acquaint themselves with the driving task at the posted speed limit of 100 km/h. The driving exercises started with an explanation of the secondary task. When the participant felt familiar with the secondary task, the experimenter started the formal test. After completing one test section, the participant was asked to answer the NASA-TLX. When 16 test sections were finished, participants were asked to rank each subcomponent of the NASA-TLX through a set of pairwise comparisons. The whole process did not take more than 2 h. This prevented fatigued driving. After completing the test, participants were provided with ¥200 as their monetary compensation before leaving.
Data analysis
In this study, two categories of data were used: subjective workload and vehicle motion. During the experiment, operating data (steering, gas, brake, etc.), vehicle motion data (speed, acceleration, yaw rate, etc.), and maneuver data (time headway, lane deviation, etc.) were collected in real time at a frequency of 10 Hz. As performance measures, driving speed and lane deviation were derived for each participant, which indicated the driver’s longitudinal and lateral control performance, respectively.
As for subjective workload, not only were six subscales of workload collected, but also the overall estimate of workload was calculated based on the questionnaire. The questionnaire consisted of two parts. First, right after each test scenario, participants were asked to rate the six subscales of workload. Each subscale was presented as a 10-point rating scale anchored by bipolar descriptors (1 = very low; 10 = very high). In this study, all ratings were standardized and converted to a percentage using equation (1) to make the interpretation of results more consistent and comparable to other studies. In the second part, after completing all test tasks, participants were given a list of 15 pairwise comparisons of the six scales and asked to choose the scale that, in their opinion, contributed most to the overall workload. The number of times each scale was chosen was added up to provide a weighting for that workload scale. The weight was used to determine its contribution to total workload, as shown by equation (2)

where Li was the percent subscales workload and ri was the rating for the ith scale

where wi was the weighting for the ith scale derived from the pairwise comparisons.
An analysis of variance (ANOVA) of the orthogonal test was used to determine the effects of radius, slope grade, traffic flow, and sign information on NASA-TLX subcomponents and driving performance. Descriptive statistics were used to evaluate how those four factors affect subjective workload and performance variables. The relationship between driving performance and workload was assessed by a Pearson correlation analysis.
Results
Effect of four factors on subjective workload
The one-way ANOVA showed that participants’ subjective workload in different test sections varied significantly (F(15, 160) = 5.351, p < 0.001). The highest average subjective workload was detected on the ninth test section, which consisted of a sharp curve (R =300 m), steep slope (i = –5.5%), large traffic flow (1400 pcu/h ln), and greater sign information (199 bit). On the ninth section, the average workload increased to 66.7. On the contrary, the minimum average workload value of 34.7 appeared on the 16th test section, which contained gentle road alignment and low traffic flow and sign information. The blue boxplot in Figure 2 shows the distribution of subjective workload scores as perceived by participants on each test scenario.

Boxplot of subjective workload and driving speed on test sections.
A multivariate ANOVA for the orthogonal test indicated that the amount of sign information (F(3, 163) = 13.994, p < 0.001), radius of the horizontal curve (F(3, 163) = 4.469, p = 0.005), and slope grade (F(3, 163) = 2.942, p = 0.035) significantly influenced the subjective workload score, while the influence of the volume of traffic flow (F(3, 163) = 1.334, p = 0.265) on workload was not statistically significant (as shown in Table 3).
Multivariate analysis of variance results for subjective workload.

Note: The p value less than 0.05 is shown in bold, indicating that the variable has a significant effect.
Effect of the four factors on driving performance
As shown in Figure 3, the maximum and minimum values of the average driving speed on the test sections were 101.6 and 84.8 km/h, which presented in the 16th and 7th scenes, respectively. For driving speed, it appears that the four factors had an opposite effect compared to driving workload. The ANOVA results show that the average driving speed in different test sections varied significantly (F(15, 160) = 5.816,p < 0.001). The multivariate ANOVA (as shown in Table 4) results reveal that the radius of the horizontal curve (F(3, 163) = 15.905, p < 0.001) and slope grade (F(3, 163) = 6.932, p < 0.001) significantly influenced driving speed, while the influence of the volume of traffic flow (F(3, 163) = 1.226, p = 0.302) and amount of sign information (F(3, 163) = 0.833, p = 0.477) were not statistically significant.

Average lane deviation on test sections.
Multivariate analysis of variance results for driving speed.

Note: The p value less than 0.05 is shown in bold, indicating that the variable has a significant effect.
Figure 3 shows the average value of the mean and variance of lane deviation on the test sections. The ANOVA results are listed in Table 5. The average lane deviation varied significantly (F(15, 160) = 2.301, p = 0.006), and the highest average lane deviation was detected on the ninth test section, on which it was difficult for drivers to maintain excellent performance due to the complex road alignment (R = 300) and driving environment. According to the multivariate ANOVA results (as shown in Table 5), only the radius of the horizontal curve (F(3, 163) = 4.182, p = 0.007) was found to significantly influence lane deviation.
Multivariate analysis of variance results for lane deviation.
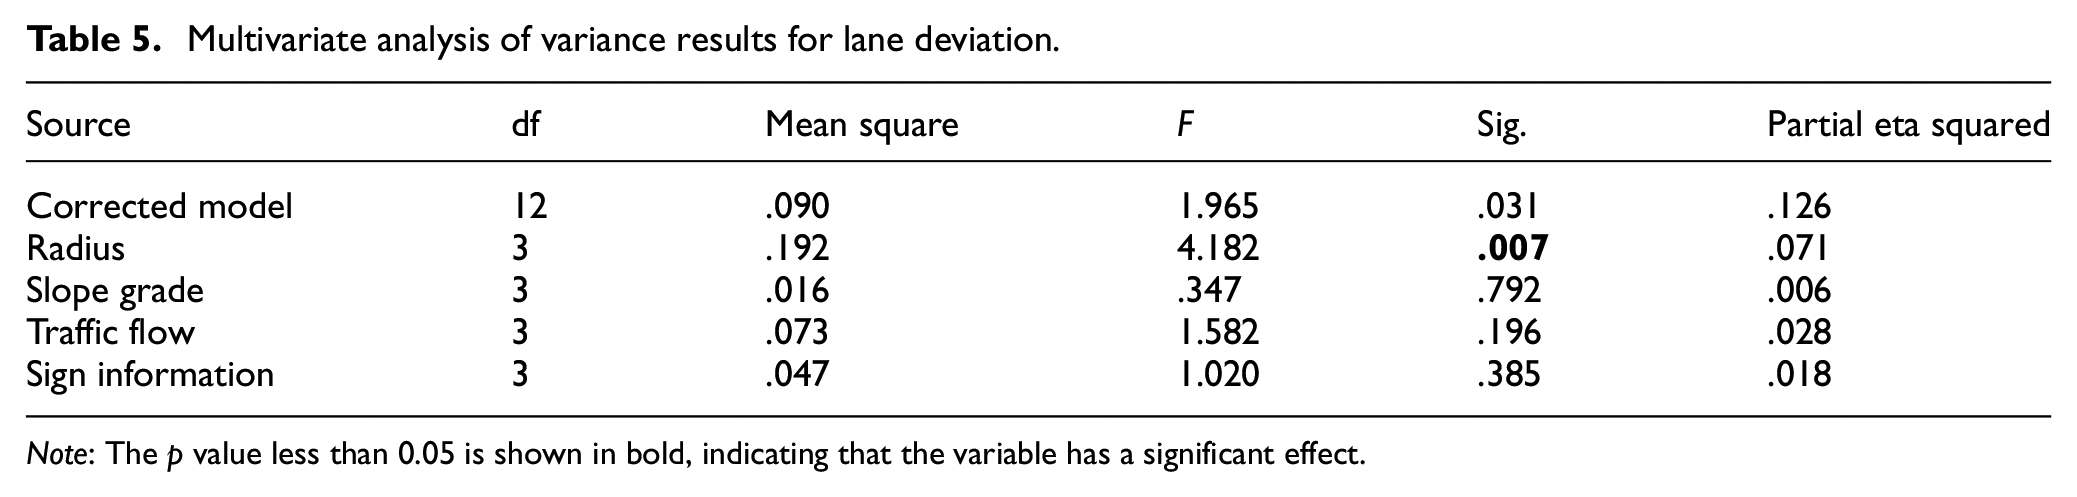
Note: The p value less than 0.05 is shown in bold, indicating that the variable has a significant effect.
Discussion
Associations between road alignment and workload or driving performance
As a special component of freeway design, curves are comparatively complex road geometry structures that reduce sight distance, limiting drivers’ anticipation of the road ahead and leading to higher uncertainty. 16 The multivariate ANOVA results show that the radius of the horizontal curve significantly influenced the workload score, average speed, and lane deviation. Driving on sharp curves, drivers must allocate more attentional resources to collecting information about the environment ahead and require a fast and reliable analysis of the spatial-temporal parameters to keep the vehicle in the lane. Therefore, the mental and physical demand scores increased on curves, as shown in Table 6. This result is consistent with the findings of a previous study by Charlton, 33 who illustrated that when driving through curves, drivers need more mental resources to make decisions and thus have less time for manual control. In fact, it can be inferred that the effort required for the driving task increased and satisfactory driving performance decreased with a decreasing curve radius based on the finding that performance was positively correlated with radius (r = 0.208, p < 0.01) and effort was negatively correlated with radius (r = –0.163, p < 0.05). According to the Pearson correlation analysis, average speed was positively correlated with radius (r = 0.437, p < 0.01) and average lane deviation was negatively correlated with radius (r = –0.155, p < 0.01). This indicates that participants decreased their average speed on sharp curves, but the mean and standard deviation of lane deviation increased with a decreasing radius. Similar results were found by Coutton-Jean et al., 34 who found that the maximum lane position has a significant positive correlation with the curvature change rate.
Pearson correlation between four factors and workload and performance.

Correlation is significant at the 0.05 level (two-tailed).
Correlation is significant at the 0.01 level (two-tailed).
There was no significant correlation between slope grade and subjective driving workload or performance. However, similar to the findings of Lin et al., 35 who concluded that there is a positive correlation between workload and slope gradient on downhill longitudinal sections, the primary effects of slope grade on workload and average speed were statistically significant.
Associations between sign information and driving workload or performance
The multivariate ANOVA results show that the amount of sign information significantly influenced the driver’s perceived workload, indicating the subjective workload increased with increasing sign information. These results have congruent validity with the study conducted by Lyu et al., 29 in which cognition time was used to measure workload, and the average cognition time of traffic signs with level 1–4 information significantly increased. From the perceived workload point of view, a higher workload reflected that the driver required more resources to accomplish the driving task. The analysis of the self-reported workload measures confirmed that mental demand (r = 0.531, p < 0.01), physical demand (r = 0.237, p < 0.01), and temporal demand (r = 0.454, p < 0.01) were positively correlated with the amount of sign information (as shown in Table 6). With increasing information, participants exerted more effort for cognition and driving, while driving performance decreased and the frustration rating increased. This illustrates that cognition of traffic sign information occupied an ample amount of mental resource and increased the driving workload.
Similarly, the present study found that the mean of lane deviation (r = 0.156, p = 0.038) and the standard deviation of lane deviation (r = 0.232, p = 0.002) were positively correlated with sign information. The mean and standard deviation of lane deviation increased as the amount of information increased, because participants exerted less effort on lane maintenance and allocated more mental resource to sign recognition. However, the compensation strategy proposed by De Craen et al. 36 —that when workload is too high, the driver decreases driving speed to extend cognitive time to reduce the driving workload—was not found in the preliminary analysis of the present study. Future research should study the associations between sign information and compensation behavior.
Relationship between driving workload and performance
Table 7 shows that only average lane deviation was positively correlated with total workload (r = 0.182, p < 0.05). The low correlation results between subjective workload and performance suggest that workload and driving behavior may not be linearly related. The influence mechanism of the traffic environment and workload on performance can be summarized as two conclusions. First, subjective workload increased due to complex traffic conditions, which would certainly result in impaired driving performance. Drivers with high workload may be unable to respond quickly or make good decisions about traffic maneuvers. Second, compensation strategies, such as reducing driving speed, were usually used to reduce workload and achieve better performance. Hockey 37 proposed that further resources may be required to protect performance under a high workload, but only at the expense of increased subjective effort and behavioral and physiological costs. Even if subjective workload did not significantly influence driving behavior in the current study, maintaining optimal workload levels is important for the safety of drivers.
Pearson correlations between workload and performance.
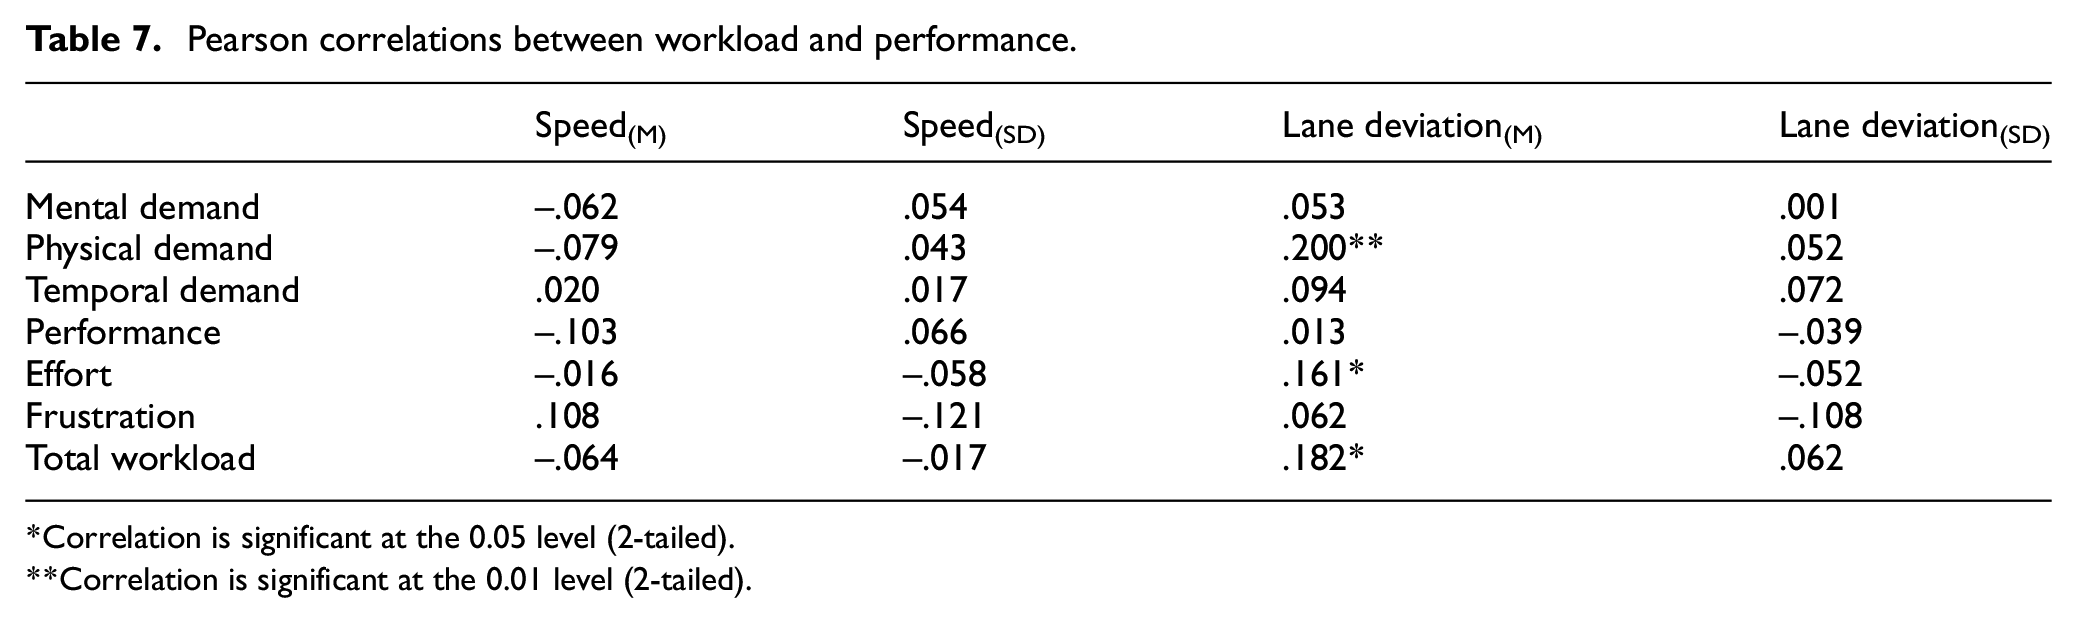
Correlation is significant at the 0.05 level (2-tailed).
Correlation is significant at the 0.01 level (2-tailed).
Conclusion
The simulated driving experiment in this study demonstrated the effects of freeway alignment, slope grade, traffic flow, and sign information on subjective workload and driving performance. The multivariate ANOVA results show that the radius of the horizontal curve significantly influenced the workload score, average speed, and lane deviation. On sharp curves, participants exerted more effort to the driving task and decreased their average speed; however, driving performance still declined, as the mean and standard deviation of lane deviation increased. Although there was no significant correlation between slope grade and subjective workload or performance, the main effects of slope grade on workload and average speed were statistically significant. In this study, the effect of traffic flow was not obvious, because there was no sudden drop in the speed or headway between surrounding vehicles in the simulation scenario under high traffic density. The amount of sign information significantly influenced the drivers’ perceived workload, but not their driving performance. The cognition of traffic sign information occupied mental resources and increased the driving workload. In addition, the relationship between workload and performance was investigated. Although the quantitative relationship between driving workload and performance was not available. Nevertheless, situations where driving performance significantly deteriorated can be singled out based on the variation curve of driving performance under different traffic situations, which can provide reference for the qualitative analysis and evaluation of traffic safety. In summary, maintaining proper traffic sign information, avoiding sharp bend and steep slope combination alignment design were significant for controlling driving workloads and improving traffic safety.
Generally, subjective driving workload increases due to complicated driving conditions, which would certainly lead to driving performance impairment. But, for skilled drivers, if the resources allocated to driving demand exceeded the capacity available at the moment, compensation strategy was usually applied, such as reducing vehicle speed, which may help them achieve better driving performance. In view of the complex relationship between driving performance and workload, future research should focus on compensation driving behavior strategies under different amounts of sign information.
Footnotes
Handling Editor: Hai Xiang Lin
Declaration of conflicting interests
The author(s) declared no potential conflicts of interest with respect to the research, authorship, and/or publication of this article.
Funding
The author(s) disclosed receipt of the following financial support for the research, authorship, and/or publication of this article: The authors acknowledge the support from the National Nature Science Foundation of China (nos 5177051327, 51678460, U1664262 and 71861006), the Natural Science Foundation of Hubei Province, China (ZRMS2017001571), the Excellent Dissertation Cultivation Funds of Wuhan University of Technology (2017-YS-034), and Qilu Transportation Development Group Co, Ltd (2016 B20).