
Abstract
Fatigue damage is one of the most common failure modes of large-scale engineering equipment, especially the full-face tunnel boring machine with characteristics of a thick plate structure bearing strong impact load. It is difficult to predict the location and propagation life of crack of cutterhead under strong impact load. Unseasonal maintenance of equipment caused by inaccurate prediction of life cycle of cutterhead seriously affects the construction efficiency of the equipment and the life safety of the operators. Determining the crack location of tunnel boring machine cutterhead structure under strong impact load and predicting the crack propagation life are difficult scientific problems. To solve them, first, the location of the stress concentration of the cutterhead is determined by using finite element analysis method of statics. Second, prediction model for crack propagation life of tunnel boring machine cutterhead characteristic substructure based on time integration is built. And the test of crack growth of cutterhead characteristic substructure is performed. The feasibility and accuracy of the prediction model are verified by contrasting crack prediction models and the results of the test. Finally, the life prediction of tunnel boring machine cutterhead of water diversion project in Northwest Liaoning Province is carried out by using crack propagation model based on time integration. Results show that the maximum error of theoretical prediction and experimental results of crack propagation is 16%. So the feasibility of crack propagation model based on time integration in predicting the crack growth of cutterhead is verified. It is predicted that the tunnel boring machine cutterhead panel can work normally for 5.9 km under the condition of ultimate load. Building the crack propagation model considering the influence of plate thickness and strong impact load has important research value for improving the working efficiency of engineering equipment, prolonging service time, and improving the working safety.
Keywords
Introduction
Cutterhead located at the front of tunnel boring machine (TBM) is the core component of TBM, and has the function of breaking the rock and stabilizing tunnel face. Because of the complexity of geological conditions and the variability of construction parameters, the working environment of the cutterhead is extremely harsh. Cutterhead is in sharp vibration and easy to damage because of bearing multi-point impact load during breaking rock process. Cutterhead cracking is one of the most important forms of cutterhead failure as engineering examples of Qinling Tunnel, Dahuofang Water Diversion Tunnel, and Zhongtianshan Tunnel show. Crack propagation reduces the strength of the whole cutterhead greatly; leads to the vibration intensification and the failure of the whole equipment, which seriously reduces the construction efficiency; and even threatens the life safety of the front-line constructors. 1 TBM cutterhead welded by several hundred thick plates inevitably has initial defects. This leads to the short crack initiation time, which indicates that the crack propagation life accounts for more than 90% of the whole cutterhead life. So, for the prediction problem of crack propagation life of the thick plate complex structure such as TBM cutterhead, it is generally considered that the crack propagation life is equal to the service life of TBM cutterhead.2,3 However, because of the complex structure of the cutterhead, the traditional crack propagation model cannot be used to predict its life. At the same time, due to the accumulation of manufacturing errors and the influence of processing deformation, it is difficult to locate the initial crack of cutterhead. Therefore, how to quickly and accurately predict the crack location and crack propagation life of TBM cutterhead has important research value for improving TBM work efficiency, prolonging TBM service time, and improving TBM work safety.
TBM cutterhead is mainly composed of the main body of steel structure, cutters, bucket and sprinkler device, and so on. As shown in Figure 1, the diameter of TBM cutterhead is generally between 3 and 15 m. The large diameter cutterhead generally adopts split structure that is joined by bolts and welded together, and the small diameter cutterhead generally adopts integrated structure. The main structure of the cutterhead is formed by welding steel plate. Its front plate is mainly used for balancing the face of the palm, and the back plate is fixed to the inner ring of main bearing through the flange. There are many longitudinal connecting diaphragms between the front and rear plates. The diaphragms are criss-crossed and are mainly used for fixing the seat of the cutter. The front and rear panels are joined by longitudinal connection baffles which are arranged in a criss-cross pattern and used for fixing holder of cutter. The thickness of the cutter plate steel plate is thicker and varies from 50 to 150 mm with the location.

Cracks on TBM cutterhead: (a) cracks on stiffeners and (b) crack on tool box stiffeners.
Generally speaking, the crack tip stress state of a finite thick metal component with defects or cracks, the plane stress state of non-thin plate, is not the plane strain state of an ultra-thick plate, but a complex three-dimensional (3D) stress state. The stress–strain state transition caused by thickness that there are great differences in crack growth characteristics between specimens with different thickness is called thickness effect. In foreign countries, Irwin 4 first used constraint factors to describe the effect of thickness on crack growth, and used constraint factor to modify the crack growth rate model obtained. Subsequently, Newman and colleagues5–7 obtained the relationship between aluminum alloy material crack growth rate and stress intensity factor amplitude under different stress ratios based on experimental methods. From this, it is deduced that the confinement factor of 2.3 mm aluminum alloy is 1.8, and combing the constraint factor with the solution of crack opening ratio can consider the thickness effect in crack propagation. JJ Schubbe 8 studied the effect of thickness change on the crack growth rate of 7050-T7451 aluminum alloy thick plate based on experiments, and the results show that the crack growth of aluminum alloy specimens is sensitive to thickness change. J Garcia-Manrique et al. 9 obtained local opening and closure moment of each crack node and compared with previous results through numerical simulations of both fracture and fatigue of through-thickness straight cracks (CT specimen in mode I); corrections are proposed for numerical methodology to obtain Kop and Kcl distribution along the thickness. A Khanna et al. 10 presented the numerical results of crack tip opening displacement and global constraint factor with various crack length to various plate thickness, and applied stress to yield stress ratios. The new model can be utilized in advanced fracture and fatigue analyses of cracks emanating from a free surface. M Aygul et al. 11 used 3D crack propagation analyses with variable amplitude fatigue loading to investigate the distortion-induced fatigue cracks in the welded details of the Söderström Bridge. JT Burns and J Boselli 12 established the fatigue crack growth rates for 102 and 178 mm plates of 7085-T7451 at R = 0.1 and 0.5 for a wide-range of DK and environments. JR Li et al. 13 proposed the influential mechanism of specimen thickness on acoustic emission (AE) signal and AE source during fatigue crack propagation based on the thickness effect analysis, fatigue behavior studies, and AE investigations. W Sun et al.1,3 modified a small-timescale crack growth model to predict crack growth lifetime of a TBM cutter head based on the plane stress/strain transition condition. PS Yu and colleagues14–16 used the constraint factor to characterize the thickness effect in penetration crack propagation and proposed a crack closure model considering the effect of thickness and stress ratio based on simulation and theoretical deduction. YB Shang et al. 17 studied the effect of out-plane restraint on fracture toughness of the same material specimens, and as sample thickness increasing carried out fracture toughness test under the condition of keeping the in-plane restraint unchanged, the result shows that as the sample thickness increases, fracture toughness increases linearly in a limited range. V Infante and JM Silva 18 presented three case studies based on the numerical determination of the stress intensity factor related with different crack front geometries due to fatigue using ZENCRACK and ABAQUS. ZENCRACK is an advantageous computational tool for obtaining stress intensity factors in the case of particular crack front geometries. JZ Huo et al. 19 modified a small-timescale crack growth model by introducing a plastic constraint factor to change the yield stress value of the material, and the modified model is verified by a fatigue crack growth test of the characteristic substructure. The distortion-induced fatigue cracks in the welded details of the Söderström Bridge are analytically and numerically investigated by performing 3D crack propagation analyses with variable amplitude fatigue loading.
In conclusion, scholars at home and abroad have made some achievements in the research of crack growth mechanism and life prediction, done a great deal of research about 3D crack growth through numerical simulation and experimental analysis, used the effect of restraint factor on crack growth rate and crack opening stress to characterize the thickness effect of crack growth, and proposed some empirical formulas for characterizing thickness effect, which lay a foundation for fatigue life prediction of major engineering equipment under complicated working conditions. But, at present, there is no model that can accurately describe the characteristics of crack propagation at all stages. For large-scale engineering equipment under complex loads, it is still a pressing problem how to deal with the complex load history correctly, analyze the influence of thickness effect of crack propagation on the prediction of crack propagation life at the weak parts of large engineering equipment, and accurately predict the crack propagation life of large complex structures.
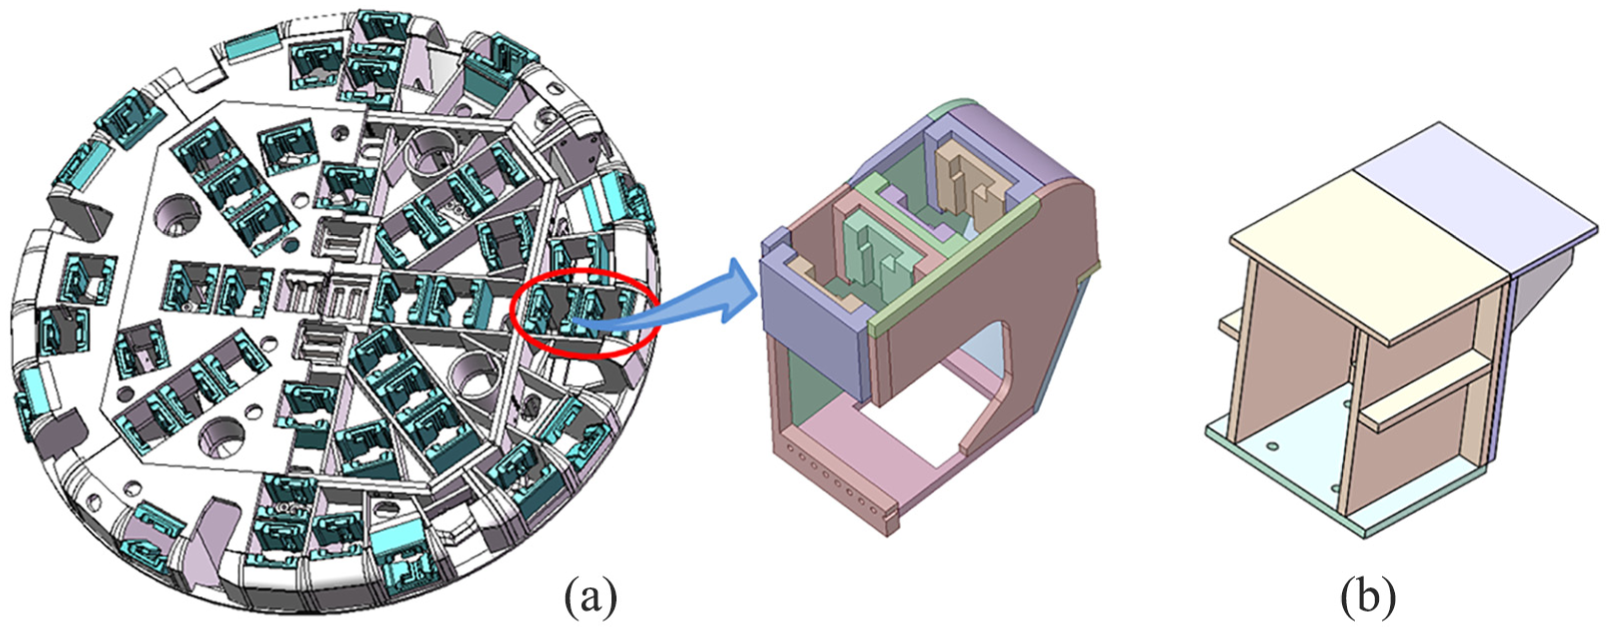
For the difficult problem to predict the damage location and fatigue life of TBM cutterhead, first, the time integration crack growth model considering thick plate effect is built, and the accuracy of this model for prediction of crack propagation in complex thick plate structure is verified by combing with experiment for features of cutterhead structure. Second, the weak part positions of the cutterhead are obtained by combining the static and transient dynamics results with the actual engineering statistics, the dynamic stress of the cutterhead weak part is calculated based on the improved quasi-static method, and a time integral crack growth model for the weak part of the cutterhead is established. Finally, according to TBM cutterhead structure of the actual engineering application, the crack propagation life of the weak parts of the cutterhead is predicted using the established method and the corresponding model parameters (Figure 2).

Structure of cutterhead: (a) TBM cutterhead and (b) component of cutterhead.
Materials and methods
Based on the crack opening displacement and the instantaneous increment of crack growth, a crack propagation model is established. According to the correction of forward plastic zone and reverse plastic zone of crack front, the threshold of crack propagation is obtained. Based on plate thickness effect, the constraint factor is added and the threshold is corrected. The time integration model of crack growth of TBM cutter characteristic substructure considering thickness is built. Through the fatigue test of cutter characteristic substructure sample, the time-integration crack fatigue growth model of cutterhead substructure considering thickness effect is validated. The weak position of the TBM cutterhead is obtained by combining the field crack measurement and the stress and strain results of cutterhead obtained by using statics and transient dynamics analysis method. The dynamic stress of the cutterhead weak part is calculated by the improved quasi-static method, a time integral crack growth model for the cutterhead weak part is established, and the crack growth life of the cutterhead weak part is predicted (Figure 3).

Process of TBM cutterhead crack propagation life prediction with time integration method.
Theoretical prediction model of time integration crack propagation
Due to the thick plate effect at the leading edge of crack, the plastic flow at the tip of fatigue crack is limited, which results in a significant difference in the stress state at the crack tip. As shown in Figure 4(a) below, the stress state of crack front includes plane stress state, plane strain state, and transition state, which results in different stress magnitude of crack front.
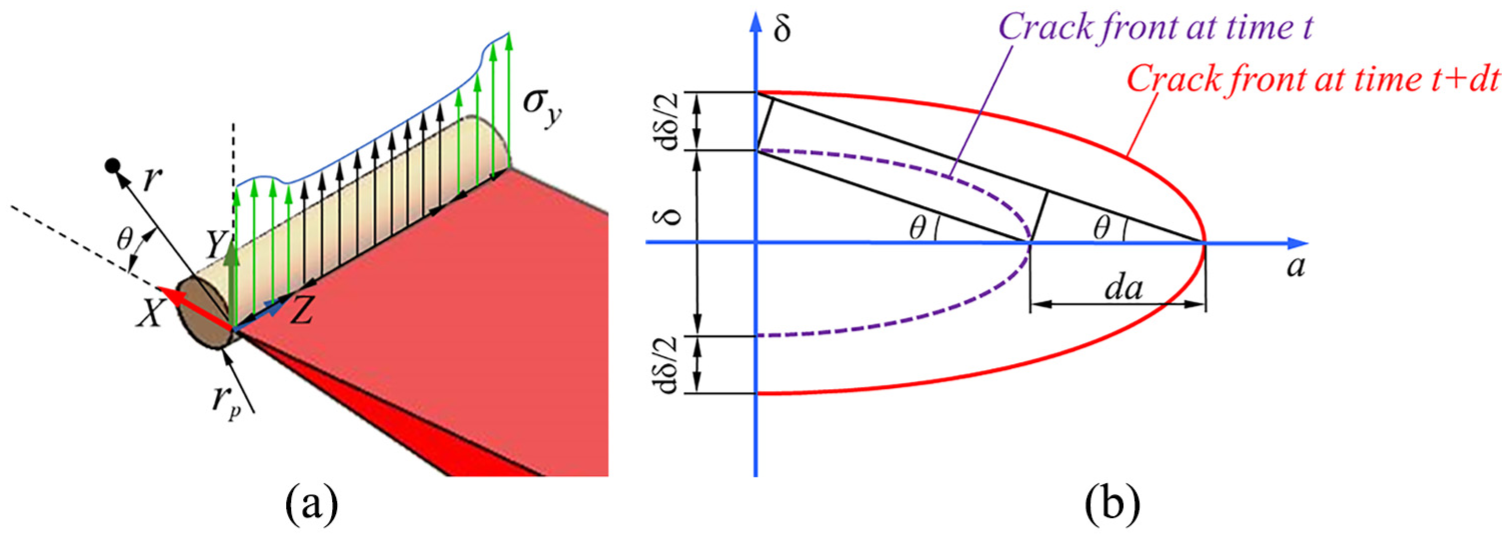
Crack propagation model: (a) stress field of crack front and (b) schematic diagram of crack tip expansion. 20
Based on time-integration surface fatigue crack growth model proposed by ZZ Lu and YM Liu 20 from Clarkson University, the fatigue crack tip growth diagram at any time and at any crack length under constant amplitude loading is shown in Figure 4(b).
In Figure 4(b), the dashed line is the crack front at time t, the solid line is the crack leading edge at time t + dt, da is the length of crack propagation under cyclic loading, dδ/2 is the length of crack opening (CTOD), θ is the crack opening angle (CTOA), and the values of θ are equal at time t and time t + dt. From the geometric relation of Figure 4(b), we can get the following formula

Based on a modified Dugdale strip yield model proposed by Liu et al. 21 the crack opening displacement under plane stress is


where E is the elastic modulus, σy is the yield strength of material, δmin,m is the crack opening displacement after the mth stress cycles unloaded; δmax,m is the crack opening displacement after the mth stress cycles loaded; σ is the nominal stress value of the (m + 1)-th stress cycle; σmin,m is the minimum stress of the mth cycle; σmax,m is the maximum stress of mth cycle; a is the crack length under the current load cycle; and σref,m is the threshold of fatigue crack propagation under the action of the mth stress cycle.
The leading edge of the crack tip under variable amplitude loading is shown in Figure 5 below; there are forward plastic zones and reverse plastic zones at the leading edge of the crack tip. During cyclic loading, it is assumed that the amplitude of load changes when the crack length is aol. The size of the reverse plastic zone produced during the previous cyclic is Δrp,ol. Under current loading, the initial crack length is a and the forward plastic length is rf. Under the current loading condition, the condition for crack propagation is
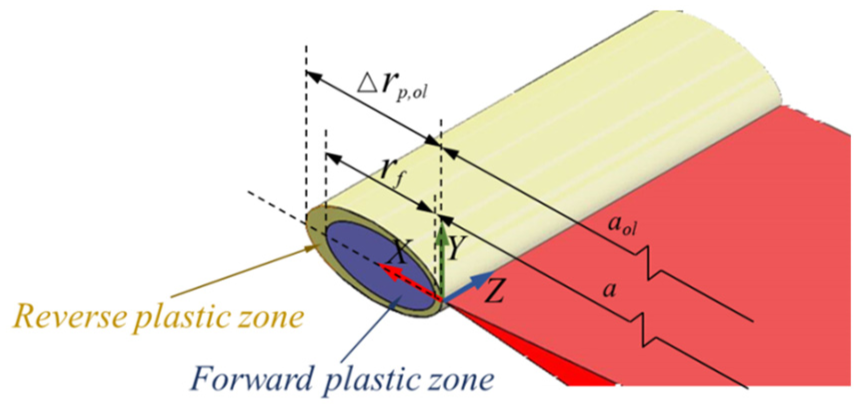
Plastic zone of crack tip under variable amplitude load. 20
For thick plate structure, the stress under thickness effect is different, which results in the plastic zone size at the crack tip being different in the thickness direction. Therefore, the restraint factor alpha is introduced to modify the different stresses in the thickness direction, so the effective yield stress of thick plate can be obtained ασy, where


The corresponding crack propagation threshold is

Considering the crack tip passivation effect caused by the variable amplitude load, the threshold stress correction factor η is introduced to correct the crack propagation threshold when the crack propagation threshold is solved

where η is the threshold correction factor, and the values of the threshold correction factors for different materials are different, generally between 1.3 and 1.6. σeqref is the modified equivalent crack propagation threshold.
In the process of cyclic loading, the differentiation of the crack opening displacement δ of the loading section is as follows
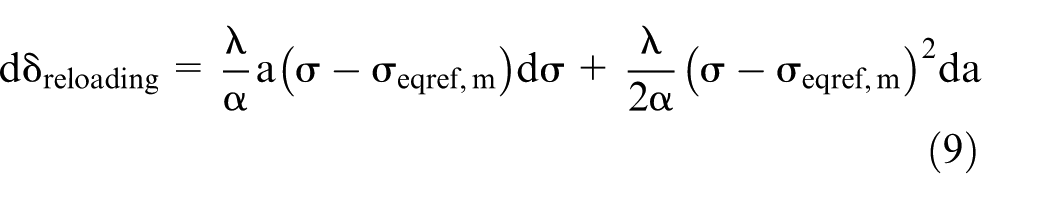
The crack opening displacement formula is obtained by deriving the time t on both sides

When the internal stress of a cycle changes from σmin to σmax, the crack length is extended from a0 to a0 + Δa under the variable amplitude load. Due to the existence of the crack closure effect, the crack propagates only when the stress σ is larger than the crack propagation effective threshold σeqref,m in the current cycle. For the above formula, the crack propagation length under arbitrary load can be obtained
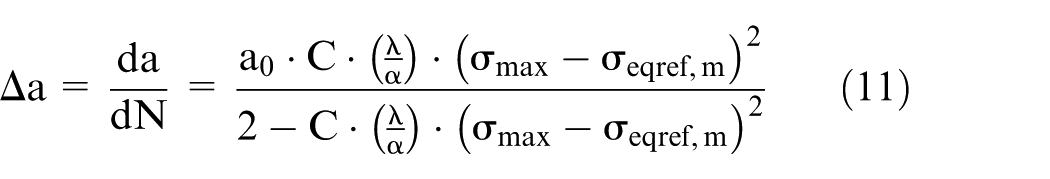
Based on the constraint factor and the threshold correction factor, a crack propagation length calculation model for thick plate structures under arbitrary loads is established considering the stress ratio and crack closure effect.
Validation of crack propagation model based on compact tensile test
Time integration method for crack propagation prediction
The dynamic stress at the crack tip of CT specimen is calculated by quasi-static method. The relationship between the crack growth dynamic stress and the crack propagation length of 10 mm thick CT specimen is as follows

where σ(t) is the crack growth dynamic stress and a0 is the crack length.
The constraint factors can be calculated by using Yu and Guo15,16 model


The material of the CT experimental sample is Q345D. The thickness of the sample is 10 mm, the crack opening angle is 11.5°, and the threshold correction factor is 1.6. The crack growth curve of CT specimens can be obtained by applying the parameters into the established time integral model.
Traditional method for crack propagation prediction
Stress intensity factor amplitude is an important parameter in the fatigue crack growth process, and it is the key to calculate the crack growth rate when using the traditional crack growth model. In order to study the 3D crack growth law of thick plates, first, the crack growth of compact tensile specimens was analyzed by Zencrack software, and the stress intensity factor amplitude at the crack tip was extracted during 3D crack growth. Then, the extracted stress intensity factor amplitude is introduced into Elber model, 22 Newman model, 23 and Guo model 24 to predict the fatigue crack growth life of C(T) specimens. Finally, the correctness of the time-integrated crack growth model is verified by comparing the results of the time-integrated crack growth model with those of the traditional crack growth models.
Stress intensity factor amplitude calculation
First, the HyperMesh software is used to divide the grid. Solid185 is used as the unit. There are 17,645 units and 22,152 nodes in the model, as shown in Figure 6 below. Second, the crack-block technique is used in Zencrack to prefabricate the initial crack and replace the mesh in the initial stage of crack growth; crack-block technology can automatically match the surrounding mesh and modify the surrounding mesh during the initial crack, simulate crack propagation process, and eliminate the discontinuity of the geometric model through adaptive mesh technology, as shown in Figure 6 below. The stress intensity factor at r near the crack tip is obtained by finite element method. Finally, the stress intensity curve near the crack tip is obtained by the least square method through linear regression, and the stress intensity factor at the crack tip is obtained by extrapolation method.

Finite element mesh of CT specimen.
In the model, the initial crack length is set to 2 mm. Tensile force is applied to one loading hole and fixed constraint is applied to the other loading hole. The loading amplitude is 14 kN, the average load is 13 kN, and the load ratio R is 0.3. The material properties of the specimens are shown in the Table 1 below.
Material parameters of CT specimen.

The curve of stress intensity factor range and crack growth length is shown in Figure 7.
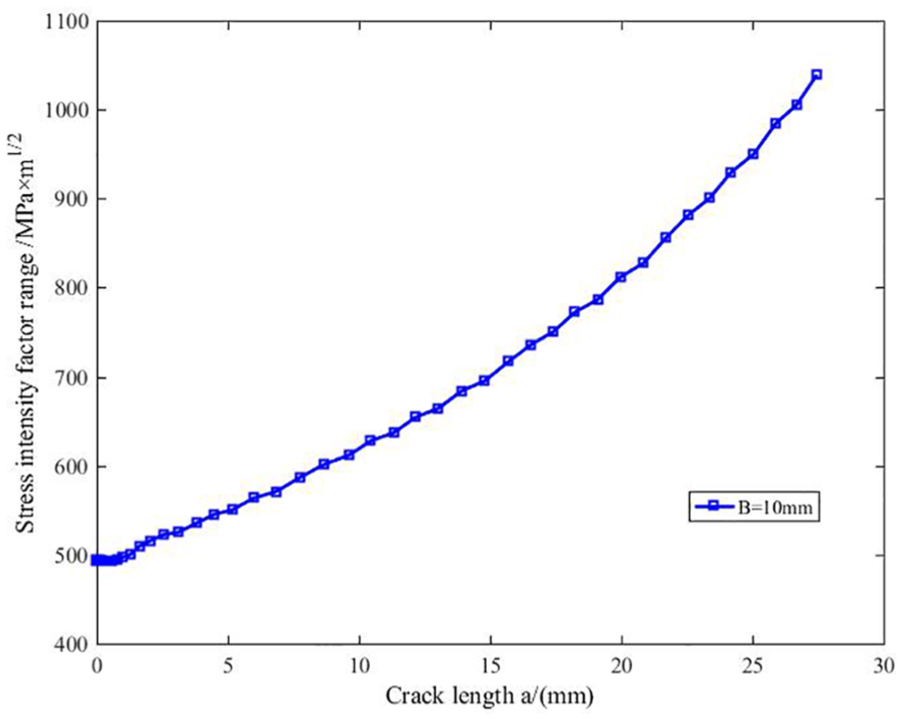
Stress intensity factor range for crack length.
The expression of the stress intensity factor amplitude ΔK and the crack length a is expressed by the least square method

where c1 = 0.011, c2 = 0.014, c3 = 12, and c4 = 490.
Elber model, Newman model, and Guo model are used to calculate the crack growth life of compact tensile specimens.
Weak part and characteristic substructure of cutterhead
Static analysis of cutterhead
External load
In this article, we use the maximum thrust condition under rated tunneling condition to carry out the static analysis of the cutterhead. Under the maximum thrust condition, the cutter is subjected to the ultimate load, and the axial load of the cutterhead is the largest. When the maximum thrust condition is applied, the vertical force of the cutter is 300 kN, the lateral force is 30 kN, and the rolling force is 45 kN.25–27
Finite element analysis of cutterhead
First, the cutterhead is meshed with different mesh sizes, and the sampling points are set. By analyzing the finite element results of sampling points, the mesh convergence analysis of the cutterhead is carried out. The optimal size of the cutterhead mesh is determined to be 50 mm, which can ensure the accuracy of the finite element analysis. Second, according to the load of the cutter under the maximum thrust condition, the flange of the cutter head is fixed, the three loads of the cutters are loaded on the seat, and the maximum equivalent stress position of the front panel of the cutterhead is obtained as shown in Figure 8. We can see that the maximum stress position on the front panel of the cutterhead appears on the edge of the cutter seat.

Static analysis result of TBM cutterhead.
Characteristic substructure of cutterhead
In this article, the main interface between edge body and center block of TBM cutterhead and the structure of cutter base are selected as characteristic substructure fatigue crack growth samples from the overall structure of TBM cutterhead, and the fatigue crack growth test is developed, as shown in the Figure 9.
Characteristic substructure of TBM cutterhead: (a) cutterhead feature substructure and (b) simplification model.
Cutterhead substructure experimental prototype
The experimental specimen is scale model welded by several plates, the concrete structure of which is shown in ① and ④ of Figure 10, where the panel is at the top, the thickness is 20 mm, and the material is Q345 steel which is the same as the that of actual cutterhead. The bottom seat is located at the bottom, the material of which is Q235 carbon structural steel. Four U-grooves are symmetrically arranged on the bottom seat, which is cut by numerical control flame cutting machine. The sample and the base are fixed by M16 bolts, and the base is fixed with the bottom matrix by the anchor bolts. Sample entity of the TBM cutter panel feature is shown in ③ of Figure 10. Using the special milling cutter, the initial incision of 40 mm long and 4 mm deep shown in ②, ③, and ⑤ of Figure 10 is prefabricated on the typical structural panel of TBM cutterhead. The processing and assembly process of the whole sample is as follows: ingredients, steel plate cutting, welding groove prefabrication, welding, heat treatment, sand blasting, surface treatment, and spraying primer.

Crack propagation experimental specimen of cutterhead characteristic substructure.
Experimental equipment
The fatigue experiment and testing equipment of cutterhead characteristic substructure are mainly composed of two sets of electro-hydraulic servo actuator, one computer and control system, one loading frame, one crack depth tester, and one phased array ultrasonic detector (Figure 11). The portal loading frame is fixed on the ground base by bolts. One end of the actuator is bolted to the crossbeam of the portal loading frame. The other end of the actuator applies a load to the sample through the loading head. Electro-hydraulic servo actuator is adapted in the main joint surface of the TBM cutterhead and the position of the cutter seat. Two electro-hydraulic servo actuators are used to simulate the axial force acting on the joint surface and the vertical force acting on the cutter seat.

Characteristic sample fatigue experiment system: (a) fatigue experiment equipment, (b) electro-hydraulic servo actuator, (c) dSPACE control system, (d) portal loading frame, (e) crack depth tester RMG4015, and (f) phased array ultrasonic detector.
Characteristic substructure crack growth test of cutterhead panel under variable amplitude loading
According to the statistics of cutter load and frequency,21,22 the load frequencies of each cutter are relatively consistent, mainly concentrated in 0–5 Hz, with typical low-frequency characteristics. In order to facilitate the experimental study, the load applied on the characteristic sample is simplified. The loading frequency is 2 Hz, the peak load is 220 kN, the high- and low-load amplitudes are 96 kN and 48 kN, respectively, and the average load value is 124 kN. The load step contains N = 50,000 high-amplitude cyclic loads and n = 10,000 low-amplitude cyclic loads. The three load steps constitute a complete load, with a total of 180,000 cycle loads. During the experiment, the depth of crack propagation is monitored by phased array and crack detector. When the crack is measured, the machine is stopped but not unloaded, and the number of fatigue cycles and the crack extension size data are recorded.
Fatigue prediction of characteristic substructure of TBM cutterhead panel
Dynamic stress calculation based on quasi-static method
The quasi-static method is used to calculate the dynamic stress of TBM cutterhead feature sample. First, the finite element method is used to analyze the static characteristics of TBM cutterhead; when the static load F is applied at both ends of the cutter characteristic model, the stress at the bottom of the trapezoidal trough is obtained. Then, the depth of the model is deepened, the finite element analysis method is used for continuous analysis, the transverse tension stress σ at the bottom of the groove is continuously extracted, the unit transverse tension stress σ/F is calculated, and the curve of the transverse tension stress σ/F with depth x is fitted. Finally, the fitting relationship is multiplied by the corresponding time history of external load, and the nominal dynamic stress of fatigue crack propagation is obtained by summing it up. The formula is as follows

where σ(t) is the stress time history of driving crack growth; Fk is the kth static load loaded onto the specimen; pk(t) is the load history at the same position as Fk; and σk is the stress value caused by the kth static load.
Based on the quasi-static method mentioned above and the external load history, the nominal dynamic stresses at the crack tip under high-load amplitude and low-load amplitude are fitted as follows
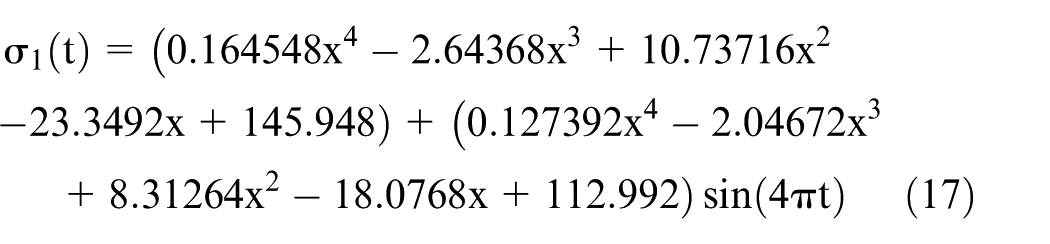

where σ1(t) is the dynamic stress when loading p1(t); σ2(t) is the dynamic stress when loading p2(t); x is the depth of crack growth, and the depth at the tip of the prefabricated crack is 0.
Fatigue life prediction of characteristic substructure of cutterhead panel
Because the crack propagation direction is along the depth direction, the crack thickness is equal to the width of the plate, that is, the crack thickness is very long, so the constraint factor is approximately 2.5, 19 and the material is Q345D; therefore, the crack opening angle is 11.5°. The related parameters are brought into the established time-integrated cutterhead panel crack growth model, and the fatigue crack growth life of TBM characteristic sample is calculated. The theoretical relationship curve between the crack growth depth of cutterhead characteristic component and the number of load cycles is obtained.
Fatigue prediction of TBM cutterhead panel
First, the stress of cutterhead and the weak position of TBM cutterhead are obtained by static finite element analysis. Second, the dynamic stress of the weak part of the cutterhead is calculated based on the improved quasi-static method. Finally, a time integration crack growth model for the weak position of the cutterhead is established and the crack growth life of the weak position of the cutterhead is predicted.
For the dynamic stress solution of cutterhead, which is different from the general quasi-static method, it is necessary to consider the inertia force produced by the acceleration of cutterhead tunneling. According to the improved quasi-static method, 19 the equation for calculating the dynamic stress of the cutterhead is as follows

In view of the weak position of the upper edge block of the cutterhead determined in the static analysis, the stress of the joint under the unit load of each cutter is extracted based on the finite element simulation.
Based on the stress results, the load history of each cutter and the acceleration of the cutterhead are substituted into the nominal dynamic stress formula of fatigue crack growth, and then, the dynamic stress of the weak position of the cutterhead is obtained. The dynamic stress is applied to the crack propagation model to calculate the crack propagation life.
Results
Prediction results for different crack growth models
Based on the Zencrack 3D crack propagation simulation software, the fatigue crack growth simulation of 10 mm C(T) specimen is carried out. Based on the simulated stress intensity factor amplitude of C(T) specimens, the theoretical life of C(T) specimens crack propagation is solved by combining Elber model, Newman model, and Guo model. As a comparison, the time integral crack growth model considering the thickness effect is used to predict the fatigue life of 10 mm thick compact tensile specimens. We also performed a fatigue extension test of a compact tensile specimen with a thickness of 10 mm on another fatigue test bench. 19 Through the crack life expansion curve, it is not difficult to find that the prediction results of the crack extension prediction model based on time integral are more accurate than the traditional fracture mechanics model for fatigue life prediction. The specific details are shown in Figure 12.

Theoretical prediction and experimental results of crack propagation.
Experimental and prediction results of crack growth in cutterhead feature subsample
Phased array and crack detector were used to measure the crack length in depth direction in fatigue loading test of TBM cutterhead characteristic sample. The crack growth length in depth direction under different number of cycles was obtained as shown in Figure 13.

Comparison between theoretical prediction and experimental data.
As can be seen from Figure 13 above, after about 180,000 cycles, the crack depth direction growth reaches 11.2 mm. The crack depth direction growth rate and the number of cycles are not showing a trend of gradual acceleration. The depth direction crack growth increases with the increase of cycles at the initial stage of crack growth. With the increase of crack length, the crack growth obviously slows down.
When the crack propagates along the depth direction, the length of the thickness direction is longer, the constraint factor α can be approximated to 2.5, the cutterhead material is Q345D, and the crack opening angle is 11.5°; the parameters are brought into the time integration crack growth model considering the thickness effect, the fatigue crack growth life of the feature sample is predicted, and the theoretical relationship curve between the crack growth depth and the number of load cycles is obtained, as shown in Figure 13.
As can be seen from Figure 13, overall, the crack growth rate of the feature sample of TBM cutterhead panel increases gradually at first, then keeps steady, and finally decreases gradually. In the initial stage of crack growth, the crack growth rate increases gradually under the first 50,000 high-amplitude cyclic loads in the first load step cycle and is almost 0 under the last 10,000 low-amplitude cyclic loads in the first load step cycle. In the middle stage of crack growth, under the first 50,000 high-amplitude cyclic loads in the second load step cycle, the crack growth rate keeps stable basically, and decreases to a certain extent in the later stage, reaching the stage of stable growth. Under the last 10,000 low-amplitude cyclic loads in the second load step, the crack growth rate is almost 0. At the later stage of crack growth, the crack growth rate gradually decreases in the third load step cycles.
Discussion
Comparison of prediction results for different crack growth models
As shown in the Figure 12, the prediction results of the Elber model are quite different from the experimental results. As shown in the Figure 12, compared with the measured results, the predicted results of Elber model show that the crack propagation speed is faster and the difference is large. This is because the Elber model takes into account the effect of crack closure. However, when the crack opening ratio is fitted, the crack opening ratio obtained is mainly for thin plate specimens, and the effect of thickness on the crack opening ratio is not considered. Therefore, the crack opening ratio calculated is larger, which leads to the prediction result of crack growth deviating greatly from the reality. The Newman model, the Guo model, and the time integral crack propagation model agree well with the experimental results. The predicted results of Newman and Guo models are similar, and the predicted results are in good agreement with the experimental results at the initial stage of crack propagation. When the number of load cycles is less than 7 × 10⁴, the predicted expansion speed is greater than the experimental expansion speed. But as the crack propagation length increases, the crack theoretical expansion rate decreases, and when the number of load cycles exceeds 7 × 10⁴, the predicted expansion speed is less than the experimental expansion speed. At the same time, with the increase of the crack propagation length, the theoretical prediction of the crack growth rate and the measured expansion rate are quite different. The time-integrated crack propagation model shows good agreement with the experimental results in crack propagation, and the difference between the extended prediction result and the measured result is the smallest. The measured expansion speed is larger than the theoretical prediction expansion speed, but the phase difference is not large. Therefore, the time integral crack propagation model under the constant amplitude load is reasonable.
Comparison between TBM characteristic substructure fatigue test and theoretical life prediction
Under the action of high- and low-amplitude load, crack growth shows a certain trend of step growth.
As shown in Figure 13, in the first 50,000 high-amplitude load cycles, the predicted results of the time integration crack theory model considering thickness effect are in good agreement with the experimental results. Since then, it has entered a low-amplitude cycle; there is a certain difference between the time-integration theory model and the experimental results. Under the theoretical prediction, the crack growth is small. In the experiment, the crack growth is 1 mm, and the error increases. The maximum error occurs when the cycle is 60,000 times, and the error is about 16%. The actual expansion speed is greater than the theoretical prediction speed. Because, in the theoretical prediction, the stress value under the low-amplitude load is lower than the crack growth threshold, the crack growth is slow. After entering the high-amplitude load cycle again, the crack growth prediction model has a faster expansion rate than the measured crack, but the expansion rate remains constant and is in a stable expansion stage. When the load cycle reaches 120,000 times, the theoretical predicted growth speed is similar to the measured crack growth speed, the actual growth speed is faster, the error is less than 10%, and the theoretical predicted and actual growth speed are smaller. This is because the characteristic substructure of the cutterhead has stiffened plate, which inhibits the expansion of the crack. Generally speaking, the time integration crack growth model considering thickness effect is more accurate than that under plane stress.
Prediction of crack growth life of cutterhead panel based on time integration method
For the TBM cutterhead, the fatigue growth life can be predicted by mastering the law of crack growth. Accurately predicting the fatigue life of the cutterhead can prompt engineers to repair in time, avoiding further damage and economic losses. For TBM cutterhead panels, the thickness is generally above 70 mm, because the thickness is much larger than the critical thickness of the plane strain state. In this article, KIC in plane strain state is chosen, that is, fracture toughness in plane strain state. The critical crack of TBM cutterhead can be obtained from crack instability growth criterion of fracture mechanics
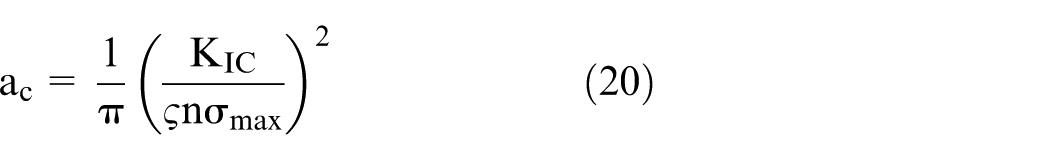
where n is the safety factor, usually 2; KIC = 198.3 MPa mm1/2; and σmax is the ultimate stress that the TBM cutterhead can withstand. It is known from the literature 3 that σmax is 236 MPa; ζ is the fatigue crack shape factor, and its value is 1; calculated ac = 56.2 mm.
TBM cutterhead plate thickness is generally 70–90 mm. Through the measurement of the damage condition of the used cutterhead, the crack depth of the cutterhead panel is basically about 40–60 mm, so the critical crack depth is determined by 56.2 mm.
Based on the time integral fatigue crack growth life prediction model, stress time history of weak parts, crack opening angle of Q345D material, and critical crack depth and other parameters, the crack growth life of the panel in the upper block of TBM cutterhead is calculated to be 6,326,524 cycles. The average rotational speed of the cutterhead is 5.6 r/min and the penetration rate is 5 mm/r, and the calculation shows that the tunneling process is about 5.9 km. This life does not represent the life of TBM cutterhead when it is completely damaged everywhere. It indicates the life of cracks in dangerous positions of the cutterhead when the cutter load is the maximum working load and the crack extends to a certain depth. Finally, we make a statistical analysis of the service life of the actual cutterhead in engineering. It is found that after 6 km of cutterhead tunneling, the panel of cutterhead edge block does not break, which proves that the prediction model of cutterhead panel crack can be used to predict the service life.
Conclusion
In this article, a crack growth model for the characteristic substructure of TBM cutterhead panel is established based on the time integration method, aiming at the TBM cutterhead panel in engineering. The prediction model is validated by the crack growth experiment of the characteristic substructure of the TBM cutterhead panel. The maximum error between the theoretical prediction and the experimental results is 16% in 180,000 cycles, which proves the correctness of the theoretical model. Based on the finite element simulation, the weak position of the TBM cutterhead panel in the northwestern Liaoning diversion project is located on the edge block. Life prediction of crack growth at weak position of TBM cutterhead panel is done by using time integration crack growth model. The results show that the predicted tunneling distance of TBM cutterhead panel is 5.9 km under the ultimate load condition, and the field test results prove that the prediction model can be used for the prediction of the cutterhead life. Considering the influence of panel thickness and strong impulsive load, the crack growth model of TBM cutterhead panel under variable amplitude load is established. It has important research value to predict the service life of engineering equipment accurately so as to guide the maintenance and safety inspection of cutterhead panel, and to improve the safety of work.
Footnotes
Handling Editor: James Baldwin
Declaration of conflicting interests
The author(s) declared no potential conflicts of interest with respect to the research, authorship, and/or publication of this article.
Funding
The author(s) disclosed receipt of the following financial support for the research, authorship, and/or publication of this article: This work was supported by the National Key R&D Program of China (No. 2018YFB1306701), 973 Program (No. 2015CB058100), National Natural Science Foundation of China (No. 51875076), and NSFC-Liaoning United Key Fund (No. U1708255).