
Abstract
In this article, a feasible mathematical method was proposed to describe the instantaneous shear flow behavior of the incompressible and isothermal thermoplastic materials. Based on the molecular kinetics, thermodynamics, and continuum mechanics method, a viscoelastic model was presented about the intricate rheological phenomena of polymer macromolecules, which is simplified as the generalized Newton’s law. The rheological experiments were carried out with the isotactic polypropylene material. The analysis of variance method was performed to determine the fitness of the model. By comparing with the Ostwald–de Waele power law model and Cross model, the theoretical model was studied. The experimental results reveal that the theoretical model is more accurate than the Ostwald–de Waele power law model and shows a roughly equivalent fitness with the Cross model, which indicates that the theoretical model is effective and robust. Moreover, the results of this study may have potential industrial applications and benefit the users of certain plastic components.
Introduction
As viscoelastic materials, polymers exhibit a rich variety of nonlinear flow phenomena. Nonlinear flow behaviors of these polymers depend on how the chain entanglement responds to external deformation. 1 The mathematical explanation of a viscoelastic fluid is much more complex than its Newtonian counterparts, and a theoretical understanding of their equilibrium and nonequilibrium rheological behavior has been a goal of polymer science for many decades.2,3 Usually, there are two methods to describe flow behavior of a rheologically complex fluid: continuum mechanics and molecular method. Considering the material as a continuum, stress–strain relationships can be calculated by mathematical equations based on the theories of continuum mechanics. In these fields, rheological properties consisting of variation in viscosity with shear rates were studied by many researchers.4–7 For instance, the Ostwald–de Waele power law model, Bird–Carreau model, and Cross model are among the most preferred pure rheological models8,9 due to their ability to predict velocity and pressure distribution in uniform flows in addition to their simple representation of shear thinning behavior. The Maxwell model and the Kelvin–Voigt model are two commonly used linear viscoelastic models, 10 which are constructed by a spring and a dashpot in series and in parallel, respectively. Other types of nonlinear viscoelastic models, such as the upper-covered Maxwell (UCM) model, 11 Phan-Thien–Tanner (PTT) model, 12 Johnson–Segalman model, 13 Giesekus model, 14 Oldroyd-B Model, 15 and K-BKZ model, 16 have also been used to provide robust predictions in the case of polymer materials. These types of constitutive equations have been widely used in numerous studies on predicting the rheological behavior of viscoelastic materials. Especially the K-BKZ type of constitutive equation, which has been widely used in research works and industrial applications.
Compared with the phenomenological method, the molecular kinetic approach is regarded as an ideal way for characterizing the flow behavior in dilute and concentrated solution system. In this field, the simplest nonlinear kinetic theory of a dilute polymer solution is known as the finitely extensible nonlinear elastic (FENE) dumbbell model. 17 The simplest tube model of entangled linear polymer melts is the classical Doi–Edwards model, 18 where the reputation was described as a single relaxation mechanism, and the dynamics of individual tube segments are decoupled. Constraint release (thermal or convective), tube stretch, and contour length fluctuations are ignored. The CONNFFESSIT (Calculation of Non-Newtonian Fluid: Finite Element and Stochastic Simulation Techniques) method, 19 as another kinetic molecular theory, is the first implementation of the stochastic approach. Some of these approaches have previously been used to well solve the engineering problems in practice. However, such molecule-based equations can only yield quantitative information on the distribution of polymer conformations within a macroscopic fluid element in the form of averaged quantities.
From the previous research work, 20 a modest pseudo-high-elastic model was proposed to describe the instantaneous flow-induced orientation behavior of polymer macromolecules with the incompressible and isothermal assumptions. The model was studied based on the thermodynamics, statistical mechanics, and continuum mechanics using the kinetic molecular theory and the necessary simplification and hypothesis. Progressively, the compressible property of polymer melts was considered, and another pseudo high-elastic model of the orientation–stress relation was elucidated based on the entropy–elastic deformation theory. 21
The aim of this article is to present a plausible theoretical model under the incompressible and isothermal assumptions, which can expound the transitional simple shear flow behavior of thermoplastic polymer materials. For this purpose, a feasible viscoelastic model was proposed to describe the shear flow behavior of the thermoplastic polymer using the analogy method. Rheological experiments were designed with isotactic polypropylene (PP) material to verify the fitness and effectiveness of the model, by comparing with the Ostwald–de Waele power law model and Cross model.
Theoretical modeling
As mentioned above, a mathematical model was deduced in previous publication 20 to describe the relationship between transitional flow stress and molecule deformation under the incompressible and isothermal conditions. In that publication, the polymer melts were represented as a mass of continuum macromolecular chains. The shear viscosity was overlooked, and the temperature variation was ignored. Each molecule was simplified as a coarse-grained bead–spring chain which was surrounded and tangled with others. It was also considered to be an ideal chain as a three-dimensional random walk in which each step may be a different length and the step lengths correspond to the statistical segments of the polymer chain. Using the physical model to describe the instantaneous flowing conformation evaluation, the complex flow pattern of the macromolecule was reduced to be a simple vector field. The statistical mechanics method was used by assuming a structure of randomly oriented long macromolecular chains. In Gaussian treatment, 22 the distribution of the end to end vector (ETE), r, of a chain is given by p(r)

where n represents the number of links in the chain and l is the length of each link. The average initial chain length, L0, is given by the root mean square value of r

Usually, the polymer chain would stretch to accommodate the deformation under shear condition. The stretching of the chain reduces the number of possible configurations it can take, and the configurational entropy would decrease. Calculating the entropy value of the chain at different time, the transient decrement in the entropy of a single chain after a unit of time
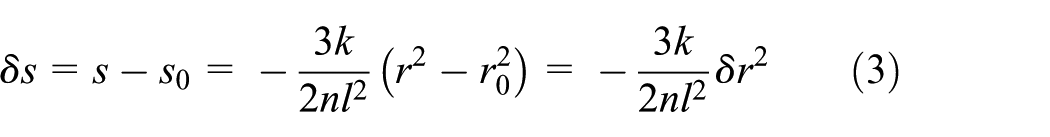
where
Calculating the internal energy change of the polymer at different time based on the first law of the thermodynamics, the deformation stress corresponding to the macromolecular conformation was obtained as

where
In addition, the conformation stress of any polymer element was calculated using continuum mechanics. It was also represented as a three integral expression, conveniently expressed in the mathematical form

where f and σij (i = 1,2,3; j = 1,2,3) represent the deformation force and deformation stress of the element, respectively;
Then, the instantaneous deformation stress of the polymer element was deduced and rearranged as follows

Now, it was considered that there is a group of polymer chains as an element which contains a number of monomer. Theoretically, the deformation stress of the polymer element corresponding to the conformation can also be deduced as follows
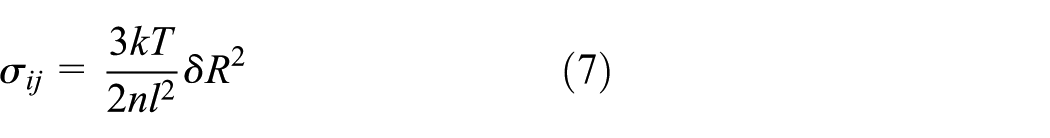
where R is the ETE of the element which can be derived by the vector superposition method.
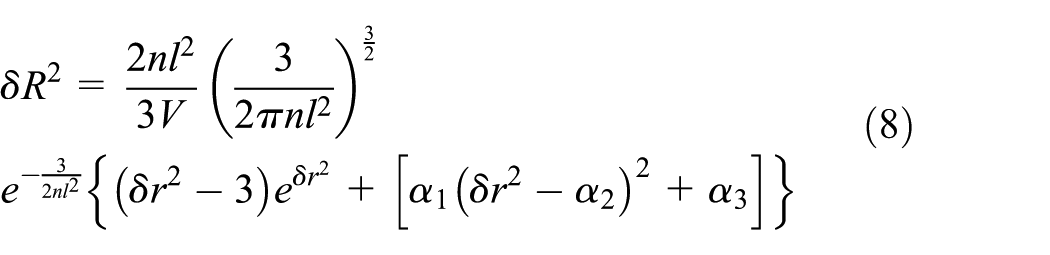
Normally, it is obvious that there is some proportional relationship between ETE of the molecular monomer and element based on the affine motion hypothesis, 23 so it is reasonable to regard this equation as the expression of the polymer element, that is

Now, suppose a Cartesian coordinate system to be fixed in space. There are always three principal stresses and principal stress directions of the polymer microelement, in which only the positive strains are presented and the shear strains are zero. If we give the components of strain tensors in an arbitrary orthonormal coordinate system, their directions are confined to the principal axes of strains. According to the assumption of affine motion as well as the strain tensor theory, σij was deduced as follows

where
Furthermore, the hyperelastic model, named as eight-chain macromolecular network model,
24
was used to specify the geometric distribution of the molecules in element. This model incorporates a locking stretch for large deformations via Langevin statistics. It is regarded as a unit cube with polymer chains of length

where b1, b2, b3, and b4 are constants of the polymer materials.
Then, we relax assumptions that the coefficient term on the right side of equation (11) is the generalized relaxation coefficient of polymer; this model can also be simplified as the generalized Newton’s law.
This model provides an instantaneous viscoelastic relationship between the deformation stress-and-strain ratio tensor of polymer materials. It is deduced from the molecular kinetic, thermodynamics, and continuous medium mechanics method.
The integral form of this theoretical model is shown as follows

If


where t is the current time,

This integral formula of the theoretical model is coincident with one of the widely used constitutive equations for viscoelastic materials, which is derived from Boltzmann’s superposition principle. 25
Nevertheless, this theoretical model gives a relatively sophisticated expression, which is disadvantageous to the decrease of calculation, so it is necessary to further simplify. Taking into account the material characteristics, only the configuration change of the polymer in shear flow was considered here, and the variation of the chain length was ignored. The number of links n and the length of each link l were degenerated into constants, and
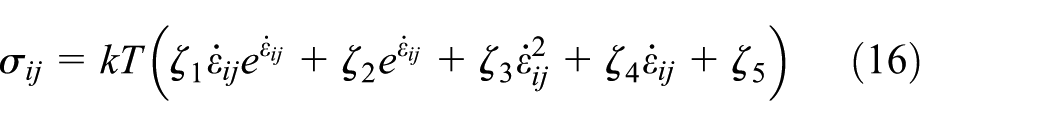
where
In simple shear flow, it was rewritten in a simplified version

where
Experimental setup
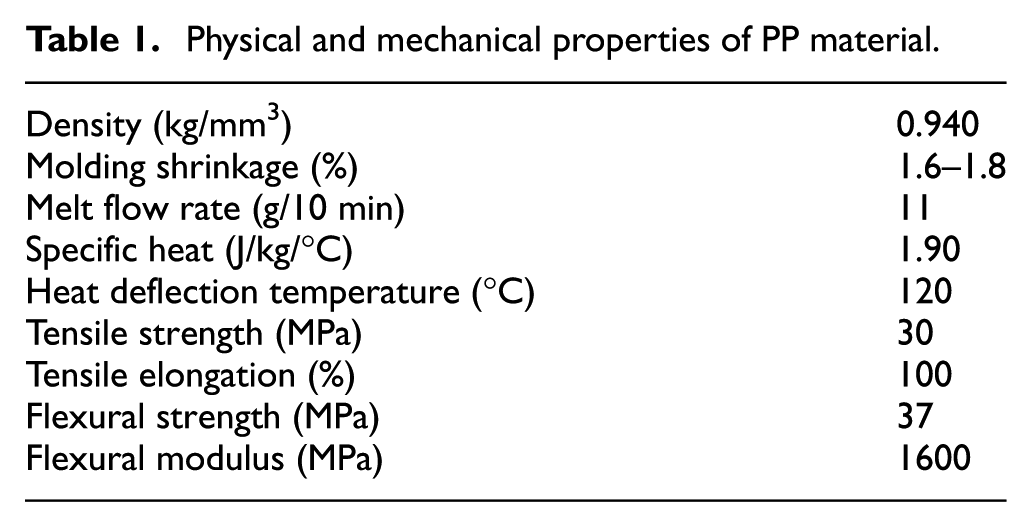
In order to verify the effectiveness and rationality of the theoretical model, the rheological experiments were carried out, by comparing with the classical Ostwald–de Waele power law model and Cross model. The two models are relatively simple and widely used in current commercial software. The commonly used thermoplastic polymer of PP material (GP-1007FC; LG Chem; https://www.lgchem.com/cn/ncc-po/pp-polypropylene/product-detail-PDBBD000) was selected as a sample material. The basic physical and mechanical properties of PP are summarized in Table 1.
Physical and mechanical properties of PP material.
In experiments, the shear stress and shear rate data were extracted using the rheological tests. The HAAKE MARS60 rotational rheometer (Thermo Electron (Karlsruhe) GmbH, Germany) was employed. The P25/Ti-02150398 type rotor was selected as a plate rotor, and the specimens were prepared by rheological tests. When the panel temperature rises up to the set point, the plate rotor dropped down and the testing procedure was launched. The corresponding sample data on the shear rate, shear stress, shear viscosity, angular velocity, and torque component were recorded during the rheological experiments. Using the parallel plate rotor, as shown in Figure 1, the corresponding components are given by 26
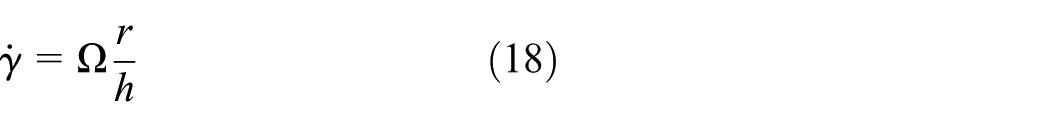

where
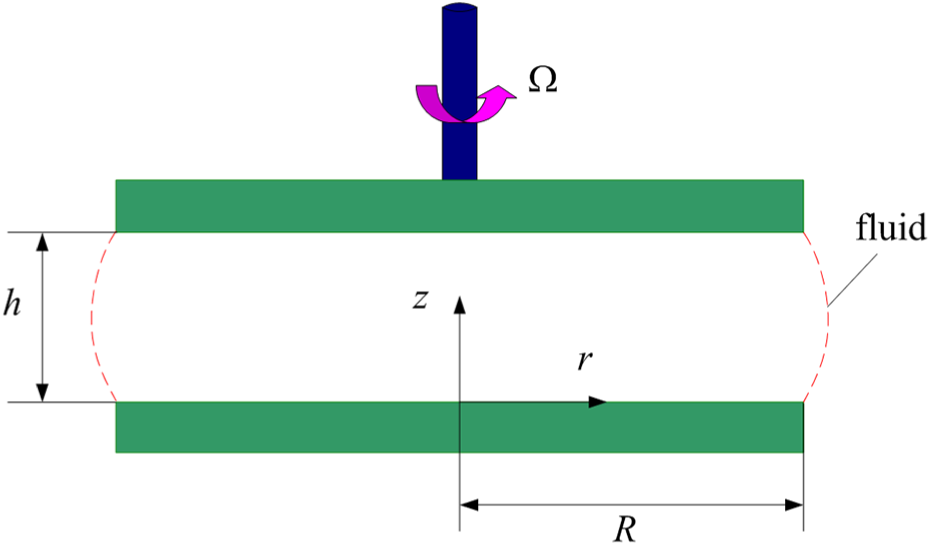
Schematic diagram of the parallel plate rotor device.
Results and discussion
The first rheological experiment was executed to verify the performances of the proposed model. The temperature of 190°C, testing time 300 s, gap 1 mm, and shear rate 0–1500 s–1 were launched. Each test was fed with a same mass of PP material about 0.85 g, and the same experiment was repeated several times to reach a steady phase. Then, the other two times of experiments were launched to study the rheological behavior of PP material. To save space in visualizing the obtained values, the collected sample data of the first experiment were given in a definite figure. Figure 2 depicts the fitted results of the theoretical model (equation (17)) by randomly sampling two times: the scatter points represent the experimental results and the curves denote the fitted results of the viscoelastic model.

Fitted curve of the theoretical model of PP material at 190°C.
It can be seen from Figure 2 that the two tests show a similar curve tendency within trails window. There is a slight mismatch of sample data in the initial stage, and the corresponding time was not more than 1.5 s, because of the startup fluctuation of the experimental device. The shear stress increases monotonically with the rise in shear rate in the preliminary stage, whereas it shows a peak value of around 50,000 Pa before the shear rate reaches about 600 s–1 and the shear time 53 s. Then, the curve exhibits a slow increasing trend until reaching another peak point in middle stage, corresponding to the shear rate of around 1300 s–1. After that, the higher shear rate increases, and the lower shear stress drops. It results in the downtrend of the curve sharply in the last stage. Moreover, the theoretical curves decline rapidly due to the overflow of polymer melts from the parallel plates under higher shear rate condition. These lead to an unidentified downtrend of the curve in the last stage. Thus, distortion data should be eliminated in the follow-up study.
Usually, the whole rheological process can be divided into three stages. In the early stage, the polymer coil gives an elongation deformation due to the shear stress load, which leads to the partial disentanglement and deformation. However, the disentanglement and elongation are still constrained with the counterforce coming from the others. The disentanglement and entanglement rate of the polymer macromolecules remain in dynamic equilibrium due to the lower shear rate condition. These result in the quasi-linear climbing trend of the curve. With the prolongation of time, the polymer melts overcomes the tangle force progressively in the middle stage and becomes easier to disentangle and deform. Matching to the isotactic PP material, as a pseudo-plastic fluid, it displays a high elastic behavior. In this phase, a lower shear stress would induce a larger rate of deformation, and the curve shows an easy deformation with the increase in shear stress. As time goes by, the climbing trend of the shear stress would be terminated until reaching to another peak value and gets more difficult. Despite of some mismatch, the whole fitted curve shown in Figure 2 predicted by the theoretical model agrees well with the actual flow behavior, which indicates that this theoretical model is robust for describing the instantaneous shear flow behavior of the polymer materials.
Progressively, eliminating the distortion data in finial stage coming from the overflow of polymer materials, we extracted the first experiment and substituted these specimen data (shear rate of 0–1200 s–1) into the theoretical model, the classical Ostwald–de Waele power law model, and Cross model. The corresponding graphs of shear stress against shear rate are given in Figure 3. Black scatter circle points in the figure represent the experimental results and the black, red, and blue curves denote the fitting results of the theoretical model, Ostwald–de Waele power law model, and Cross model, successively. The constants of the model were fitted and shown in Table 2, where m is the constant of materials, n is the non-Newtonian index in the Ostwald–de Waele power law model, η0 is the zero shear rate viscosity, τ* is the constant of materials in the Cross model, and nc is the non-Newtonian index in the Cross model, being distinguished from the power law index in the power law model.
Constants of different models of PP material at 190°C.
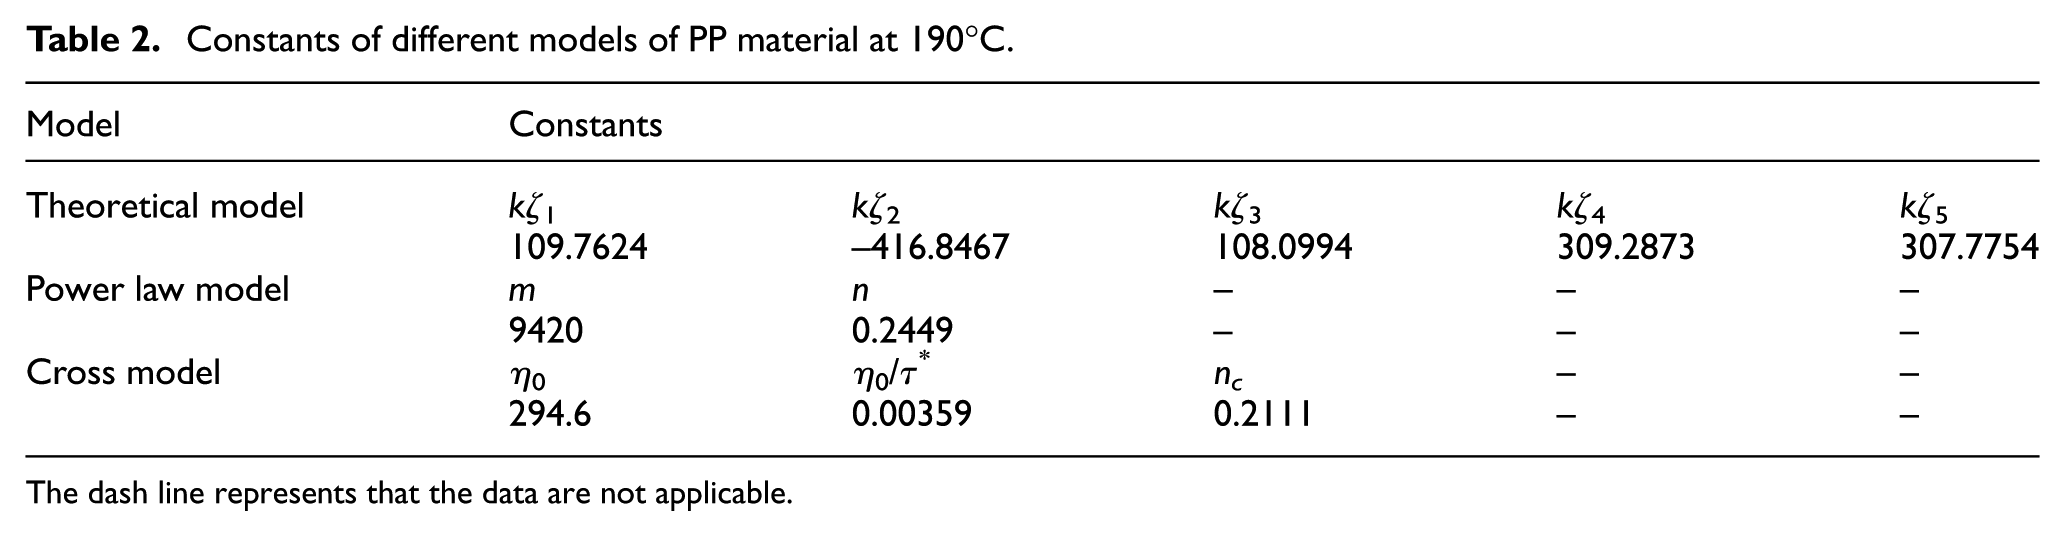
The dash line represents that the data are not applicable.

Fitted curves of different models of PP material at 190°C.
Figure 3 illustrates that the theoretical model gives a better fitness trend than the Ostwald–de Waele power law model within the current test window, expecting for the oscillating unsteady flow in the initial stage. Especially in a higher shear rate, power law model exhibits a severe distortion character, while the theoretical model gives a substantial coincidence with the specimen distribution in practical. Comparing the theoretical model with the Cross model, they present an almost uniform trend in the middle stage, roughly from 100 to 600 s–1. When the shear rate is higher than about 600 s–1, the theoretical model shows a more scientific tendency. However, the Cross model gives a good fitness at a lower shear rate scope. In a word, the theoretical model is more accurate than the Ostwald–de Waele power law model and roughly shows a equivalence with the Cross model of the flow behavior in tests.
The analysis of variance (ANOVA) was performed to determine the fitness of the corresponding model in this study. The results are illustrated in Table 3, where SSE, RMSE, R2, and
ANOVA results of different models of PP material at 190°C.


where
It is seen from Table 3 that the theoretical model illustrates a smallest value of SSE and RMSE, and a biggest value of
In order to enhance the reliability and comparability of the laboratory testing results thoroughly, the other three experiments were launched. PP material in each test was fixed at about 0.51 g, fluctuating from 0.5078 to 0.5133 g. Shear rate at a range of 0–600 s–1, testing time 300 s, and gap 1 mm were utilized. Material temperatures were set at 195°C, 205°C, and 215°C, successively. From these sample data, we recognized that the shear stress drops down sharply at the last stage (shear rate reaches 508.33 s–1of 195°C, 518.40 s–1 of 205°C, and 534.63 s–1 of 215°C) because of the overflow of polymer materials, similar to the previous experiments. Such mismatch data were eliminated from the subsequent research, and the fitted results are presented in Figure 4. Constants in each model were calculated and illustrated in Table 4. Accordingly, the ANOVA results of each model are shown in Table 5.
Constants of different models of PP material at different temperature.

The dash line represents that the data are not applicable.
ANOVA results of different models of PP material at different temperature.


Fitted curves of different models of PP material at different temperature.
As seen from Figure 4 and ANOVA results in Table 5, they also illustrate that the theoretical model is effective and robust for describing the shear flow behavior of the thermoplastic polymer materials.
In further study, we found that there is a non-zone shear stress startup point of the theoretical model, different from the current others. The constant term
Conclusion
By coupling with the thermodynamics, statistical mechanics, and continuum mechanics theory, a viscoelastic mathematical model was proposed in this article to describe the shear flow behavior of the incompressible and isothermal thermoplastic polymer. The viscoelastic model can be simplified as the generalized Newton’s law. The integral formula with a special case of the K-BKZ model was derived. The isotactic PP material was used to conduct the rheological tests. The sample data were collected and fitted. The ANOVA method was performed to determine the fitness of the model. Experimental results reveal the viscoelastic model matches well with the rheological practices. Compared with the classical Ostwald–de Waele power law model and Cross model, the viscoelastic model is more scientific and effective. The scientific result may be helpful for potential industrial applications and benefits the users of certain plastic components.
Footnotes
Handling Editor: James Baldwin
Declaration of conflicting interests
The author(s) declared no potential conflicts of interest with respect to the research, authorship, and/or publication of this article.
Funding
The author(s) disclosed receipt of the following financial support for the research, authorship, and/or publication of this article: This work was supported by the National Natural Science Foundation of China (No. 51565034); the National Key Technology Research and Development Project of Jiangxi Province, China (No. 20151BBE50033); and the Key project of Scientific research of the Education Department of Jiangxi Province, China (No. 150009).