
Abstract
Traditional industry is shifting towards the ‘industry 4.0 factory’ that incorporates automatic fault detection and correction. Industry 4.0 also includes online condition monitoring to make maintenance decisions on the basis of the health of a single machine. This research article presents order analysis for detecting two common problems in rotating machinery – misalignment and cracks. The systematic and detailed experimentations were performed on SpectraQuest’s Machinery Fault Simulator™, and the time domain data acquired through the accelerometers mounted on motor and rotor inboard and outboard bearing housing were transformed into spectra using a fast Fourier transform. Two sets of experiments have been performed for misalignment and one set for shaft cracks. Three levels of misalignment with two types of loading conditions have been analysed. The faulty vibration data were compared with the healthy shaft. The misaligned shaft shows higher vibration amplitude at 2× running speed and harmonic vibration behaviour. The slit repair and V-notch crack shaft models were used to analyse the effect of cracks on vibrations and the resulting vibration spectra showed peaks at 2× and 3× running speed. These results indicate that order analysis is helpful in detecting misaligned and cracked shafts, supporting industry 4.0 by facilitating the automatic detection of faults.
Keywords
Introduction
The world needs smart factories, which are popularly referred to as ‘industry 4.0’. The vision is to make a complete automatic system that can diagnose faults within itself and predict its own remaining useful life. One approach to achieve this is to use a technique known as predictive maintenance, which allows intervention before failure occurs and significantly improves the efficiency of engineering components. Condition monitoring, particularly vibration analysis of rotating machinery, can predict and diagnose operational or structural defects. In rotating machinery, shaft misalignment and cracks are common faults, and they must be diagnosed before failure occurs. These faults can be predicted with the help of order analysis. In this research article, order analysis is presented for the detection of misaligned and cracked shafts by performing a detailed and systematic experimentation on a simple rotor-bearing system.
A wide variety of examples of predictive maintenance are available in the published literature, an overview of which is presented here to provide context for this study. The techniques have been applied to the following: a boiler feed pump in a thermal power plant, where an unbalanced vane was subsequently rebalanced using phase analysis; 1 a forced-draft fan that was vibrating beyond safe operational limits 2 and induction motors, in which the methods were compared with monitoring motor current signature analysis, surface vibration and instantaneous angular speed. 3 The turbo generator set bearings were monitored based on vibrations and ferrography oil analysis. The deterioration in machines is given by a ferrography oil analysis. This research article analysed the overhauling effect on maintenance and explained that when the machine is new, the obtained vibrations are not a real picture of machine’s condition. 4 Vibration analysis of grinder was performed, the maximum weighted acceleration was calculated experimentally and modelling was done in ANSYS Workbench. 5 The effect of detecting faults with wireless sensors was also analysed, and different levels of misalignment were detected and diagnosed with the help of four sensors. The encoder, accelerometer, laser vibrometer and wireless sensor were used to conduct the comparison of misaligned shaft. 6 The condition monitoring techniques of blades in turbo machinery were reviewed, and vibration analysis was proved to be efficient for the detection of severe blade rubbing. 7
The model-based methods have been applied to detect faults in a rotor-bearing system. The minimization of equivalent loads was used among many available methods. The detection of imbalance was performed using the transverse vibrations. 8 A rolling element bearing was studied in high dimensional feature space, and to extract and recognize features, a new method is proposed that is based on short-time Fourier transform (STFT) and non-negative matrix formation (NMF). The results show that the proposed method is more accurate than an artificial neural network (ANN). 9 Investigation was done on steady-state vibration data to detect common faults, such as shaft cracks, rotor misalignment and unbalance of shafts. 10 Experimental modal analysis (EMA) was used to estimate the severity and location of a crack based on the natural frequencies of the rotor shaft. The crack was confidently located, and the severity was also estimated in terms of the damage index (DI). 11 The Hilbert–Huang transform (HHT) was used in the time–frequency domain to analyse unbalanced and bowed shafts by decomposing the vibration signal. HHT analysis proved effective to diagnose unbalanced and bowed shafts compared with the fast Fourier transform (FFT) analysis. 12 To identify the severity and direction of eccentricity gear, the flexible time domain averaging technique is proposed. The proposed method enhances the amplitudes of impulses by 35% that can help in extracting fault symptoms in rotating machinery. 13 Order analysis was proposed to detect bends in shafts. The vibrations were taken from drive and non-drive end of the bearing, and bent shaft is detected with the help of order spectra because it shows peak at first order. 14
Undetected fatigue cracks can cause catastrophic failure in shafts. Fourier transform, correlation analysis and wavelet analysis were performed, and positive progress has been made. 15 For an open crack in the non-rotating rotors, the crack was identified with a finite element model in which the changes in eigenfrequencies are analysed. The algorithm is based upon a finite element model that detects the location and depth of crack and proposed that to find the true crack location the first mode shape can be used. 16 The non-linear dynamic behaviour of rotating machinery and detection of crack in a rotating shaft were presented, and a significant amount of progress has been made in detecting and quantifying the faults of rotating machinery. 17 Machines often fail due to shaft misalignment as it creates excessive vibrations, as well as additional dynamic load on shafts. Approximately 70% of the problems in mechanical machinery is caused by misalignment, 18 which leads to downtime up to 30%. 19 A single run-down experiment was performed on a flexible rotating machine in which misalignment and unbalance were estimated. Time or frequency domain techniques were applied on fault vibration signals. 20
Some of the engineering methods along with cyber physical systems are discussed to implement the fourth industrial revolution concept. 21 Shaft misalignment was detected from experimental data obtained using a machinery fault simulator (MFS). Vibration data were compared using the following two methods: traditional vibration analysis and piezoelectric strain sensors (PSS). PSS showed high detection sensitivity in the case of the misaligned shaft and low detection sensitivity for unbalance. 22 Experimental vibration data were collected from a rig that consists of a shaft that rotates under its own weight at the steady state for different crack conditions. Nine different crack levels were induced and signals were processed by combining the wavelet packet transform energy and ANN (radial basis function–artificial neural network (RBF-ANN)). The results improved with the speed and show that cracks can be detected with high reliability. 23 From the analysis of dynamic modal, it is concluded that supersynchronous component in the frequency spectra 2× is a symptom of rotor misalignment fault. 24 A dynamic study of breathing cracked shaft was performed experimentally to analyse a breathing crack while passing through subcritical speeds. The experiments were performed on a rotor test rig that consists of two ball bearings having a shaft powered by a DC motor. The FFT was calculated for vibration data that revealed that whenever the cracked shaft passes through the subcritical speed region, there will be at least one high frequency component. The results also show that as the operating frequency approaches the centre of subcritical zone, the dominant component becomes stronger. 25 The through-thickness and fatigue crack were analysed on a free vibrating cantilever beam using finite element method and experimental tests. The vibration data acquired through accelerometers were analysed using FFT and power spectrum density (PSD). The harmonics were found due to the breathing behaviour of the crack. 26 The transducer location was studied for rotor imbalance, shaft misalignment and a cracked shaft. Vibration spectrum analysis was performed on experimental data obtained from MFS to illustrate the proposed selection process. 27
The literature concluded that the vibration spectrum is a widely used method for detecting the real-world faults in rotating machinery, and a lot of gaps are present that can be addressed by analysing the effects of shaft misalignment and cracked shaft in rotating machinery with order analysis, so that it can help in implementation of industry 4.0. In this research article, the use of order analysis to detect shaft misalignment and cracked shaft is explored. In order to show the effectiveness of the order analysis, the detailed experimentations have been performed on a simple rotor-bearing system. The vibration spectra of misaligned and cracked shaft are analysed and presented. The FFT is used to perform the order analysis for online condition monitoring to facilitate the industry 4.0 factory.
Order analysis
The order analysis is based on the frequency domain vibration data that is calculated from the FFT. The FFT takes a time-domain vibration signal, digitizes it and then applies the following mathematical equation (1) to convert it to frequency domain. 28 The resultant graphs are acceleration/vibration amplitudes as a function of frequency, which are known as spectrum analysis

where x[n] is the digitally sampled time data, N is the number of digitally acquired data points, n is the time index and k is the frequency index. The right side of the above equation is known as ‘time domain’, while the left side is ‘frequency domain’. The FFT basically computes the discrete Fourier transform (DFT) and produce the same result, but it is faster than the DFT. The DFT has
This MFS was used to detect parallel and angular misalignment with rigid coupling for 20 and 3 Hz rotational speed by analysing the spectra of vibrations and PSS. 22 The vibration spectrum analysis showed different behaviour of the two types of crack, and it found early detection threshold for both the cracks. 26 The experiments were performed on MFS for angular and parallel misalignments and breathing crack by obtaining vibration data on different speeds to study sensitive location for transducer. 27 In this research, both experiments A and B have been performed to obtain vibration spectra of misaligned shaft for different operational conditions. The experiment C is performed to detect slit and V-notch crack in shaft.
The unbalance produces equal forces in radial directions, that is horizontal and vertical, but the forces produced due to misalignment are not equal in horizontal, vertical and axial directions because most rotating machines are highly flexible in the horizontal direction as compared to the vertical direction, resulting in high amplitude of vibrations in the horizontal direction. In the case of misalignment, the rotor can vibrate differently in horizontal and vertical directions, which leads to the conclusion that no relationship exists between rotor vibration mode in horizontal and vertical directions. Another symptom of misalignment is that the vibration amplitudes are dissimilar in horizontal and vertical directions across the couplings. However, it is difficult to correlate the vibration amplitude with misalignment. Therefore, the order analysis is used in this study.
Experimental setup
All experiments were conducted on SpectraQuest’s Machinery Fault Simulator™ (MFS), data were collected with an eight-channel data acquisition card and analysed with SpectraQuest’s VibraQuest software package. As the data of maximum eight channels can be acquired, when there was a need for more than eight channels of data in this study, they were collected in two parts. For the first part, the data were collected for motor inboard and rotor inboard bearing housings, and for the second part, the data were collected for motor inboard and rotor outboard bearing housings in vertical, horizontal and axial directions.
The SpectraQuest’s MFS consists of a 1 hp, three-phase AC induction motor that is used to drive the rotor assembly, with a turned ground and polished (TGP) steel shaft of 19 mm diameter and a helical beam coupling. The shaft is supported by two rolling elements bearing in a horizontally split aluminium bracket. Variable frequency drive is used to control the speed of motor from 0 to 6000 r/min (short duration) for variable speed. Accelerometers with a sensitivity of 10.2 mV and a measurement range of ±490 m/s2 were used to record vibrations.
The following three types of experiments were conducted to achieve the objectives of this study:
A. Shaft misalignment with two gold discs.
B. Shaft misalignment with bearing loader placed in between the bearing housing.
C. Cracked shaft with bearing loader placed in between the bearing housing.
In experiment A, the speed is set to 30 Hz and only medium (30 mil) level of offset for parallel and angular misalignment is created with the help of dial indicators as shown in Figure 1. The accelerometers were placed on rotor inboard and motor inboard bearing housing in vertical, horizontal and axial directions, respectively.

Experimental setup for shaft misalignment with two gold discs (experiment A).
For the experiment B, the effects of level and type of misalignment on vibration spectra were analysed. Three levels of offsets such as low (15 mil), medium (30 mil) and severe (41 mil) were created on the rotor inboard bearing housing to simulate angular misalignments. Equivalent offsets on the rotor outboard bearing housing side gave parallel misalignment. Accelerometers were mounted on motor inboard, rotor inboard and rotor outboard bearing housing in vertical, horizontal and axial directions, respectively, as shown in Figure 2. The running speed was set to 45 Hz. The data were collected with 2000 Hz maximum frequency, 1600 spectral lines and 5 number of blocks.

Experimental setup for shaft misalignment with bearing loader (experiment B).
The changes in 1× and 2× frequency responses for the intact and cracked shafts were investigated in experiment C. The vibration spectra of slit repair crack and V-notch crack are analysed in this experiment. Both cracks are located at a distance of 95 mm from the inboard bearing housing. The width of crack is 3 mm, depth of crack is 3.1 mm, length of crack is 17.5 mm and crack tip radius is 0.5 mm. Accelerometers were mounted on motor inboard, rotor inboard and rotor outboard bearing housing in vertical, horizontal and axial directions, respectively, as shown in Figure 3. The data were collected with 2000 Hz maximum frequency, 1600 spectral lines and 5 number of blocks at 35 Hz running speed.

Experimental setup for cracked shaft (experiment C).
After the data were collected, they were transformed from the time domain into the frequency domain by using an FFT.
According to the ISO Standard 20816:2016 29 vibration severity chart, this machine belongs to Class I (small machines) as the maximum power is 1 hp. Furthermore, ISO 20816:2016 defines four categories: Good, Satisfactory, Unsatisfactory and Unacceptable, based upon the maximum root mean square (RMS) velocity. Before introducing any fault, the average. RMS velocity values were measured and are presented in Table 1 for experiment A and in Table 2 for experiments B and C. The maximum RMS velocity value of this machine in fault-free condition is less than 1.80 mm/s. Hence, this machine is within tolerable limits and can be used for experimentation.
Overall velocity-RMS (mm/s) values for experiment A with no fault condition.

RMS: root mean square.
Overall velocity-RMS (mm/s) values for experiments B and C with no fault condition.

RMS: root mean square.
Results and discussion
Experiment A: shaft misalignment with two gold discs
Two gold discs were placed in between the bearing housing. Angular and parallel misalignment was induced, and machine was operated at 30 Hz. The vibration spectrum of the inboard bearing recorded in the horizontal direction is shown in Figure 4. The maximum peaks shown in Figure 4 are presented in Table 3.

Power spectrum of inboard bearing horizontal vibrations for misalignment with two gold discs (experiment A) at 30 Hz: (a) angular misalignment of 30 mil, (b) parallel misalignment of 30 mil and (c) misalignment of 30 mil.
The maximum peaks of inboard bearing horizontal vibrations for experiment A.
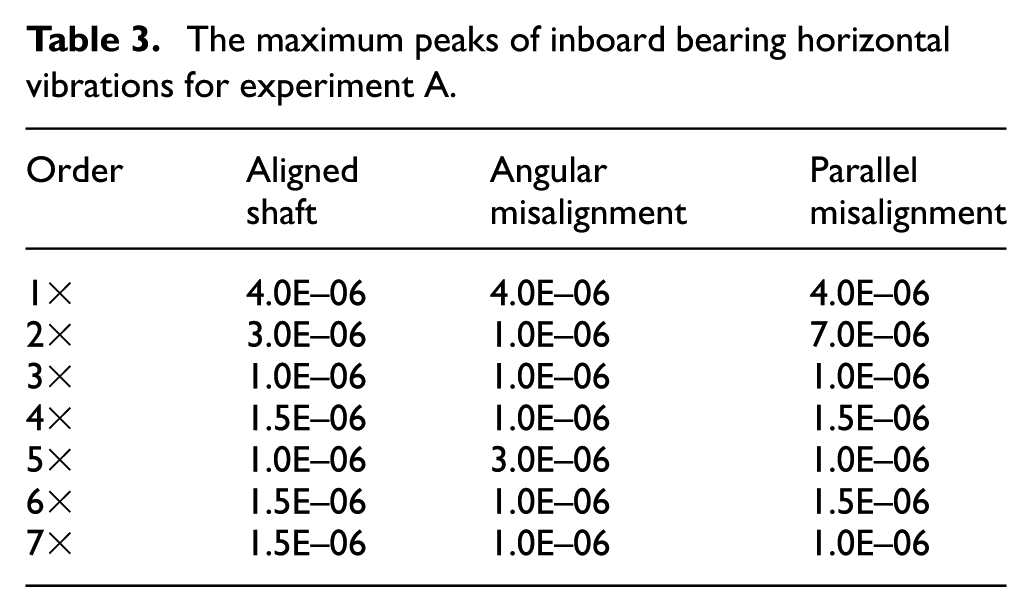
It is apparent that the amplitude of the horizontal velocity increases when the shaft is misaligned. From the velocity power spectrum in Figure 4, the 1× frequency is approximately same as it should be because every machine has small amount of imbalance. However, when there is angular misalignment, side bands occur at 5× and vibrations are high at 4×, 5× and 6× frequency component. In contrast, the vibrations are high at 2×, 3× and 5×, and side bands occur at 5× and 7× in the case of parallel misalignment. Parallel misalignment causes more vibration at 2× and 3× than angular misalignment, while angular misalignment induces more vibration at 5× than parallel misalignment.
Experiment B: shaft misalignment with bearing loader placed in between the bearing housing
Shaft misalignment was also analysed by placing a bearing loader in between bearing housing. The power spectra of outboard bearing axial vibrations for parallel and angular misalignment are shown in Figures 5 and 6, respectively, and they are compared in Figure 7; these peaks are presented in Table 4.

Power spectrum of outboard bearing axial vibrations for parallel misalignment with bearing loader (experiment B) at 45 Hz: (a) low, (b) medium and (c) severe.

Power spectrum of outboard bearing axial vibrations for angular misalignment with bearing loader (experiment B) at 45 Hz: (a) low, (b) medium and (c) severe.

Comparison of angular and parallel misalignment. Power spectrum of outboard bearing axial vibrations for misalignment with bearing loader (experiment B) at 45 Hz: (a) low, (b) medium and (c) severe.
The maximum peaks of outboard bearing axial vibrations for experiment B.

The vibration spectra for different types and levels of misalignment between rotor and motor shafts are analysed. A clear relationship does not exist between the misalignment and vibration signature. From Figure 5, it is concluded that vibrations are high at 2× and 3× and that 2× is dominant for all levels of offset in the case of parallel misalignment. For angular misalignment, vibrations are high at 2× and 3× and that 3× is dominant for all levels of offset, as shown in Figure 6. Parallel and angular misalignments are compared and shown in Figure 7. The parallel misalignment has greater vibrations at 2× and 3× than does the angular misalignment. From the results of the above-mentioned experiments, it is concluded that order analysis helps to detect misalignment and the 2× and 3× frequency component can be used as indicators of misalignment for a simple rotor bearing machine.
Experiment C: cracked shaft with bearing loader placed in between the bearing housing
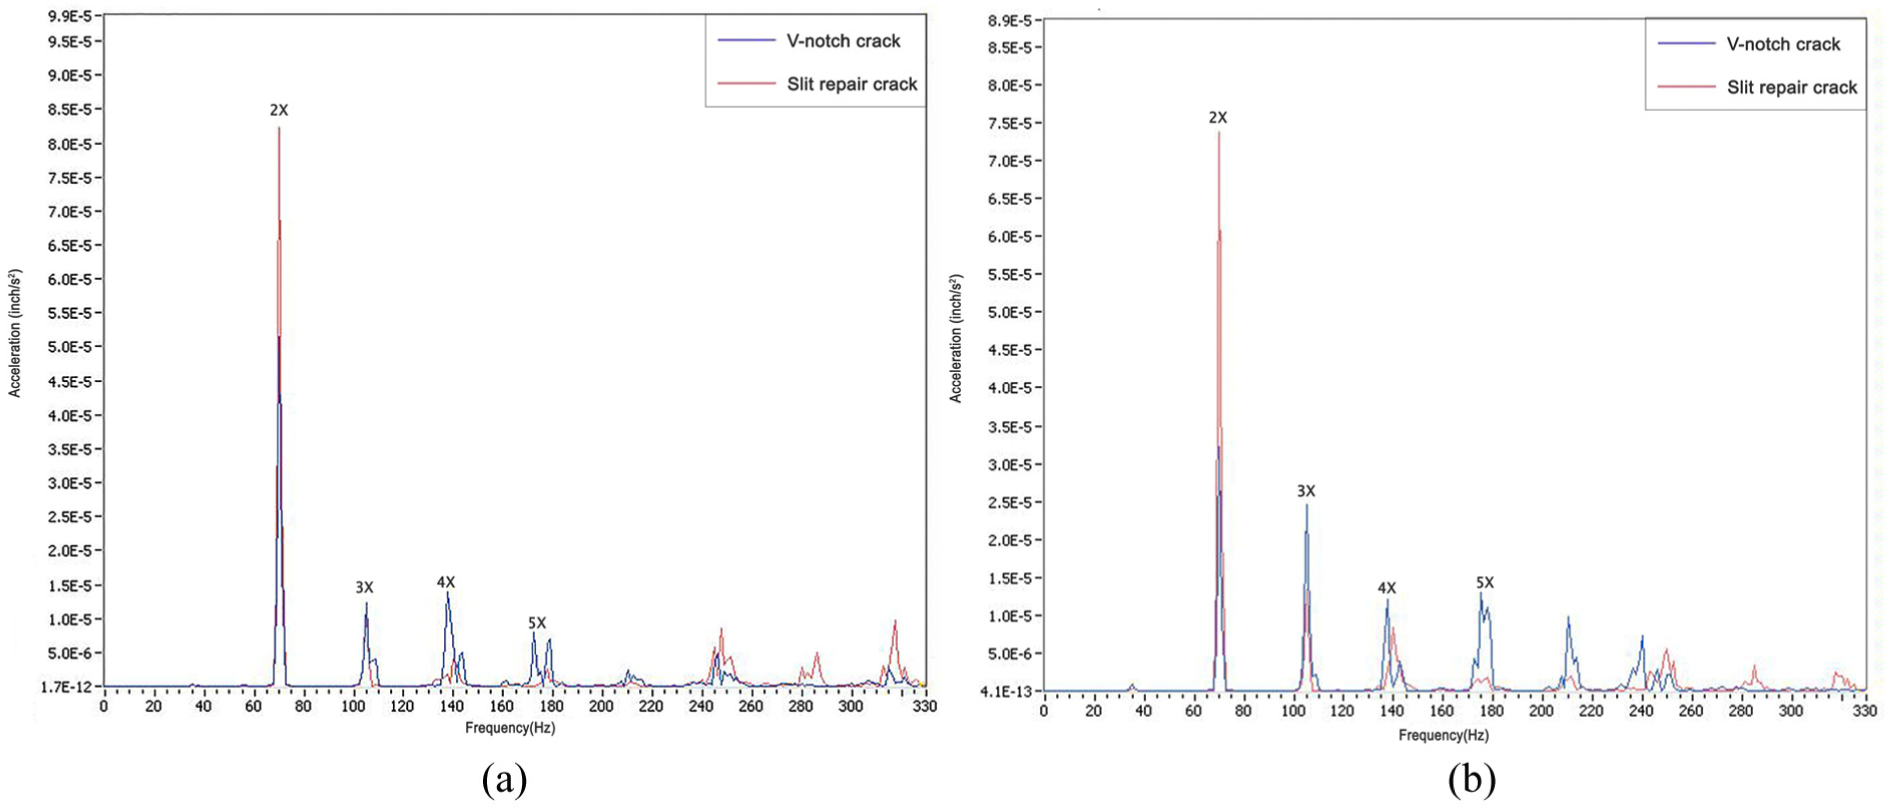
Two types of cracked shafts were used with bearing loader to analyse the vibration spectra of cracked shaft. The bearing loader was placed in between the bearing housing. One shaft has a slit repair crack, and the other shaft has a V-notch crack. The vibration spectra of inboard and outboard bearing housings for these two cracks were analysed and are shown in Figures 8 and 9, respectively, and compared in Figure 10. All the maximum peaks at their respective order are presented in Table 5.

Power spectrum of inboard bearing axial vibrations for cracked shaft with bearing loader (experiment C) at 35 Hz: (a) slit repair crack and (b) V-notch crack.

Power spectrum of outboard bearing axial vibrations for cracked shaft with bearing loader (experiment C) at 35 Hz: (a) slit repair crack and (b) V-notch crack.
Comparison of V-notch and slit repair crack. Power spectrum of axial vibrations for cracked shaft with bearing loader (experiment C) at 35 Hz: (a) inboard bearing housing and (b) outboard bearing housing.
The maximum peaks of outboard bearing axial vibrations for experiment C.
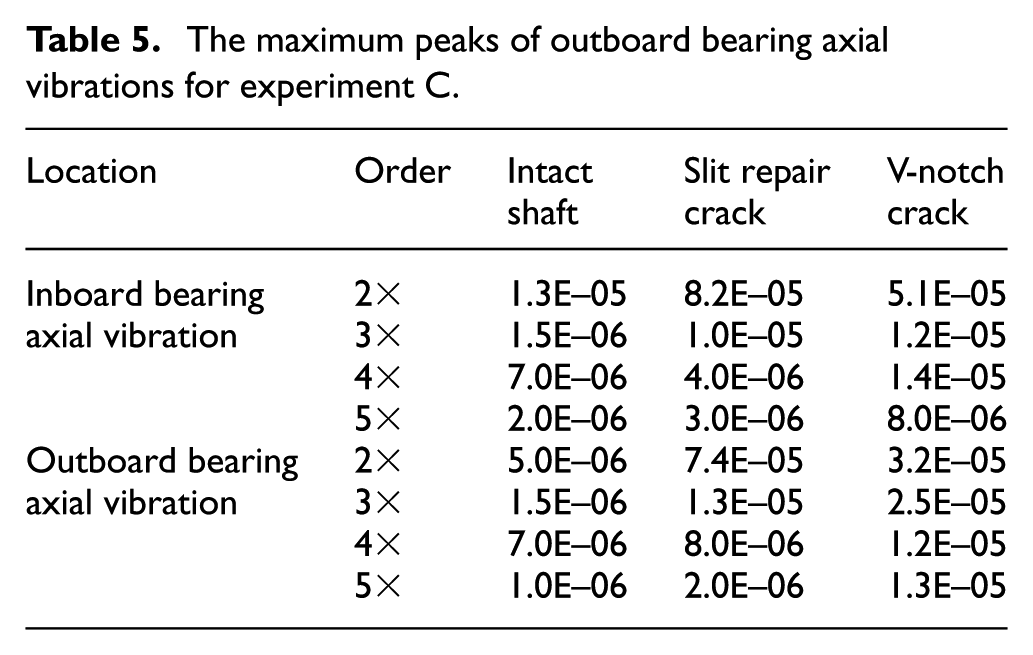
From Figures 8 and 9, it is clear that the largest spectral peaks are at 2× and 3× for slit repair crack and at 2×, 3×, 4× and 5× in the case of V-notch crack. There is no clear spectrum to differentiate between these two cracks, but in this experiment the V-notch crack vibrations are strongly harmonic, while the slit repair crack has a peak at 2×, as shown in Figure 10. The 2× and 3× responses are amplified because of the crack. The experimental results of cracked shafts show harmonic vibration behaviour, with clear peaks at 2× and 3× proving that order analysis is a helpful technique in detecting cracks in shafts.
Conclusion
The order analysis proved effective for detecting two common problems in rotating machinery – misalignment and cracks. The vibrations of the machine used in this study are within tolerable limits, as per the ISO Standard 20816:2016. The vibration spectra of the misaligned shaft are high at 2× and strongly harmonic compared to an aligned shaft, whereas the spectra from the cracked shaft exhibit peaks at 2× and 3× relative to an intact shaft. The vibration spectra of faults are observed to be strongly harmonic, and the peaks of the spectra depend upon the operating conditions. The vibrations from the rotor bearing housing revealed a clearer picture of the fault than those from the motor bearing housing. The peak frequency is shifted whenever there is any change in the speed. The vibrations were high in the axial direction in both misalignment experiments. The results concluded that order analysis is a helpful technique in detecting misalignment and cracks in shafts.
This study enhances condition monitoring techniques and the detection of faults, such as misalignment and cracks. In industry, most machines have at least one shaft that will commonly face the issues of cracking or misalignment. This vibrational spectral trend of misaligned and cracked shaft can be considered as a baseline and compared with a similar machine to predict faults that will lead to maximizing the production by minimizing the downtime. In the future, we are planning to detect and identify other faults so that the expediency of order analysis for online condition monitoring in rotating machinery can be explored.
Footnotes
Handling Editor: Jia-Jang Wu
Author contributions
N.A. contributed to conceptualization, data curation, methodology and writing – original draft. N.A. and I.U. contributed to formal analysis and software. X.Y. contributed to funding acquisition, investigation, resources and supervision. X.Y. and H.R. contributed to project administration. N.A. and H.R. contributed to validation. N.A., X.Y., H.R. and I.U contributed to writing – review and editing.
Availability of data and materials
It is declared that the authors have all the raw data in excel file and will be provided upon request.
Declaration of conflicting interests
The author(s) declared no potential conflicts of interest with respect to the research, authorship and/or publication of this article.
Funding
The author(s) disclosed receipt of the following financial support for the research, authorship and/or publication of this article: This research was funded by the National Natural Science Foundation of China (grant no.: 51105316) and Natural Science Basic Research Plan in Shaanxi Province of China (grant no.: 2018JM5107).