
Abstract
In the past studies, the influence of wheel structure design and optimization on the aerodynamic drag of car and heat transfer performance of brake disc was less studied. To study the influence mechanism, the finite element model for wheel aerodynamic analysis was established using computational fluid dynamic method and the correctness of the model was verified by the wind tunnel test data. The influence mechanism of the flow field on aerodynamic drag of car and wheel and heat transfer performance of brake disc was studied. The influence of wheel disc structure on aerodynamic drag coefficient of the car and average convective heat transfer coefficient of the brake discs was studied. The parametric model of the wheel under the computational fluid dynamic analysis was established using mesh morphing technology. A total of 100 and 10 sample points were extracted using the Hammersley Design and Optimal Latin Hypercube Design, respectively, to fit the radial basis function surrogate model and test the accuracy of the surrogate model. Based on the established surrogate model, taking the minimum of the wheel mass, the minimum of the aerodynamic drag coefficient of the car and the maximum of the average surface convective heat transfer coefficient of brake discs as objectives and design variables of wheel as constraints to ensure the wheel structural strength, the non-dominated sorting genetic algorithm was adopted to carry out multi-objective optimization design for the wheel. Pareto frontier was obtained and a compromise solution was selected as the optimization design result. After the optimization design, the wheel mass is reduced by 8.28%, the aerodynamic drag coefficient of the car is reduced by 3.17% and the average surface convective heat transfer coefficient of brake discs is increased by 9.31%.
Keywords
Introduction
The wheel is the most important carrier and safety part in the car driving system, the lightweight extent and aerodynamic performance of which directly affect the car’s economy, power, ride comfort, braking and traffic safety.1–3 At the same time, the brake disc is an important part for driving safety, heat fading of which will make the brake failure, while convective heat transfer accounts for 90% of the heat transfer of brake disc.4–7 Rotating wheel will interfere with the flow field near the wheel cavity and the car wake vortex, thus affecting the aerodynamic drag of car and surface convective heat transfer of brake disc. 8
The aerodynamic drag represents 20% of the total vehicle fuel consumption, while the drag contribution of wheel in total vehicle drag is around 25%. 9 With the deep research on optimizing body shapes to reduce the vehicle aerodynamic drag in decades, there is a little space improving the body optimization.10–17 So, the research on optimizing wheel structures to reduce the vehicle aerodynamic drag is increasing recently.
Vdovin et al. 18 present a simulation study on the ventilation resistance moment of a wheel and factors that affect it using computational fluid dynamic (CFD) methods. It is demonstrated that brake discs have almost negligible ventilation torque, while the contribution of rims and tyres may vary depending on the rim design used and the velocity of the vehicle. Kumar and Singh 19 research the influence of ground clearance on the performance of various aerodynamic drag reduction devices such as air-dam, spoiler, wheel cover and their combinations for hatchback vehicle using CFD methods. CFD has helped in selecting the optimized aero-parts configuration based on aerodynamic performance at concept stage which has ultimately reduced the vehicle drag coefficient by 10%. Maruyama et al. 9 study the sensitivity of the drag coefficient through changing the wheel structure of a sedan vehicle. The results show a small decrease in drag performance; however, when increasing the number of wheel blades, the drag performance shows an improvement due to the fan effect and by closing the opening wheel area. D’Hooge et al. 20 investigate the aerodynamic performance of the wheel and tyre system and optimize the wheel design based on the Tesla model S. The longitudinal drag was created by the body and wheels, and the rotational drag can also add an appreciable amount of aerodynamic resistance to the vehicle. Buscariolo and Karbon 21 compare the static and rotating cases of different wheels in a Sedan vehicle using CFD analysis. Results show that the drag coefficient value in the rotating wheel case is lower compared to the same wheel design in the static wheel case. Flow pattern and differences are illustrated by pressure, velocity and wake contours. Diasinos et al. 22 find that the separation and wake characteristics were strongly influenced by the rotation of the wheel. Wheel rotation reduces lift and drag by 90% and 25% relative to stationary wheel, respectively.
Landström et al. 23 investigate the potential of different wheel design parameters focusing on reduced aerodynamic drag. Effects of covering the front wheels are more complex as both upstream and downstream flow regions were affected, and it is shown that for the vehicle investigated in this study, a limited amount of outer radial covering of the wheel gives the largest drag reduction. Gérardin et al. 24 use CFD methods to calculate the velocity field of the air flow around a rotating wheel and to determine the trajectories for different particle sizes. Experiments revealed a strong impact of the nature of tyre both on the velocity field of the flow and on the particle dispersion in the near wake of the wheel. Croner et al. 25 carry out wind tunnel investigations with a smooth rotating wheel in contact with a moving belt and compared to URANS simulations based on the geometry used for experiments. Lounsberry et al. 26 perform a correlation study between static wind tunnel testing and CFD for a small hatchback vehicle, with the intent of evaluating a variety of different wheel and tyre designs for aerodynamic forces. They detail the process involved in achieving the best correlation of the CFD prediction with experimental results and describe the steps taken to include the most accurate geometry possible, including photogrammetry scans of an actual tyre that was tested and the level of meshing detail utilized to capture the fluid effects of the tyre detail. Duncan et al. 27 explore the application of simulation tools to wheel design in on-road operating conditions and provide insight into the mechanism of drag reduction. The study is successful in establishing simulation as a reliable means to evaluate wheel designs and the potential for drag savings early in the vehicle development process, with much less cost than physical tests. Mears and Dominy 28 use CFD to model the aerodynamic characteristics of an exposed racing car wheel. The front and rear jetting phenomena are successfully predicted using the computational model. Wäschle et al. 29 present the velocity and pressure measurements obtained around an isolated wheel in a rotating and stationary configuration and use drag and lift to compare numerical results obtained from two different CFD codes. Both CFD codes show good correlation of the integral forces. The influence of the wheel rotation on drag and lift coefficients is well predicted.
Mahammad et al. 30 develop a methodology using commercial CFD tools to predict the heat transfer coefficient, cooling coefficient and rotor temperatures. For the better brake system design, it is essential to predict the accurate brake rotor cooling parameters and temperatures associated with it in the braking process at the early stages of vehicle programme. Shah and Patidar 31 optimize the brake rotor design to improve the performance of disc brake with computer-aided engineering (CAE) and CFD. Jiang et al. 32 focus on the temperature and thermal stress analysis of the co-continuous SiCn/6061 Al alloy composite brake disc of CRH3 under centrifugal and thermal load during emergency braking considering airflow cooling, with the help of finite element calculation software. Beigmoradi et al. 33 compare the different influence on the brake disc cooling between casting and alloy rim using CFD. It is found that changing rim design has significant influence on velocity distribution around brake disc and pads. Choi 34 use the classical result of CFD and virtual thermal tests to produce several valuable applications such as thermal deformation of rotor, optimization of thermal performance and estimation of braking distance.
The above researches were focused on simulation analysis, prediction and test validation of the aerodynamic performances of the wheel and brake disc separately. In the optimization design, these performances were only used to verify the optimization effects of the optimized wheel and brake disc rather than directly using as objectives in the optimization. Without parameterizing the wheel, multiple groups of wheel models were set up to compare as a means of design optimization, which greatly weakened the deformation of the wheel structure and limited the optimization space and effects. At the same time, the study on improving heat transfer performance of brake discs were only focused on the optimization of brake disc structure rather than the optimization of wheel structure.
Therefore, the aim of this article is to reduce the aerodynamic drag of car and improve the surface convective heat transfer performance of brake disc by optimizing the wheel structure. In this article, lightweight and multi-objective optimization for the wheel is achieved, which is of great significance.
Models of numerical simulation
Assembled wheel model
In the earlier research of Wang et al.,35,36 in order to achieve the lightweight of a wheel and separate forging manufacturing process of rim and disc, taking

Assembled wheel model: (a) front and (b) back of wheel model.
Car model
In order to achieve the accuracy of CFD simulation analysis, it was necessary to adjust the calculation scheme of numerical simulation. According to the wind tunnel test data, the appropriate meshing strategy, boundary conditions and solving algorithm were determined.37–39 Therefore, the DrivAer standard car model and its wind tunnel test data of the Technical University of Munich were used to determine the calculation scheme of CFD simulation analysis and verify the correctness of the results.40,41
Considering the computational efficiency and the focus of research in this article, the combination configuration with smooth chassis, without rear-view mirrors, with wheels and moving ground were selected (FSwoMwW with GS). 42 The DrivAer configuration model selected is shown in Figure 2.

The DrivAer configuration model.
Virtual wind tunnel model
The rectangular computational domain around the DrivAer model was established with the distance from the car to the inlet of the computational domain 3 times the length of car, the distance to the outlet 7 times the length of car, the distance to both side walls 5 times the width of car and the distance to the top wall 5 times the height of car. The length of the car is 4612 mm, width 1752 mm and height 1418 mm. Due to the symmetry of the car, the computational domain of the half car model was established using the symmetry plane. Blockage ratio of the virtual wind tunnel ε was 1.6%, meeting the requirements of less than 2%, thus substantially eliminating the influence of blockage effects. 43 The established virtual wind tunnel computational domain is shown in Figure 3.
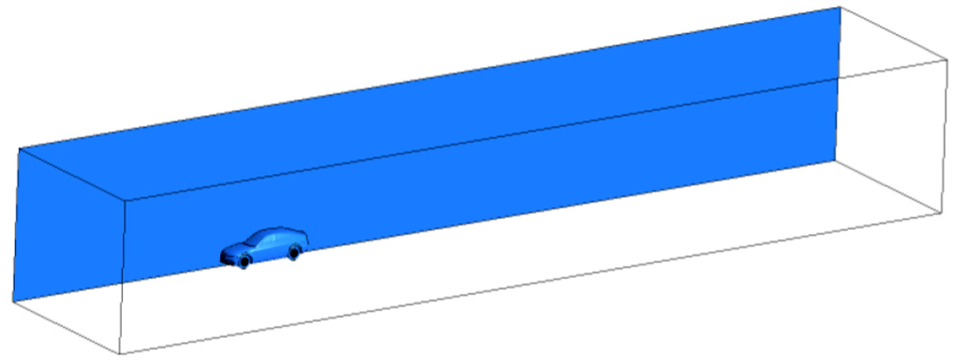
Diagram of the virtual wind tunnel computational domain.
Pre-processing and verification of numerical simulation
Control equations
For all flow, the equations of conservation of mass and momentum need to be solved. For the flow with heat transfer, the equation of conservation of energy is also needed. Heat transfer between the fluid and the solid domain is calculated by solving the energy equation, which is as follows in the Cartesian coordinate system Ox1x2x3
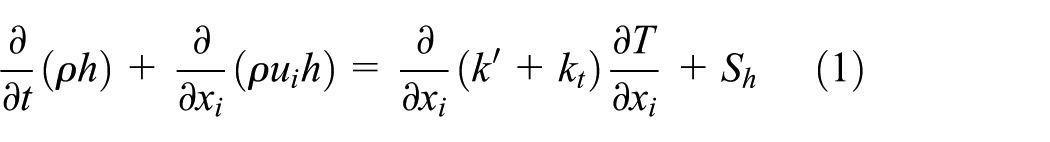
where
When fluid flows through the wall, the convective area heat flux between fluid and solid surface satisfies the following equation

where q is the area heat flux,
The Reynolds-averaged Navier–Stokes (RANS) method based on time-averaged velocity is the basic method used in turbulent calculation.
44
In this article, the realizable k –ε model in the RANS method was used in the formula for calculating the turbulent viscosity coefficient of which the influencing factors of rotation and curvature were introduced to prevent distortion in simulating a strong swirl or a curved wall in standard k –ε model.
45
Meanwhile, compared to the


where k is the turbulent kinetic energy,
Meshing
The turbulent flow is greatly influenced by the wall. According to Prandtl’s boundary layer theory, the appropriate boundary layer grid distribution is one of the most important factors for the accurate calculation of the turbulence model. The wall function is used to represent the distribution of physical quantities such as velocity, temperature, turbulent energy of the boundary layer to solve the impact of wall on the flow and correct the turbulence model well for the region affected by the viscous force. 47 Boundary layers’ first layer thickness needs determining the wall-function method which is calculated as follows.
Estimating Reynolds number

Estimating the wall friction coefficient using the Prandtl formula

Calculating the wall shear stress

Estimating the velocity using wall shear stress
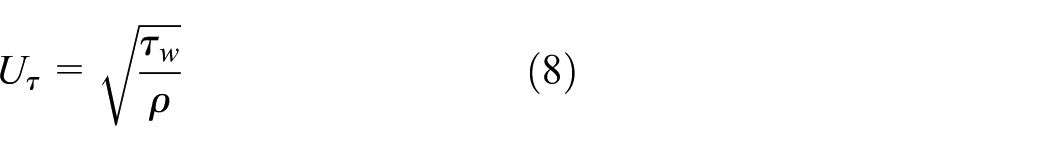
Calculating the first layer thickness

where Re is the Reynolds number,
In this article, the air density ρ = 1.205 kg/m3 at 20°C, the dynamic viscosity of air μ = 1.81 × 10⁻⁵ kg/(m·s), the characteristic velocity of flow u = 30 m/s, the characteristic length of car L = 4.612 m, the inflow velocity U∞= 30 m/s and the wall distance y+ = 35. According to equations (5)–(9), Re = 9.21 × 10⁶ and y = 0.45 mm.
The flow field near the front and rear regions of car and wheels was the focus of this study. So, the density boxes were needed setting to refine the grids in these regions. Three gradually encrypted density boxes were set up from the wall of computational domain to body to achieve the transition of grids from large to small. The grid refinement strategy behind the body was to capture the dissipation of wakes. Bosses of 8 mm height were set up where the tyres were in contact with the ground to improve the element quality and simulate the tyre load-bearing deformation.48,49 Grid refinement strategy is shown in Figure 4.

Diagram of grid refinement strategy.
Hexahedral structured grids were adopted near the wall of the virtual wind tunnel, while tetrahedral unstructured grids were carried out by centre interpolation method around the body. 50 Triangular prism grids were stretched out in parallel in the surface of the body and wheel to meet the requirements of the wall function and simulating the boundary layer in the body surface accurately. There were three layers of the grids in the boundary layer with the first layer height 0.45 mm and the growth rate 1.2. 51 Smooth and swap the poor-quality grids based on the quality and skewness. Use the mesh-smooth function to smooth and optimize grids. The number of grids for fluid calculation was 5.256 million, and the finite element model is shown in Figure 5.

Computational domain with grid.
Boundary conditions
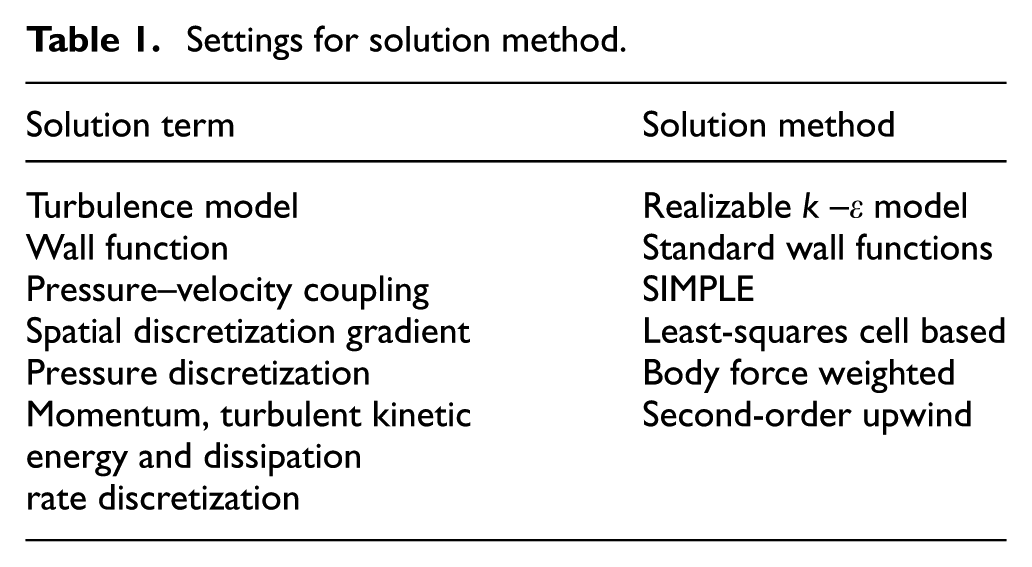
The non-coupled implicit algorithm based on pressure-based solver was used to perform the numerical calculation for steady state. 52 Settings for solution method are shown in Table 1.
Settings for solution method.
The ambient temperature was set to 293 K (20°C), and the turbulence intensity at the velocity inlet was selected to be I = 0.2% based on the experience of the wind tunnel test. Settings for boundary conditions of computational domain are shown in Table 2.
Settings for boundary condition parameters.

Aerodynamic roughness height is the height where the average wind speed on the object surface reduces to zero. Roughness height and roughness constant are two comprehensive mechanical parameters that characterize the aerodynamic characteristics of the object, influencing flow pattern, flow regime and blockage force on the object surface. Roughness settings for computational domain boundaries are shown in Table 3.53–55
Roughness settings for boundaries.

Validation of wind tunnel test data
The DrivAer standard generic model has different modular components for researchers to combine different configurations. For example, the chassis can be selected in detail (D: detailed) or smooth (S: smooth). Rear-view mirrors can choose to keep (wM: with mirrors) or cancel (woM: without mirrors). Wheels can choose to keep (wW: with wheels) or cancel (woW: without wheels). Ground conditions can choose moving ground (with GS: ground simulation) or stationary ground (woGS: without ground simulation). The aerodynamic drag coefficient of DrivAer model with different configurations in the wind tunnel test is shown in Figure 6. 42

Wind tunnel test data of DrivAer model.
The finite element model was imported into ANSYS FLUENT 14.0 for solving. The comparison between the simulation value of aerodynamic drag coefficient of the DrivAer standard model and the wind tunnel test value is shown in Table 4.
Comparison of the coefficient of DrivAer model.

The simulation value of aerodynamic drag coefficient is only 0.40% difference from that of wind tunnel test, which shows that the numerical simulation is accurate, and the virtual wind tunnel can simulate the flow field of DrivAer model.
However, the distribution of the pressure coefficient in different planes between experiments and simulations should be discussed to verify the correctness of the CFD simulation results.42,56 The pressure coefficient cp is non-dimensional, and the area between the x-axis and the cp-curve describes the vertical lift forces, respectively, acting on the upper and lower surfaces of a car.
As shown in Figure 7(a), the z = 150 mm plane which runs approximately through the stagnation point with 21 measurement locations is used for measuring the pressure of the side positions of the car. The symmetry plane of the DrivAer model is also equipped with probes, which are at the top and bottom of the DrivAer model, respectively, to measure the pressure of the symmetry plane, as shown in Figure 7(c) and (d).

Distribution of the pressure coefficient of the DrivAer model. (a) Distribution of pressure taps in the z = 150 mm plane of the DrivAer model. (b) Distribution of the pressure coefficient in the z = 150 mm plane of the DrivAer model with and without mirrors. (c) Distribution of the pressure coefficient in the symmetry plane at the top of the DrivAer model with and without mirrors. (d) Distribution of the pressure coefficient in the symmetry plane at the bottom of the DrivAer model with and without mirrors.
As shown in Figure 7(b)–(d), the pressure coefficient of both the DrivAer configuration models (FSwoMwW with GS and FSwMwW with GS) is calculated. The values obtained experimentally and numerically coincide well with the DrivAer model with mirrors. When the DrivAer model is without mirrors, the pressure coefficient in different planes is in qualitative agreement with the experimental and the simulation results of the DrivAer model with mirrors. This means mirrors have little influence on the pressure coefficient in the three planes, because mirrors are far away from the three planes. Mirrors also have little influence on the flow field of wheels.
The distribution of the pressure coefficient in different planes of simulations coincides well with experiments, although some pressure coefficients are not exactly the same as the experiments. The numerical simulation is accurate, and the virtual wind tunnel can simulate the flow field of the DrivAer model.
Pre-processing for assembled wheel CFD analysis
Adding brake discs and replacing wheels
To study the influence mechanism of wheel structure on the convective heat transfer performance of brake discs, a ventilated brake disc was selected and the brake disc model was established, 34 with the three-dimensional (3D) geometric model shown in Figure 8.

Geometric model of brake disc.
The wheels in DrivAer model were replaced with the assembled wheels and the brake discs were added. The heat dissipation fin of ventilated brake disc was the main region of convective heat transfer and required a grid of encryption. The finite element model of the DrivAer model after replacing the wheels and adding the brake discs is shown in Figure 9.

The finite element model of DrivAer after reconfiguration.
Boundary conditions of the brake disc
The material of the brake disc was grey iron (HT250). The parameters of the brake disc needed to be defined in heat transfer calculation in FLUENT, as shown in Table 5.
Parameters of the brake disc.

The heat dissipation performance of the brake disc was studied in braking with downhill constant speed condition. The boundary conditions of brake disc in computational domain when the speed u = 30 m/s are shown in Table 6. 57
Boundary condition settings of the brake disc.

The pre-processing was carried out using the same settings such as meshing strategy, boundary conditions and solving algorithm as above with the number of grids 5.45 million for flow field calculation. The calculation was performed in ANSYS FLUENT 14.0 with the energy equation on.
Analysis of CFD simulation results for assembled wheel
y+ validation of wall grids
y + of the first-layer grids near the wall is required to satisfy 30 < y+ < 300 for the standard wall-function method. Figure 10 shows the y+ value of the DrivAer surface grids after replacing the wheels and adding the brake discs at a speed of 30 m/s.

y + value of first-layer grids in body boundary layer.
As shown in Figure 10, the y+ value is around 34, while it was estimated to be y+ = 35 when calculating boundary layers’ first-layer thickness in the article. It can be seen that grids near the body wall satisfy the standard wall-function requirement for y+ value and the flow characteristics of the wall boundary layer can be truly reflected by numerical calculation of the flow field.
Flow field analysis for car
The aerodynamic drag coefficient of the DrivAer model Cd is 0.2332 after replacing the wheels and adding the brake discs. The increase in the aerodynamic drag coefficient of the car is related to replacing the wheels and adding the brake discs. The performance parameters of the vehicle flow field are shown in Figure 11.

Parameter distribution of vehicle flow field: (a) vortex core region; (b) contour of dynamic pressure; (c) pressure of flow field; (e) turbulent kinetic energy of car; and (f) turbulent dissipation rate of flow field.
In the curve graphs of flow field pressure and turbulent dissipation rate in Figure 11(c) and (f), the coordinate of the front body X1 is 0.808 m, front wheel centre X2 is −0.007 m, rear wheel centre X3 is −2.793 m and the rear body X4 is −3.805m.
As shown in Figure 11(a)–(c), the airflow impinges on the front of the car, the front windshield and the front of the wheels to form a positive pressure region, which forms the main aerodynamic drag of car. The airflow forms the negative pressure region when passing through the body, and the airflow separation in the negative region can cause generation, rotation and detachment of vortexes, which will consume a lot of energy and increase aerodynamic drag of car.
When the airflow impinges on the car, the radiator grill location bears the maximum pressure. Then, the pressure drops swiftly as the flow accelerates over the radiator grill and gains steadily over the bonnet of the car. As the flow is backed up at the junction between the bonnet and windshield, the pressure reaches a local maximum after which the pressure decreases again over the windshield. When the flow passes through the underbody, the bottom and z = 150 mm plane of the car both become negative pressure regions, which include an additional pressure loss, approximately at the front wheels. While the flow detaches at the edge between the roof and the backlight, the pressure does not reach the ambient pressure behind the car. Therefore, the rear negative pressure region is formed.
As shown in Figure 11(c), (e) and (f), the turbulent kinetic energy k and the dissipation rate
The turbulent kinetic energy and dissipation of the radiator grill and windshield flow field lead to large energy consumption, which is the same as the positive pressure region to form the main aerodynamic drag of car. The rotating front and rear wheels also influence the flow field of the car, which can change the aerodynamic drag of the car. The flow detaches both at the front and the rear wheels. The maximum velocity and turbulent kinetic energy are in the front wheel region, and its vortex cores are the most. This leads to the aerodynamic drag of the front wheels larger than the rear wheels.
As shown in Figure 11(a), (b) and (d), the different pressure between the inlet and the outlet of the wheel cavity causes the external airflow to be introduced into the wheel cavity, and the airflow forms vortex cores with the rotation of the wheel, part of which overflows to affect the external flow field. These lead to energy dissipation and an increase in drag.
Flow field analysis for wheel cavity
The rotating front and rear wheels have a significant influence on the vehicle flow field, and the turbulence intensity of the wheel cavity is shown in Figure 12.
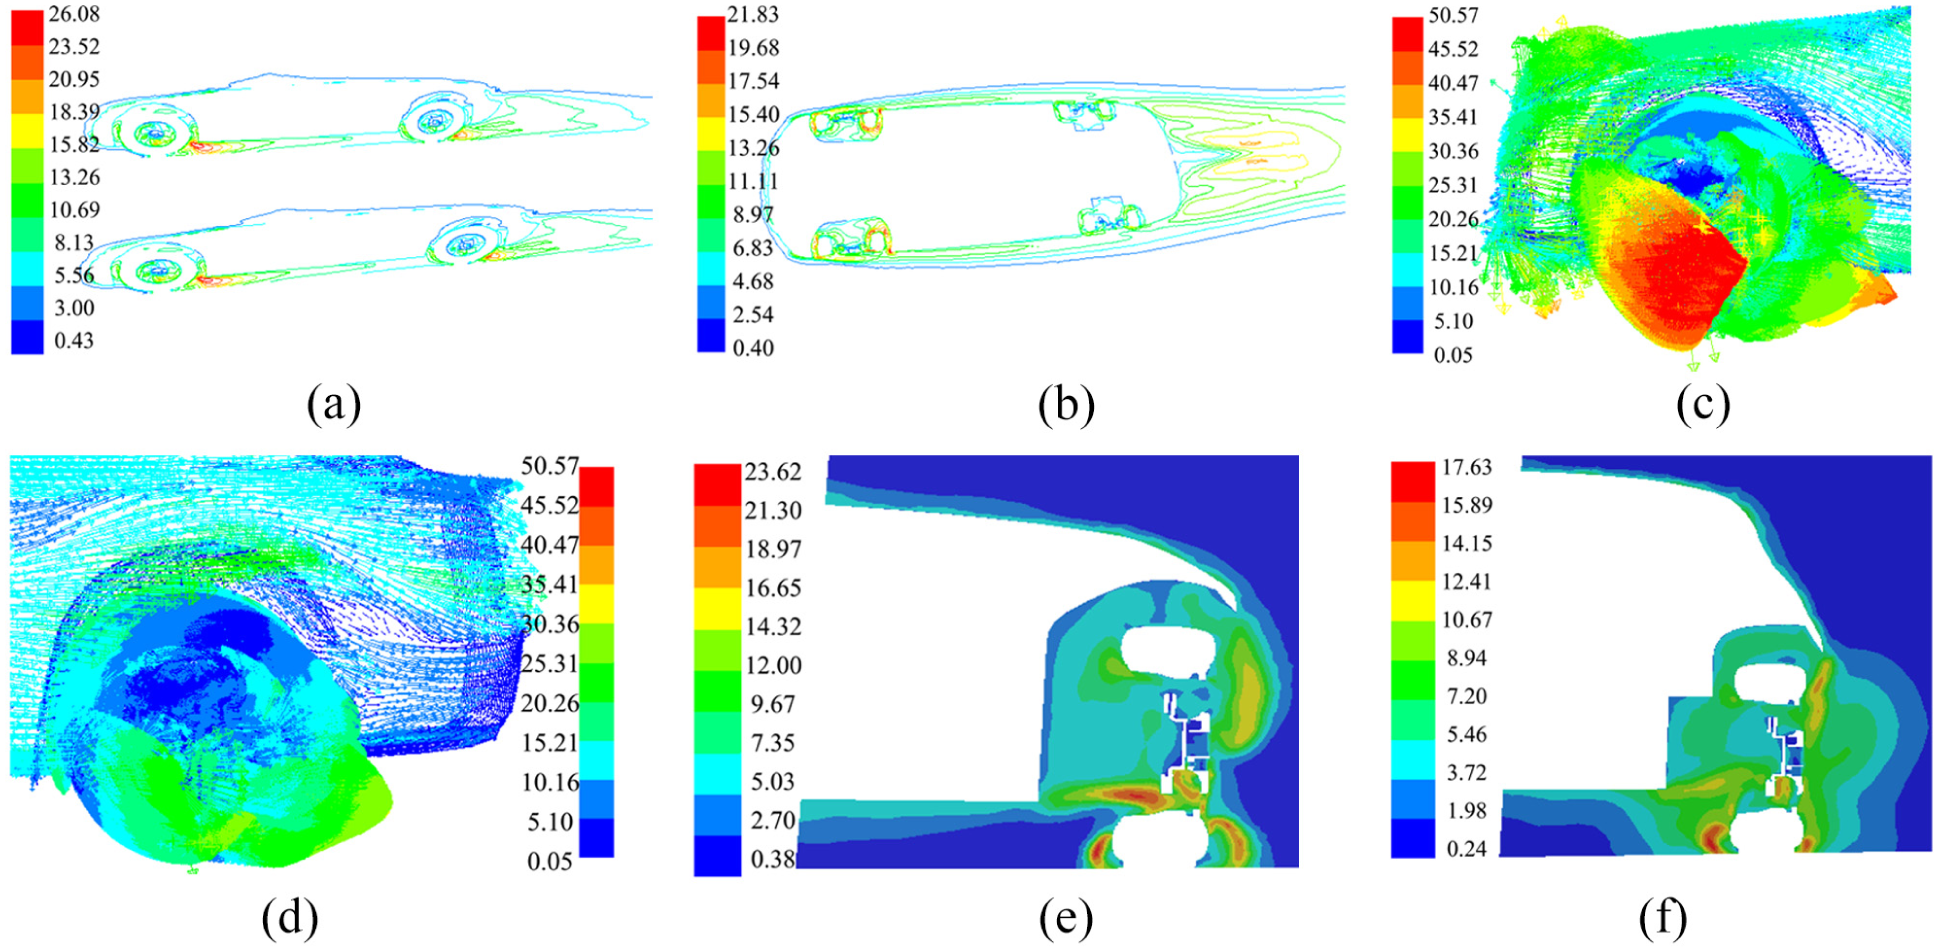
Contour of turbulence intensity in wheel cavity: (a) isogram in y-direction cross-section of wheels; (b) isogram in z-direction cross-section of wheels; (c) velocity vector of front wheel; (d) velocity vector of rear wheel; (e) contour in x-direction cross-section of front wheel; and (f) contour in x-direction cross-section of rear wheel.
As the entire back window yields a large area of pressure recovery, the flux separates at the trailing edge. In the wake, two free shear layers emerge at the rear and roll up into two vortices. As shown in Figure 12(a) and (b), the downward flow in the top of the body and the rolling-up flow in the bottom form two wake vortexes in the rear rotating around their vortex cores and separating in the opposite of the driving direction. During this process, there is a back flow phenomenon resulting in a large amount of energy loss. There are many vortices formed in the front and rear wheel region. All these regions have high turbulence intensity.
As shown in Figure 12(c) and (d), the flow velocity of the front wheel is much larger than that of the rear wheel. The airflow entrained into the wheel cavity due to negative pressure and rotation of the wheel forms a strong turbulence at the bottom of the wheel, part of which enters the bottom of the body and the other part of which overflows from the outside of the wheel. Airflow where the front and rear wheels are off the ground forms the vortex which rotates around its vortex core and separates. To reduce the aerodynamic drag coefficient of the car, vortex systems inside the wheel cavity should be decreased, and the turbulence intensity and interference between overflow vortex and external flow field should also be weakened.
As shown in Figure 12(e) and (f), when airflow entrains into the wheel cavity, vortex systems inside the wheel cavities are formed, especially in the front wheel cavity. The vortex systems at the bottom of the wheel cavity are more than the top, and its turbulence intensity is larger, which is beneficial to the heat transfer performance of the brake disc but it is not conducive to the reduction in the aerodynamic drag coefficient of the car. Turbulence intensity in front wheel is 23.02% and that in rear wheel is 17.63%. Turbulence intensity in front wheel is bigger due to the direct impact of airflow. The rear wheel has a large influence on the airflow in the rear of the body.
As shown in Figure 13, aerodynamic drag of car is 253.58 N, of which pressure drag accounts for 90.29% and viscous drag 9.71%. Front wheel aerodynamic drag accounts for 18.58%, while rear wheel aerodynamic drag accounts for 9.92%.

Aerodynamic drag distribution.
Analysis of heat transfer performance of the brake disc
The surface convective heat transfer performance of the brake disc is determined by the airflow around the wheel. The brake discs’ temperature and surface convective heat transfer coefficient are shown in Figure 14 and Table 7.
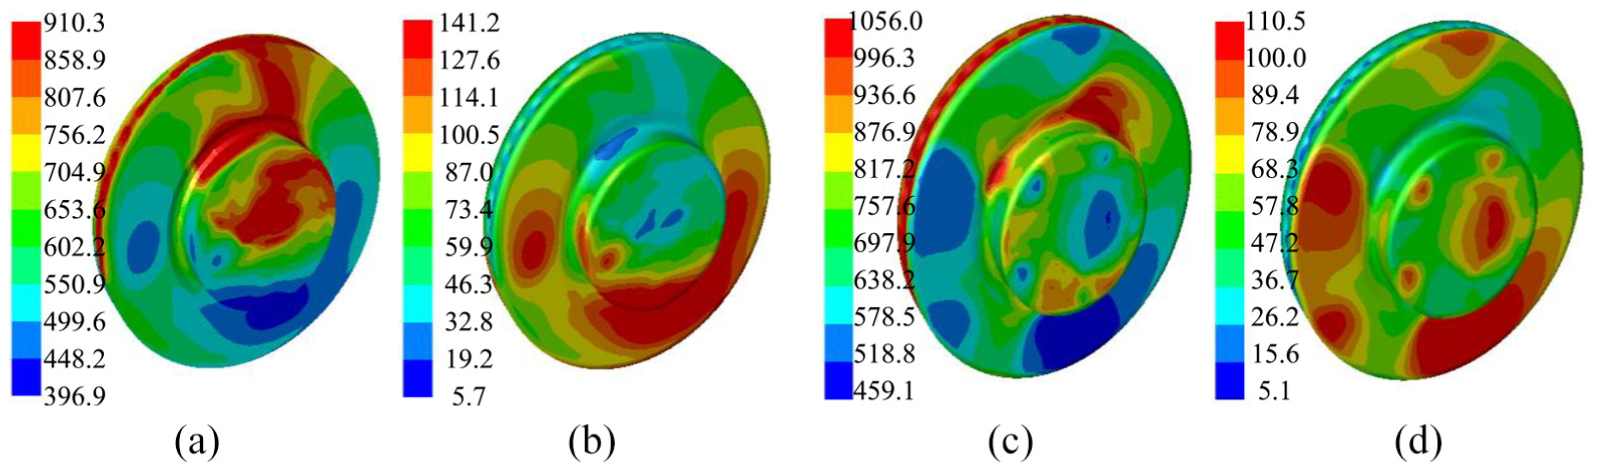
Contour of temperature and surface convective heat transfer coefficient of brake discs: (a) temperature of front brake disc; (b) surface convective heat transfer coefficient of front brake disc; (c) temperature of rear brake disc; (d) surface convection heat transfer coefficient of rear brake disc.
Average temperature and surface convective heat transfer coefficient of brake discs.
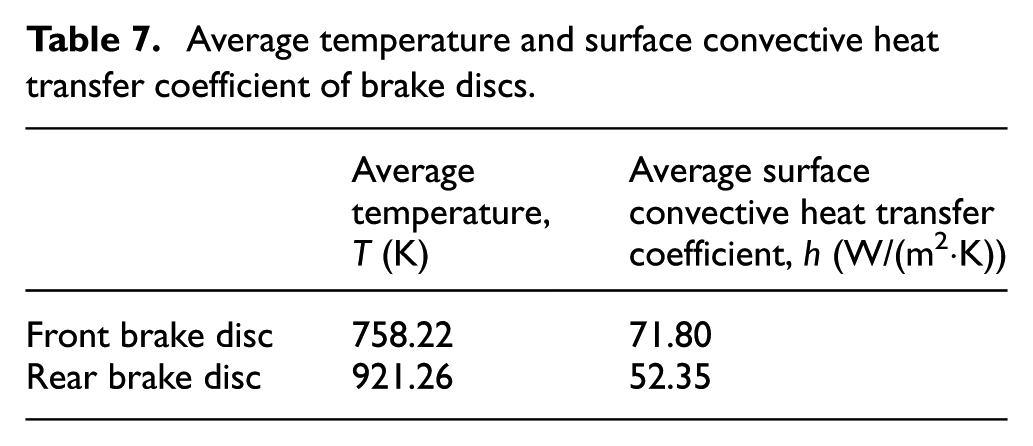
Combined with the above analysis and the flow field near the wheel, the bigger the turbulence intensity and the airflow velocity, the better the heat transfer performance of the brake disc. The surface convective heat transfer performance of the front brake disc is better than that of the rear brake disc, and the surface convective heat transfer performance where it is at the bottom of the brake disc and in the surface near the wheel is better.
By optimizing the wheel structure, the impact of the airflow on the side of the car on the rotating wheels can be reduced. This can reduce the form drag, interference drag and friction drag, and the airflow into the wheel cavity can also be reduced. Then, vortex systems inside the wheel cavity are decreased, and the turbulence intensity and interference between overflow vortex and external flow field are weakened.
What’s more, the optimized wheel used as the rear wheel can reduce the interference between the vortex near wheel cavity and the wake vortex. It weakens the intensity of wake vortex and moves it backwards. This can reduce the aerodynamic drag caused by the wake vortex and the negative pressure in the rear of the body.
CFD analysis of different wheel structures
Wheels with different disc structures were replaced in the DrivAer model, and the same CFD analysis pre-processing scheme as above was adopted. Simulation analysis was carried out using ANSYS FLUENT 14.0 to study the influence of wheel disc on the aerodynamic drag of car and the heat transfer performance of the brake disc.
Number of spokes with the same disc opening area
The commonly used 5-, 6-, 7-, 8- and 10-spoke wheels were selected, and the wheel disc opening area was designed to be 29,927 mm. 2 Wheel models are shown in Figure 15.
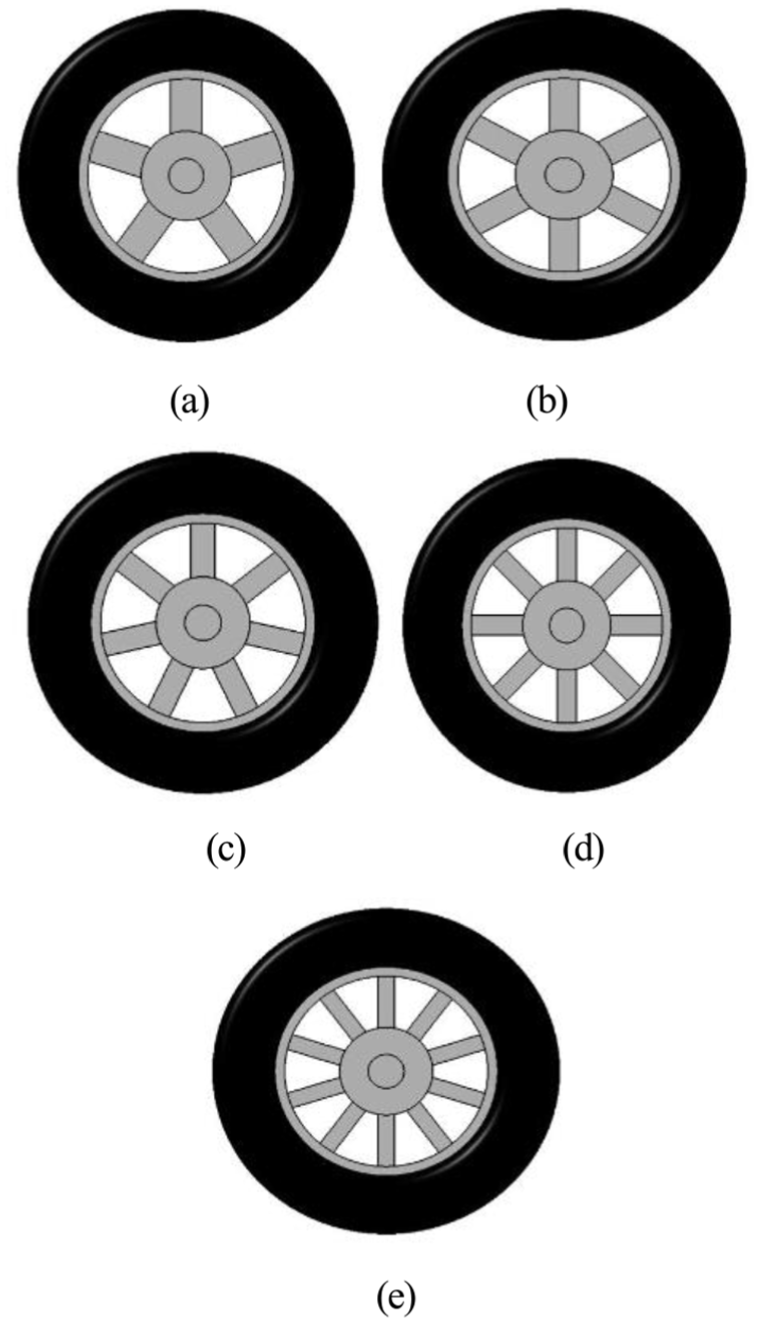
Wheel models with different number of spokes: (a) 5, (b) 6, (c) 7, (d) 8 and (e) 10.
The aerodynamic drag coefficient of the car and the average surface convective heat transfer coefficient of the brake discs for each wheel are shown in Figure 16. With the wheel disc opening area unchanged and the increase in the number of spokes, the aerodynamic drag coefficient of the car increases slightly but changes little, while the average surface convective heat transfer coefficient of the brake discs decreases significantly.

The aerodynamic drag coefficient of car and the average surface convective heat transfer coefficient of the brake discs with different number of spokes.
The turbulent kinetic energy, turbulence intensity and the energy dissipation rate near each wheel are close, and therefore there is no great change due to the change in the number of spokes. For wheels with fewer spokes, there are larger holes between spokes so that concentration of airflow from the outside flow field into the wheel cavity makes the velocity of airflow near the whole brake disc higher, heat dissipation effect better and the average surface convective heat transfer coefficient of the brake discs larger. With the increase in the number of spokes, the number of holes between spokes increases but each area decreases, the airflow passes through the wheel dispersedly with the flow intensity and flow velocity decreasing, which is not conducive to heat dissipation of the brake disc. Therefore, under the condition that the wheel disc opening area remains the same, the change in the number of spokes has little influence on the aerodynamic drag of car. The average surface convective heat transfer coefficient of the brake discs decreases as the number of spokes increases.
Spoke styles with the same disc opening area
On the basis that wheel disc opening area was 29 927 mm2, six kinds of wheels with different spoke styles were designed to carry out the comparative analysis to study the influence of spoke styles on the aerodynamic drag of car and the heat transfer performance of the brake disc. The wheel models rotate counterclockwise, as shown in Figure 17.

Wheel model with different spoke styles.
The aerodynamic drag coefficient of the car and the average surface convective heat transfer coefficient of the brake discs for the wheels with different spoke styles are shown in Figure 18. Spoke styles with low aerodynamic drag coefficient of the car are f, e and b in turn, and the spoke styles of the three wheels are characterized by that the closed area at the top of the spoke which is connected with the rim is large while that at the bottom of the spoke which is connected with the hub is small. Since the brake disc has covered the opening at the bottom of the spoke, the closed area at the bottom of the spoke has little effect on the airflow into the wheel cavity and turbulence intensity. While that closed area at the top of the spoke is large can directly reduce the airflow into the wheel cavity, reduce the vortex systems inside the wheel cavity, weaken turbulence intensity and the energy dissipation, which reduces the aerodynamic drag coefficient of the car, but increases convective heat transfer performance of the brake disc.

The aerodynamic drag coefficient of car and the average surface convective heat transfer coefficient of the brake discs with different spoke styles.
What’s more, when the wheel rotates counterclockwise, the spoke of the wheel d has a tilted diversion surface on the windward side, reducing the airflow outside the wheel flow field into the wheel cavity, and the aerodynamic drag coefficient of the car is smaller relative to the wheel c while the average surface convective heat transfer performance of the brake discs decreases greatly.
Disc opening area with the same number of spokes
In the earlier structural strength study, after topology optimization, the assembled wheel with five spokes has better performance. Also, the number of spokes for the five-spoke wheel is small, and the space of size variation is large, which is advantageous to set multiple groups of models to compare. Therefore, the spoke widths of the five-spoke wheel were designed, respectively, to be 100, 85, 70, 55, 40 and 25 mm, as shown in Figure 19.

Five-spoke wheel models with different spoke widths: (a) 100 mm, (b) 85 mm, (c) 70 mm, (d) 55 mm, (e) 40 mm and (f) 25 mm.
The aerodynamic drag coefficient of the car and the average surface convective heat transfer coefficient of the brake discs for five-spoke wheels under different disc opening areas are shown in Figure 20. Under the condition that the number of spokes remains unchanged, with the increase in the disc opening area, the aerodynamic drag coefficient of the car increases first and then decreases, while the convective heat transfer coefficient of the brake disc increases gradually.

Aerodynamic drag coefficient of car and average surface convective heat transfer coefficient of brake discs under different disc opening area.
With the increase in the disc opening area, the airflow into the wheel cavity increases, the vortex systems and the turbulence intensity increase to generate a large amount of energy dissipation, which increase the aerodynamic drag coefficient of the car and the average surface convective heat transfer coefficient of the brake discs. When the disc opening area increases to a certain value, the influence of the disc on the flow field near the wheel cavity gradually weakens, therefore the aerodynamic drag coefficient of the car decreases.
Parametric modelling for assembled wheel
In order to enhance the deformability of the wheel to study the relationship between the different wheel structure and aerodynamic performance, adopt the design of experiments (DOE) sampling and make the multi-objective optimization design, the wheel model needed to be parameterized.58,59
The wheel shall meet the test requirements of Performance requirements and test methods of passenger car wheels (GB/T 5334-2005) and Road vehicles-Light alloy wheels-Impact test procedure (GB/T 15704-2012). Through the author’s early analysis and test verification, the requirements of the wheel strength, stiffness, bending fatigue life, radial fatigue life and 13° impact performance were met as long as the design variables of the assembled wheel were within the scopes specified in Table 8.35,36 The purpose of this article was to study the influence of wheel structure on the aerodynamic drag of a car and the surface convective heat transfer performance of brake discs and optimizing the designed wheel structure based on aerodynamic performance within the scopes of the geometrical parameters in Table 8.
Range of design variables.

Based on mesh morphing technology, the parametric wheel model was established using Sculptor software where 10 thickness variables and 2 shape variables were defined (denoted as x1, x2, …, x12), as shown in Figure 21. The range of values for design variables is given in Table 8. Among them, limited to wheel structure, the variables x4 and x5 were associated, and the variables x10 and x11 were associated, values of which change synchronously.

Wheel design variables and parametric model: (a) diagram of design variables; (b) parametric wheel model.
Multi-objective optimization design for assembled wheel
Surrogate model
To improve the optimization efficiency, a surrogate model was used for multi-objective optimization design. 60 The radial basis function (RBF) surrogate model was used instead of the simulation model to express the relationship between the design variables and the responses.61,62 Uniformly, random sampling was carried out within the range of each design variable according to Hammersley Design. A total of 100 sample points were selected to fit the RBF surrogate model of each response. The accuracy of the surrogate model was verified 63 by the coefficient of determination R2 and the expression of which was

where n is the number of sample points,
The closer the value of R2 is to 1, the higher the fitting accuracy of the surrogate model. In total, 10 additional sample points were selected to verify the accuracy of the surrogate model by Optimal Latin Hypercube Design, and the coefficient of determination R2 of each response is greater than 92%, which meets the fitting accuracy requirement of the surrogate model. The results of the surrogate model accuracy test for each response are shown in Figure 22.

Accuracy of surrogate model: (a) wheel mass (kg); (b) aerodynamic drag coefficient of car; and (c) surface heat transfer coefficient of brake disc (W/(m2·K)).
Multi-objective optimization
The multi-objective optimization for the wheel was carried out combined with the performance index of wheel structural strength. Mathematical model for optimization is
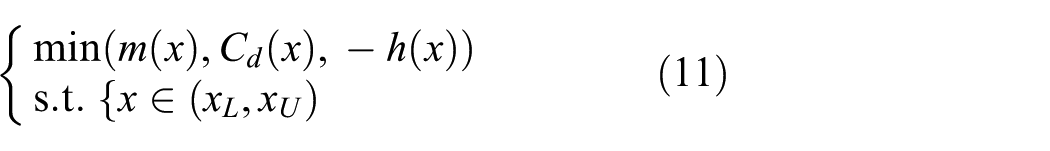
where
The parametric software Sculptor, pre-processing software ICEM and computational software ANSYS FLUENT were integrated into multi-disciplinary optimization design software Isight. The non-dominated sorting genetic algorithm II (NSGA-II) was selected to establish the multi-objective optimization design platform for wheel based on RBF surrogate model, as shown in Figure 23.

Multi-objective optimization design platform.
Optimization result analysis
With 40 population and 200 generations, it generated 8001 optimization solutions using the surrogate model. The Pareto frontier after optimization is shown in Figure 24.

Pareto frontier after optimization design.
As shown in Figure 24, the monotonicity of the three objective functions: wheel mass, average surface convective heat transfer coefficient of the brake discs and aerodynamic drag coefficient of the car is complicated. This is because the design variables defined to include not only the thickness variables but also the shape variables, and they can be transformed into each other. The values of the three objectives are determined by the changes of two kinds of variables. Taking the minimum of the wheel mass and the maximum of average surface convective heat transfer coefficient of brake discs as the preferential consideration, a compromise solution is selected at the Pareto front, as shown in red dot in Figure 24. The comparison of design variables and the response values before and after optimization are shown in Tables 9 and 10, respectively.
Values of design variables before and after optimization.

Comparison of response values before and after optimization.

As shown in Table 10, the wheel mass decreases by 8.28% compared with the initial, the aerodynamic drag coefficient of car decreases by 3.17% and the average surface convective heat transfer coefficient of the brake discs increases by 9.31%. Within the range of design variables, performance indexes of the wheel structural strength can meet the design requirements. The mass of
Conclusion
The positive pressure region is the main reason for the formation of the aerodynamic drag, while the airflow separation in the negative pressure region will cause the vortex to generate, rotate and detach. The aerodynamic drag of front wheel is bigger than that of rear wheel, while the rear wheel has a great influence on the flow field in the rear body.
By optimizing the wheel structure, the impact of the airflow on the side of the car on the rotating wheels can reduce, vortex systems inside the wheel cavity can decrease and interference between overflow vortex and external flow field can be weakened. The optimized wheel used as the rear wheel can reduce the aerodynamic drag caused by the wake vortex and the negative pressure in the rear of the body.
The greater the turbulence intensity and the airflow velocity, the better the heat transfer performance of the brake disc. The surface convective heat transfer performance of the front brake disc is better than that of the rear brake disc, and the surface convective heat transfer performance at the bottom of the brake disc and in the surface near the wheel is better.
With the total disc opening area of the wheel unchanged, the change in the number of spokes has little effect on the aerodynamic drag coefficient of the car. While with the number of spokes increasing, the average surface convective heat transfer coefficient of the brake discs decreases. Under the same conditions, a wheel with large closed area at the top of the spoke can reduce the aerodynamic drag coefficient of car, but increase the average surface convective heat transfer performance of the brake discs. Under the condition that the number of spokes remains unchanged, with the increase in the disc opening area, the aerodynamic drag coefficient of the car increases first and then decreases, while the average surface convective heat transfer coefficient of the brake discs increases gradually.
Based on the mesh morphing technology, DOE sampling, surrogate model theory and NSGA-II algorithm comprehensively, the multi-objective optimization design of wheel was carried out to obtain the Pareto frontier. A compromise solution was selected. The lightweight design of wheel based on the aerodynamic drag of the car and the average surface heat transfer performance of the brake discs under the constraints of structural strength is realized, providing a theoretical and technical basis for the multi-disciplinary and multi-objective optimization design of the wheel.
Footnotes
Appendix 1
Handling Editor: James Baldwin
Declaration of conflicting interests
The author(s) declared no potential conflicts of interest with respect to the research, authorship and/or publication of this article.
Funding
The author(s) disclosed receipt of the following financial support for the research, authorship and/or publication of this article: This research work was supported by the National Natural Science Foundation of China (grant no. 51475201).