
Abstract
In order to study the fatigue performance of wheel and enhance its lightweight design level, this article proposes the structure, design and optimization method of magnesium-aluminum alloy assembled wheel. Taking a
Keywords
Introduction
Lightweight is an effective measure to achieve energy saving and emission reduction and enhance sustainable performance of automobiles, and wheels are important parts of vehicles, which are related to the power, braking and comfort of automobiles.1,2 Generally, wheels work under random alternating load, fatigue life is an important performance of wheels. From a safety point of view, in order to ensure the safety of vehicles, the wheels must have sufficient strength, stiffness and fatigue durability. Wheels usually develop small local cracks due to fatigue, which extend to sudden fracture. The actual situation shows that fatigue damage occupies an important proportion in the wheel damage. Therefore, the fatigue life of the wheel is an important performance to ensure driving safety. 3 Therefore, wheel lightweight is a multi-objective optimization design engineering. It is of great significance to construct a set of effective multi-objective optimization design methods for wheel lightweight and fatigue performance.
Wheel lightweight is closely associated with energy saving, environmental protection and improving the overall performance of automobiles, which is the central factor to enhance the competitiveness of automotive products. Scholars have done a lot of research work on it. In terms of materials, Guiju et al. 4 designed an aluminum alloy wheel with allowable stresses and intrinsic frequencies that met the requirements, and the wheel weight was reduced by 13.9%. Jiang et al. 5 designed a wheel structure and established a finite element model of the wheel by combining radial and bending tests. By comparing the finite element analysis results of different materials, it can be known that the magnesium alloy wheel has the smallest equivalent stress, its numerical value is 46.46Mpa in the radial test, and its numerical value is 58.57Mpa in the bending test, which are smaller than the yield of the material stress. Considering stress, weight and deformation, magnesium alloy is more suitable for lightweight design of wheels than other materials. Czypionka and Kienhofer 6 replaced the aluminum wheels with carbon fiber, reducing the weight by 18%. Gardie et al. 7 used fiber-reinforced composite wheels to replace structural steel wheels and carried out numerical analysis. The results showed that the Von-Mises stress was reduced by 31.5% and the weight was reduced by 80.4%.
For fatigue performance analysis, Loi and Choy 8 carried out fatigue analysis of 6061-T6 wheels using finite element method, involving Von-Mises stress, deformation, safety factor and life cycle. Tebaldini et al. 9 proposed a prediction model for A356-T6 wheels, which can determine the stress at the maximum defect size through the number of cycles. Li et al. 10 studied the fatigue and deformation behavior of a newly developed Mg-2.96Nd-0.21Zn-0.39Zr magnesium alloy wheel under as-cast and T6 conditions. Zhao et al. 11 conducted strain control fatigue tests on the rim and wheel disk of the extrusion AZ80 wheel, providing a reliable theoretical basis for the anti-fatigue design of magnesium alloy automobile wheels. Hunady et al. 12 used finite element method to simulate rotary bending test of pneumatic wheels, including linear static analysis and fatigue analysis of pneumatic wheels. Dong et al. 13 established an effective method to predict the fatigue life of vehicle wheels in the fatigue test of accelerated dynamic turning, and the fatigue life error predicted by this method is 29%. Duan et al. 14 proposed a new multi-scale biaxial fatigue simulation method, which laid a solid foundation for optimal design and big data fatigue prediction of aluminum alloy wheels.
In terms of wheel optimization design, Jiang et al. 15 optimized the structure design of magnesium alloy wheel, which not only realized the weight reduction of wheels but also optimized the dynamic impact performance. Xu et al. 16 combined reverse modeling technology with topology optimization method, derived lightweight wheels according to mechanical principles and the wheel mass was reduced by 12.7%. Wang et al. 17 designed a dissimilar steel assembly wheel with B500CL inner rim and Q345B outer rim, in which inner and outer rims are connected by bolts. The wheel not only met the fatigue life requirements, but also reduced the weight by 9.37%. Wang and Xu 18 conducted fatigue failure analysis and multi-objective optimization of the bolted/bonded MG-Al alloy assembly wheel, and the fatigue lives of the spokes and connecting bolts reached 529,000 and 208,000 cycles respectively after optimization. Adopted an integrated multi-objective topology optimization method was adopted, Zhang et al. 19 designed the optimized wheel to meet the requirements of natural frequency and improve the impact resistance. Pang et al. 20 established a response surface multi-objective optimization model based on the fatigue life results. The weight of aluminum alloy wheel is reduced by 13.85% and the first-order modal value is increased by 7.6%. Hu et al. 21 used Sigma Principle to perform an uncertainty optimization analysis of the wheel design based on the finite element simulation results of wheel bending fatigue, and the weight of the optimized long glass fiber reinforced thermoplastic wheel was reduced by 5.5%.
The multi-objective optimization design is often implemented by combining a surrogate model as well as a multi-objective optimization algorithm. NSGA-II is one of the most popular multi-objective algorithms at present, and scholars often use NSGA-II to generate Pareto frontiers. NSGA-II is one of the most popular multi-objective genetic algorithms, but in order to allow NSGA-II to better handle multi-objective optimization problems, Nariman-zadeh et al. 22 replaced the congestion distance assignment method with the ε-elimination method. Khalkhali 23 used modified NSGA II for multi-objective optimization of automotive S-rail with absorbed energy, peak crush force and structural mass as three conflicting objective functions. Xiong et al. 24 used modified NSGA-II for multi-objective lightweight and crashworthiness optimization of vehicle body side structure. Wang et al. 25 used mass, maximum von-Mises stress and first-order intrinsic frequency as three conflicting objective functions for the lightweight design of the front subframe of a passenger car using modified NSGA-II.
In multi-objective optimization of objectives, MNSGA-II can provide a large number of the optimal compromise solutions, but how to decide and choose the optimal compromise solution is a difficult problem for designers. Grey relation analysis (GRA) can be used to determine the correlation between the design sequence and the ideal sequence to determine the best scheme. 26 Fang and Chen 27 constructed the wavelet packet energy curvature, and combined with GRA, obtained the grey relation grade of the wavelet. The damage location of the civil structure is determined according to the change in the magnitude of these coefficients, and the effectiveness of the method is verified by experimental steel beams. Jiang et al. 28 performed a multi-objective optimal design of the control arm based on the Kriging agent model and the NSGA-II algorithm, and then determined the optimal design of the control arm from the Pareto solution set using entropy-weighted GRA. Xiong et al. 29 performed a multi-objective lightweight design of the front-end body structure and obtained the optimal compromise solution using entropy-based grey relation analysis, which was validated using TOPSIS. Shan et al. 30 used GRA to optimize the material thickness scheme of the seat components.
Currently, multi-objective optimization is often performed by combining multiple optimization methods to better balance optimal solutions and computational efficiency. Cai and Wang 31 optimized the crashworthiness and lightweight design of S-rail and obtained the best solution by GRA combined with grey entropy measure .YAO et al. 32 used a hybrid method of Taguchi technique, GRA and fuzzy logi to obtain the optimal structural parameters of the beam to enhance the static and dynamic performance of the body-in-prime (BIP). Wang and Cai 33 used MNSGA-II to determine the best combination of design parameters that could improve the body-in-white bending stiffness, torsional stiffness, and low-order intrinsic frequency without a significant increase in mass, and ranked all non-dominated solutions from best to worst using grey entropy theory and GRA to determine the best trade-off solution, and validated with TOPSIS. Wang and Wang 34 used the principle component analysis (PCA) and the GRA method to rank the Pareto solutions for the multi-objective lightweight optimization design of B-pillar outer panel to obtain the optimization scheme. Zhang et al. 35 proposed a hybrid method combining entropy-weighted grey relation analysis (EGRA) and MNSGA-II for lightweight multi-objective optimization of body-in-white for frontal and side crashes.
The above research studies and analyzes the wheel performance from different angles from the aspects of high-strength and lightweight materials, fatigue performance, wheel structure optimization design and multi-objective optimization algorithm, but ignores the manufacturing cost and universality. The maximum structural optimization design is the lowest cost means of wheel weight reduction. The multi-criteria decision-making method based on entropy weight gray relational analysis and the modified of NSGA-II optimization algorithm can greatly improve the lightweight, multi-performance and multi-objective optimization effect of the wheel, but no related methods have been applied to the lightweight design of the wheel.
In this paper, two lightweight materials, magnesium and aluminum, are used in the rim and spoke of the wheel respectively, and an assembled wheel structure is designed. Based on the advanced grid deformation technology, the Pareto frontier solution set is obtained by using the modified non-dominated sorting genetic algorithm-II (MNSGA-II) through the sampling of the optimal Latin hypercube method and the method of contribution analysis and surrogate model. The entropy weighted grey relation analysis (EGRA) method is used to sort the Pareto solution set, and the optimal compromise solution is selected to solve the problem of quantitative sorting of the multi-objective optimization solution set. In this way, the best solution for lightweight wheels can be obtained, and the lightweight and fatigue performance can be improved at the same time, which provides a method and technical basis for multi-objective optimization design of lightweight wheels.
Methodology
Contribution analysis method
According to Global CA, 36 the relationship between performance y and design variable x can be expressed as:

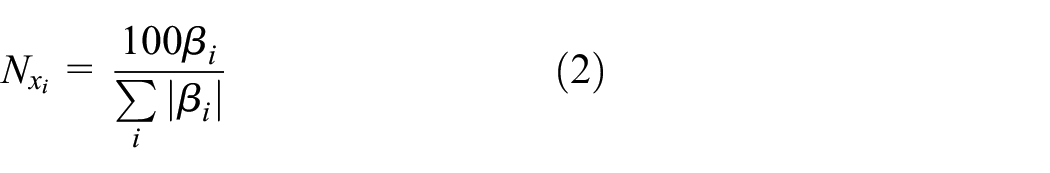
Where xi presents the ith variable; β0, βi, βj, and βij denote the regression coefficients. Then the linear global contribution of a design variable is as follows:
Entropy weight grey relation analysis (EGRA)
Using grey relation analysis based on entropy weight not only retains the advantage of using information entropy to measure index weight, but also gives full play to the advantage of grey relation analysis method. The steps are as follows:
Step1: Normalization
(a) The larger the objective, the better the result

(b) The lower the objective, the better the result

(c) For the objective, T is ideal.

In the formula (3), (4), and (5), xi*(k) and xi (k) are the normalized value and initial value of the objective function in the first scheme (design variable) respectively; k = 1, 2, …, n; i = 1, 2, …, m, m is the number of schemes and n is the number of target functions; mink xi(k) and maxk xi(k) is the maximum and minimum values of the kth objective function in all schemes, respectively; T is a specific value.
Step2: Calculate the grey relation coefficient (GRC)

In the formula (6), Δ0i(k) = |x0*(k)–xi*(k)|, x0*(k) is the normalization value of the kth objective function in the case of an ideal scheme; Δ max and Δ min is the maximum and minimum values of Δ0i(k); ξ, discrimination coefficient, is defined as 0.5 in the article.
Step3: Calculate the weight according to the entropy weight (EW) method

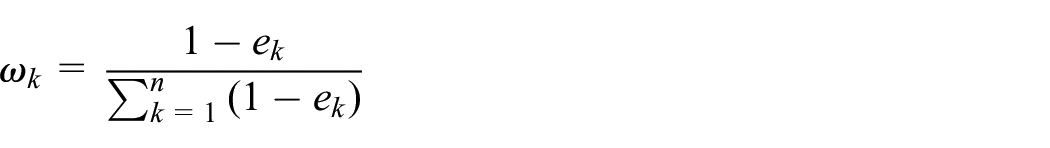

Where e k is information entropy.
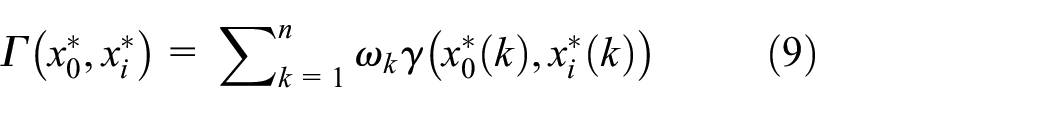
Step4: Calculate the grey relation grade
RBF surrogate model
RBF simulates the relationship between input variables (such as design variables) and responses with linear combinations of radial symmetric functions based on Euclidean distances. 37 As shown in Figure 1.
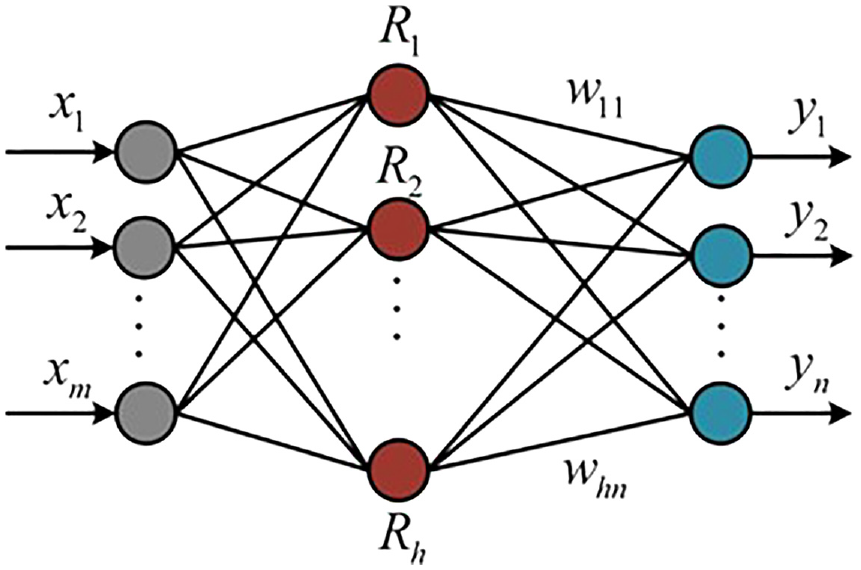
Structure diagram of RBF.
As can be clearly seen in Figure 1, RBF is divided into three main layers, where the input layer is mainly used to introduce variable information, the implicit layer is responsible for mapping the input information to the output layer according to certain mathematical relationships, and the output layer is responsible for weighting the output of the nodes in the implicit layer. It can be expressed as:

Where
Kriging approximate model
Kriging approximate model has high accuracy in solving highly nonlinear problems and is widely used in engineering. 38 The expression is

Where


In formula (12), (13) and (14), E[Z(x)], Var[Z(x)]and cov[Z(xi), Z(xj)] is the expectation, variance and covariance of Z(x), respectively; R is Matrix of correlation; R(xi, xj) is the correlation function between sample points xi and xj, which is usually expressed as a Gaussian function.
Modified NSGA-II
Compared with NSGA-II, MNSGA-II adopts ε-elimination strategy to better manage the population diversity of multi-objective optimization problems. The principle of MNGSA-II algorithm is shown in Figure 2.

The principle of Modified NGSA-II algorithm.
The steps of MNSGA-II algorithm are as follows:
Step1: Generate a parent population Pt with population number N and non-dominated sorting of all individuals in it.
Step2: Selection, crossover and mutation of sorted individuals to produce the next generation of population Qt.
Step3: By merging parent population Pt and child population Qt, a mixed population Rt with population number 2N is obtained, and the individuals of mixed population Rt is non-dominated sorted.
Step4: According to the ε-elimination strategy, bad individuals are removed from the mixed population Rt, and then random individuals are generated to fill the population Rt, so that its population size is still 2N.
Step5: According to the non-dominated sorting standard, the non-dominated sorting operation is performed on the population Rt, and m (m>N) excellent individuals were selected successively from low level to high level. Then, ε-elimination is carried out until the parent population Pt+ 1 with a population number of N is obtained.
Step6: If the termination condition is satisfied, the iteration ends, otherwise the optimization is repeated from step 2 until the non-dominated solution satisfies the termination condition.
Joint topology optimization design of assembled wheel
Conceptual design model of wheel
In this article,

Conceptual design model of wheel: (a) front of wheel model and (b) back of wheel model.
Finite element model based on bending fatigue test
The conceptual design model of wheel was imported into Hypermesh for geometric cleaning and meshed with tetrahedral elements. The element size of both spoke topology space and rim is 5 mm, and the wheel finite element model is discretized into a total of218,613 elements and56,783 nodes. ZK61M magnesium alloy and aluminum alloy 6061 are created and assigned to the rim and spokes respectively. The length of the loading arm is taken as 1 m and the material properties of A3 steel are assigned. The bolt-on connection between the spoke and the loading arm was simulated with RBE2 elements. The material parameters of the wheel and loading arm models are given in Table 1, and the strength parameters of the rim and spokes are given in Table 2.
Material parameters of each part of the wheel and loading arm.

Strength parameters of the rim and spoke.

According to the dynamic bending fatigue test SAE J328 requirements, the six degrees of freedom of the nodes along the outer edge of the inner wheel rim were constrained and a force of 2472 N was applied at the end of the loaded axle. The finite element model of the wheel under bending fatigue test was established, as shown in Figure 4.

Finite element model of wheel based on bending fatigue test.
Finite element model based on radial fatigue test
The wheel conceptual design model was imported into Hypermesh for pre-processing. According to the method requirements of SAE J328, six degrees of freedom of the nodes with five bolt holes were constrained and the cosine pressure with amplitude of 1.76 MPa was loaded within 2θ0 angle of the bead seat, as shown in Figure 5.

Finite element model based on bending fatigue test.
Design of assembled wheel based on joint topology optimization
Under a single fatigue test condition, it is difficult to design a wheel structure that satisfies excellent performance under various working conditions, so we need to perform joint topology optimization on the two working conditions at the same time. Considering the stress distribution under bending and radial working conditions, the topological performance of the spokes is more reasonable. The wheel conceptual design model was imported into Optistruct, and the bending and radial fatigue conditions were added. With the objective of minimizing the wheel mass, the joint topology optimization was performed. Setting the relative density threshold to 0.3, the results of the joint topology optimization are as shown in Figure 6.
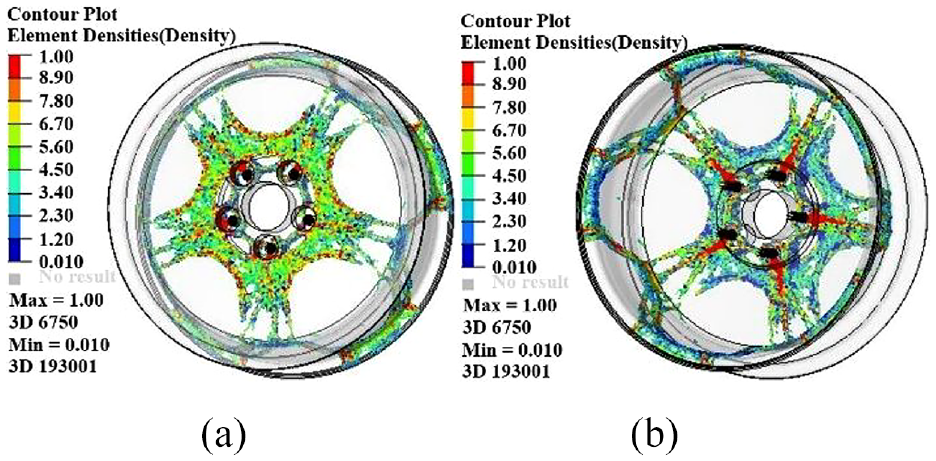
Joint topology optimization results: (a) front of wheel model and (b) back of wheel model.
Modeling of assembled wheel
The 5-spoke wheel topology after the joint topology optimization was imported into the post-processing software Hyperview, and the wheel topology was exported by the OSSmooth tool. After the smoothing process, the wheel 3D model after the joint topology optimization was obtained. According to the dimensions of the geometric model, the 3D model of the assembled wheel after topology optimization was established in UG, as shown in Figure 7.
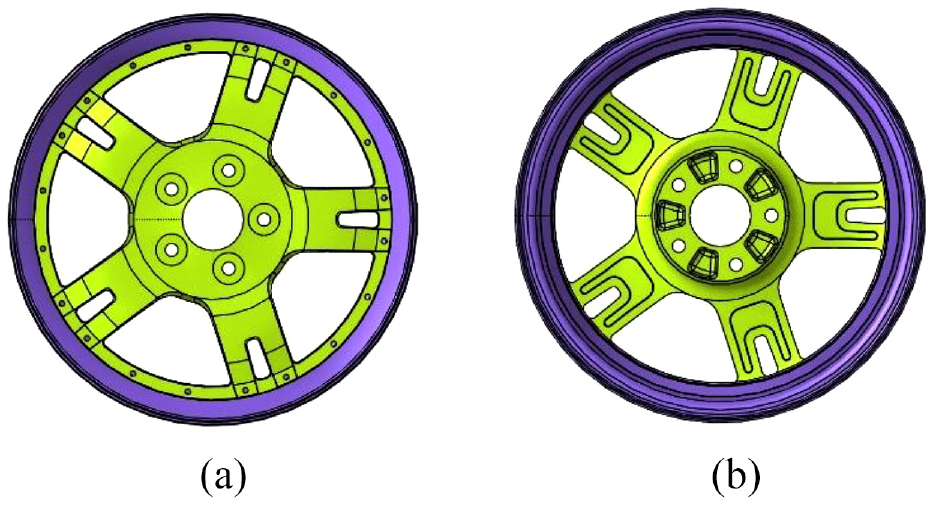
3D model of the assembled wheel: (a) front of wheel model and (b) back of wheel model.
Fatigue performance analysis of assembled wheel
Analysis for bending fatigue performance of wheel
The bolted connection between the rim and spoke was simulated by RBE2 elements. The finite element model for bending fatigue test of wheel is shown in Figure 8. The constraint and loading force magnitude of the finite element model for the wheel bending fatigue condition are basically the same as in Section III.B, taking three typical stress points, the magnitude of the loading force F remains unchanged, and the loading directions are divided into three directions, which are denoted as F1, F2 and F3, and the included angles are 18° in sequence. The simulated loading range of the three forces is 36°, 1/10 wheel force cycle is the key range of wheel force analysis. Among them: the loading force F1 is facing the window, the loading force F2 is in the middle position, and the loading force F3 is facing the spoke.

The finite element model for bending fatigue test of wheel: (a) side of wheel model and (b) front of wheel model.
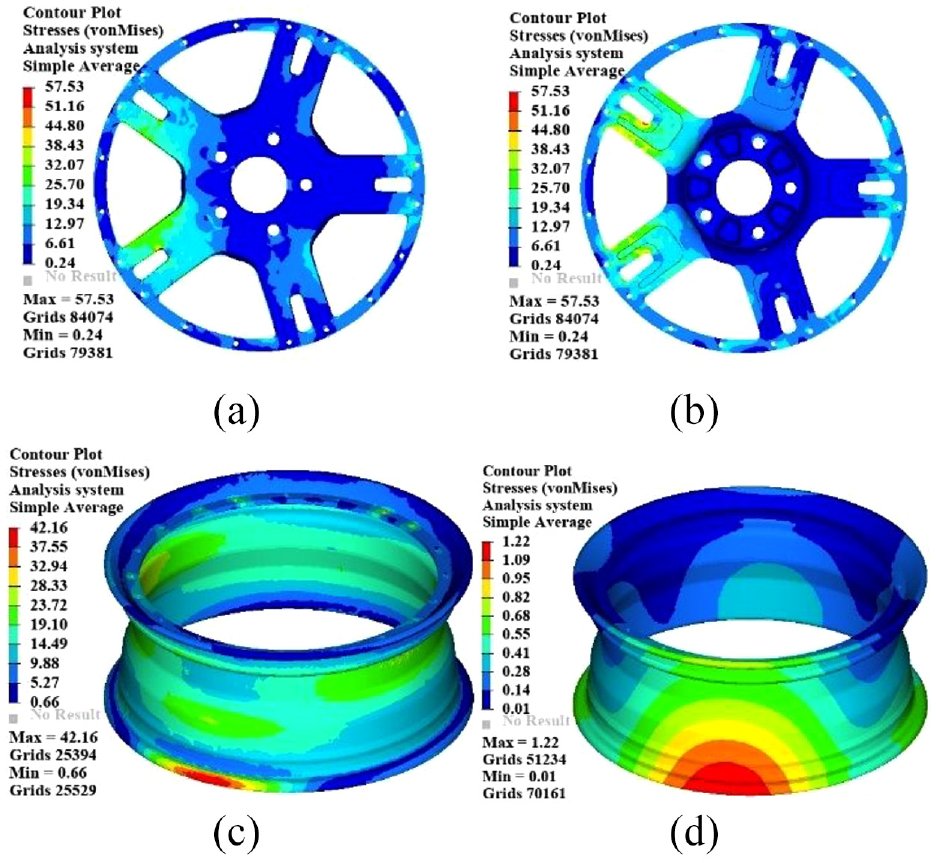
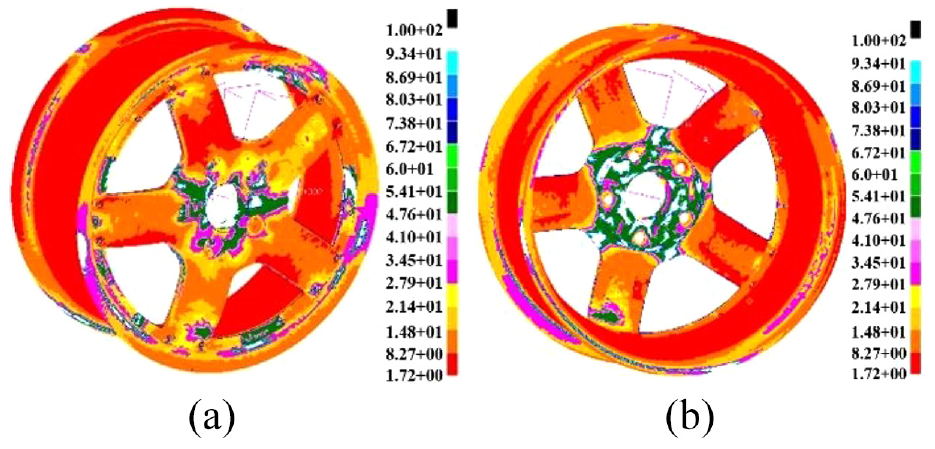
Figure 9 shows that stress distribution and displacement contour of wheel in three condition. The stress of the rim is the highest in F1 condition, which is 125.9 MPa. Under F2 working condition, the wheel displacement in the Z direction is the maximum, which is 0.68mm. In F3 condition, the stress of the spoke, 125.9 MPa, is the highest. This shows that the assembled wheels can satisfy the demand of strength and stiffness.
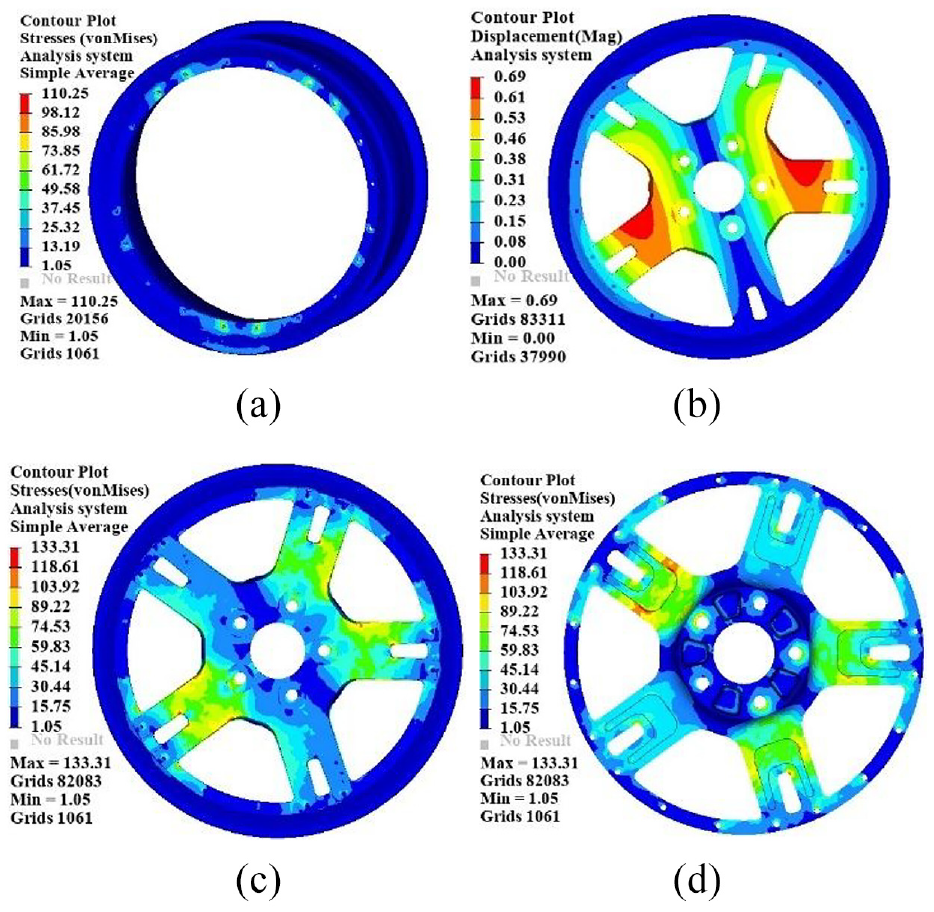
Contours of stress and displacement of wheel in three conditions: (a) rim stress in F1 condition, (b) wheel displacement in F2 condition, (c) Front wheel stress in F3 condition, and (d) back wheel stress in F3 condition.
The nominal stress method is used to calculate the fatigue life. S-N curves of magnesium alloy ZK61M and aluminum alloy 6061 materials are demanded, as shown in Figure 10. According to SAE J328, The loading force varies as a sine function. Factor is the ratio of the actual time load to the maximum load, and the load-time history curve of the assembled wheel bending fatigue test is shown in Figure 11.
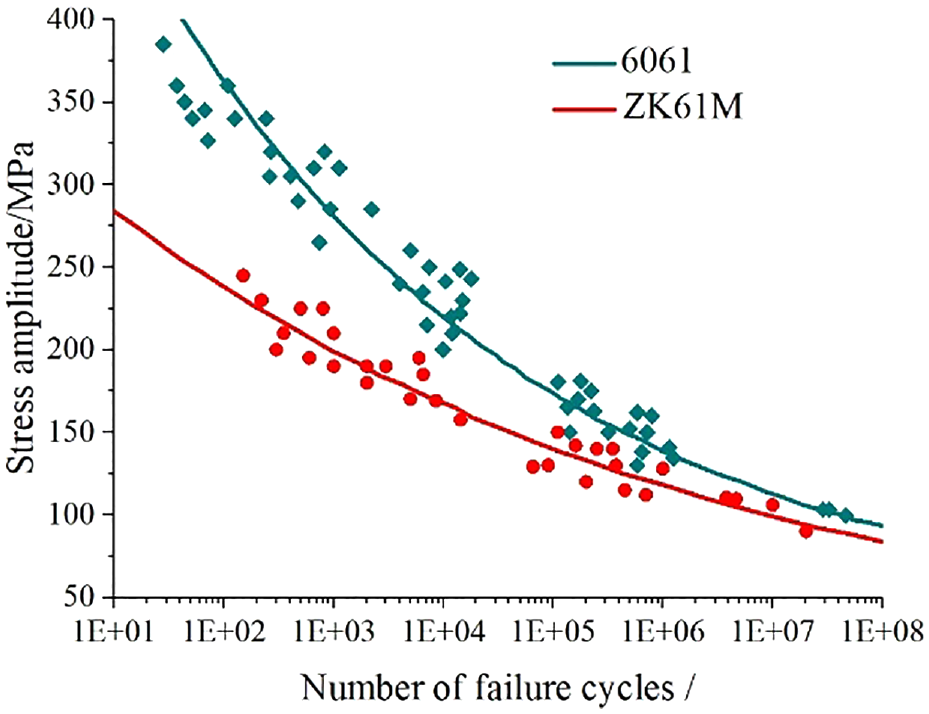
S-N curves of magnesium alloy ZK61M and aluminum alloy 6061.

Load-time history curve of assembled wheel bending fatigue test.
Combined with material and load parameters, the bending fatigue life of assembled wheels is calculated in MSC. Fatigue software. The stress combination method is set to Von Mises, and the calculation is performed with F3 working condition, which is the maximum stress of the wheel. Fatigue life cloud diagram of assembled wheel at maximum stress is shown in Figure 12.

Bending fatigue life cloud diagram of assembled wheel under F3 condition: (a) front of wheel model and (b) back of wheel model.
The results show that the minimum fatigue life of the assembled wheel under F3 condition is 236,000 cycles, meeting the standard requirement that the dynamic bending fatigue life of the wheel is larger than 100,000 cycles. The lowest fatigue life occurs at the root of the front side of the spokes and the weight reduction groove at the root of the back side of the spokes. Thus, the bending fatigue performance of the wheel can be enhanced by optimizing the geometry or size of the area.
Analysis for radial fatigue performance of wheel
Figure 13 shows the finite element model for the radial fatigue test of the assembled wheel. The constraint and loading force magnitude of the finite element model for the wheel radial fatigue condition are basically the same as in Section 2.3, taking three typical force ranges, the magnitude of the cosine pressure A remains unchanged, and the loading directions are divided into 3, which are denoted as A1, A2, and A3, and the included angles are 18° in sequence. The simulated loading range of the three cosine pressures is 36°, 1/10 wheel force cycle is the key range of wheel force analysis. Among them: Cosine pressure A1 is facing the window, Cosine pressure A2 is in the middle position, Cosine pressure A3 is facing the spoke.

Finite element model for radial fatigue test of wheel.
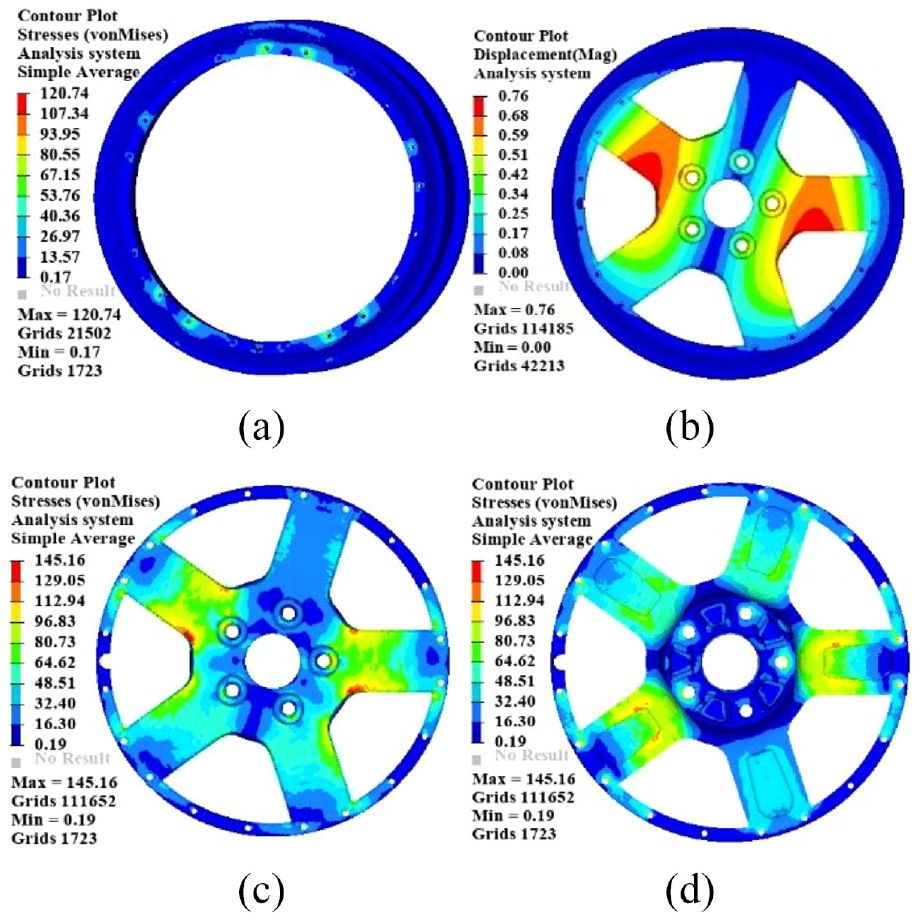
Figure 14 shows that stress distribution and displacement contour of wheel in three condition. Under A2 condition, the stress of the rim and spoke is the highest, which is 43.5 and 60.36 Mpa, respectively. The maximum von Mises stress of the two was smaller than the respective allowable stress. Under A3 working condition, the wheel displacement is the maximum, which is 1.22 mm. This offset is only used to analyze the wheel stiffness for the finite element analysis of the radial fatigue test, and the weighted flexibility value of the wheel will be used to constrain the wheel stiffness later on.
Contours of stress and displacement of wheel in three condition: (a) front spoke stress in A2 condition, (b) back spoke stress in A2 condition, (c) rim stress in A2 condition, and (d) wheel displacement in A2 condition.
The radial load presents a sine function change and the load-time history curve of the radial fatigue test is shown in Figure 15. Combined with wheel material and load parameters, the radial Fatigue life of assembled wheels is calculated in MSC. Fatigue software. The stress combination mode was set as von Mises. The cloud diagram of radial fatigue life was calculated under A2 condition, as shown in Figure 16.

Load-time history curve of assembled wheel radial fatigue test.

Radial fatigue life cloud diagram of assembled wheel under A2 condition: (a) front of wheel model and (b) back of wheel model.
It is known from Figure 16 that the radial fatigue life of the assembled wheel is 1020 cycles, which satisfies the requirement that the test life should be greater than 500,000 cycles. For components with infinite fatigue life, fatigue life safety factor is necessary to analyze the fatigue damage distribution. The cloud diagram of fatigue life safety factor under A2 working condition is shown in Figure 17, from which it can be seen that fatigue damage to the wheel occurs preferentially at the location where the upper part of the spokes connect to the spoke ring.

Cloud diagram of safety factor of wheel under A2 working condition: (a) front of wheel model and (b) back of wheel model.
Wheel modal performance analysis
Modal analysis is an essential method to study the dynamic characteristics of a structure. The first-order bending and torsional modal frequencies of the wheel should avoid the excitation frequency of the engine and road surface. The free modal analysis of the assembled wheel after joint topology optimization was performed to extract the first-order bending and first-order torsional mode vibration patterns, as shown in Figure 18. The first-order modal frequency of the wheels is 345.3 Hz, which is much higher than the excitation frequency of the engine, road and other parts of the vehicle. As such, the low frequency vibration characteristics of the assembled wheel satisfy the modal frequency requirements of automotive NVH.

The first-order bending and first-order torsional mode shapes of the assembled wheel: (a) first-order bending mode(345.3 Hz) and (b) first-order torsional mode (801.0 Hz).
Multi-objective optimization design of wheel
Multi-objective optimization process
The flowchart of multi-objective optimization for wheel lightweight is shown in Figure 19.

Flowchart of l multi-objective optimization for wheel lightweight.
Based on the wheel parametric model and the wheel fatigue performance, the design variables, constraints and optimization objectives are determined, where the design variables are screened by the contribution analysis method. Then, DOE is conducted to perform sampling and thereby fit surrogate model. Based on the surrogate model and modified NSGA-II, the multi-objective optimization of the assembled wheel is carried out to obtain the Pareto solution set. Further, the grey relation grade of the Pareto solution is calculated according to the entropy weight grey relation analysis. Finally, the Pareto solutions are ranked according to the magnitude of the grey relation grade to obtain the optimum solution in terms of overall performance.
Variable selection
In order to improve the deformability and design space of the wheel, a parametric design of the wheel model is considered necessary. Based on the advanced mesh deformation technique, DEP-Mesh Works software is used to realize the parametric model of the wheel. It is implemented by controlling the translation and scaling of the finite element model nodes, and then setting the centrosymmetric constraints on the whole wheel.
The design variables of the finite element model for wheel bending fatigue test and radial fatigue test conditions are shown in Figure 20, and the ranges of their values are shown in Table 3.
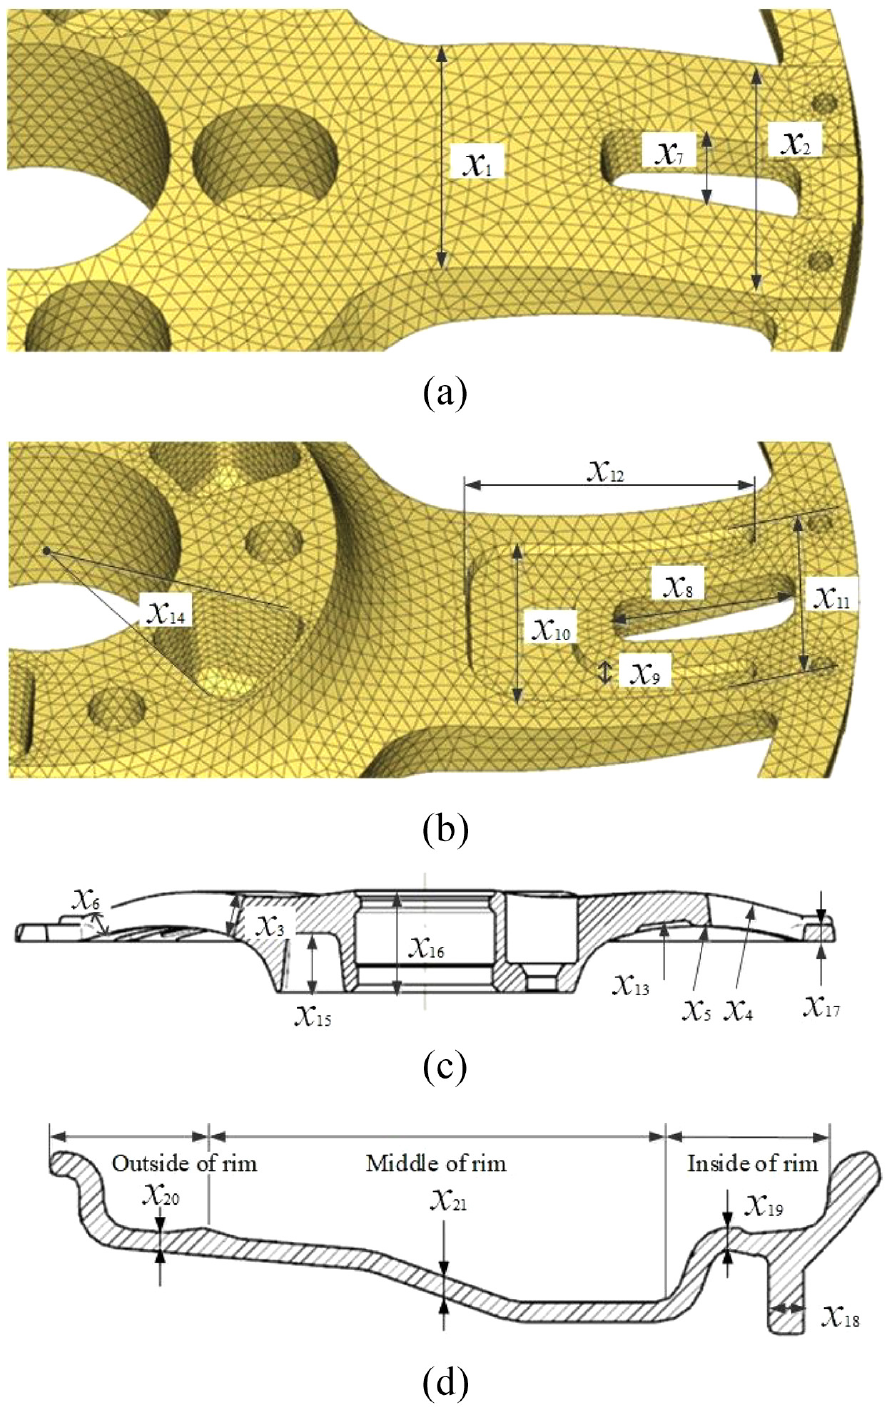
Schematic diagram of design variables of assembled wheel: (a) front of the spoke, (B) Back of the spoke, (c) section of the disk, and (d) section of the rim.
Design variables and their value ranges.

The optimal Latin hypercube design (OLHD) was used to take 200 sample points, and the contribution of each design variable to the mass was obtained by simulation analysis, as Figure 21 shows. Sixteen parameter variables with greater contribution degree were selected as the design variables of this multi-objective optimization.

Contribution analysis of design variables.
Surrogate model
The Kriging and RBF models were fitted using the 200 sample points previously obtained. To verify the accuracy of the obtained approximate model, 20 sample points were used to substitute into the model, as shown in Figure 22.

Approximate model accuracy of each performance indexes: (a) bending fatigue life (BFL)/104, (b) mass (M)/kg, (c) rim bending stress (RBS)/MPa, (d) rim radial stress (RRS)/MPa, (e) safety factor (SF), and (f) disk Displacement (DD)/mm.
The determination coefficient (R2), root mean square error (RMSE) and maximum absolute percentage error (MAPE) were employed to assess the accuracy of the approximation model. The closer the R2 is to 1 and the closer the RMSE and MAPE are to 0, the higher the accuracy of the proxy model is. Table 4 shows the specific index values of the accuracy test results of each approximate model.
Accuracy verification results of each approximate model.
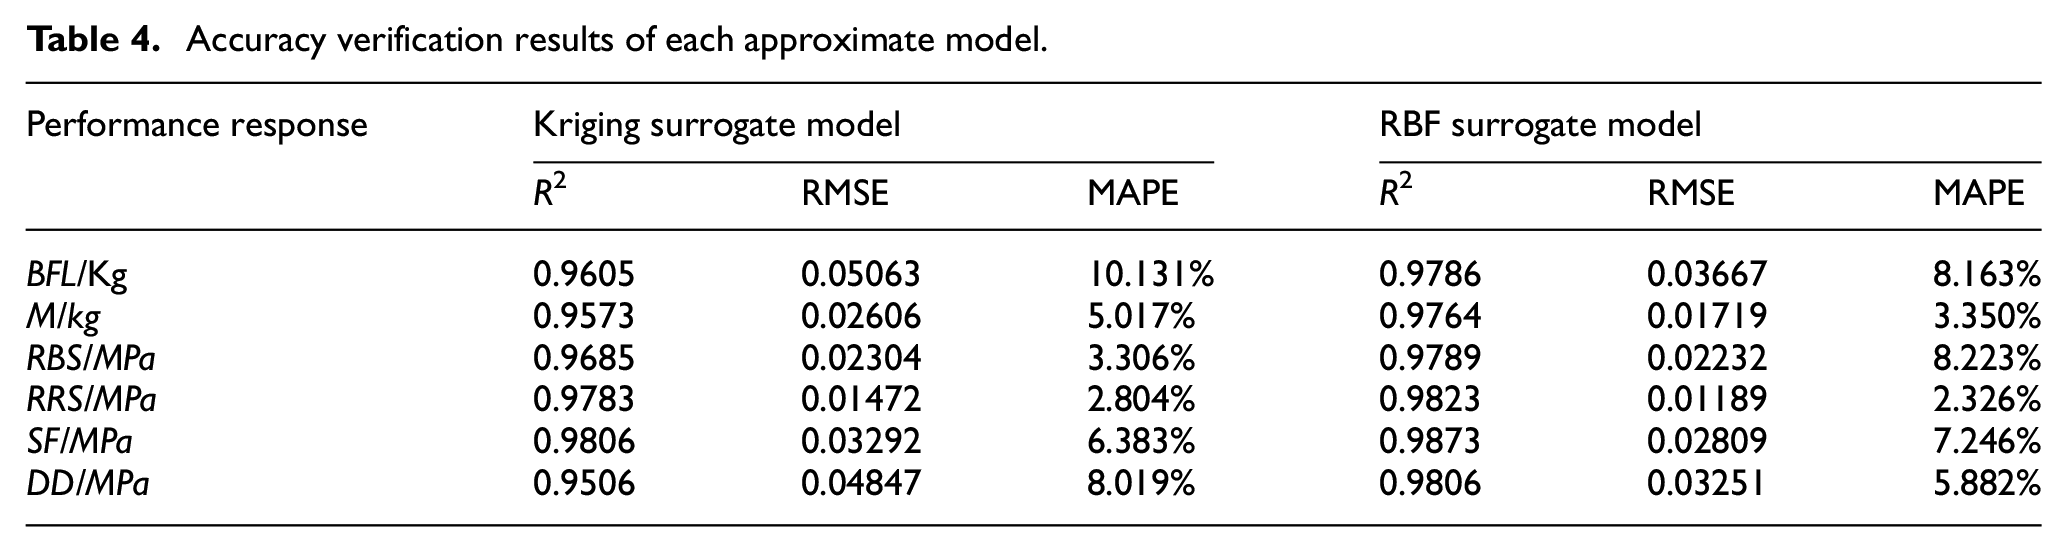
As can be observed from Table 4, the Kriging surrogate model has a small MAPE only in RBS and SF, but the MAPE only indicates the accuracy of the local model. In other performance aspects, the RBF surrogate model exhibits superior accuracy than the Kriging surrogate model. It can be demonstrated that RBF model better balances the global prediction and local prediction of approximate model, hence RBF surrogate model will be utilized later for multi-objective optimization.
Mathematical model for multi-objective optimization
The multi-objective optimal design of the assembled wheel was formulated considering the performance indexes of wheel mass, strength, stiffness, modal, bending and radial fatigue life. The mathematical model of multi-objective optimization design can be expressed as:

Where m(
Analysis and validation of results
Multi-objective optimization results
In the multi-objective optimization platform Isight, based on the constructed RBF surrogate model, modified NSGA-II is adopted for the lightweight multi-objective optimization design of the assembled wheel, and the optimization platform is illustrated in Figure 23. For modified NSGA-II, the number of populations was set to 20, the number of genetic generations to 100, and the crossover probability to 0.9, respectively. Three hundred Pareto solutions were obtained after 2001 iterations, as shown in Figure 24.

Multi-objective optimization platform.

Pareto frontier after optimization design: (a) BF-SF-M Pareto frontier, (b) M-BF Pareto frontier, (c) M-SF Pareto frontier, and (d) BF-SF Pareto frontier.
Rank Pareto frontier
From the Pareto front, it is obvious that the performance of BF, SF and M is hardly optimal at the same time, and hence different compromises are required to be chosen according to different optimization demands. The weights of the three objective functions of BF, SF and M can be obtained by applying the entropy weight method, which are 0.259, 0.390 and 0.351, respectively. After that, the grey relation grade of each scheme are obtained according to the grey relation analysis, as shown in Figure 25. Among them, the grey relation grade of the 300th non dominated scheme A is 0.8754, which is the largest among all schemes.

GRG of Pareto frontier based on EGRA.
In order to verify the effectiveness and feasibility of the entropy-weighted grey relation analysis method in the process of selecting the optimal compromise optimization scheme, this article also utilized the TOPSIS method to obtain the optimal compromise scheme B, and obtained scheme C through the Isight platform. When the TOPSIS method is performed to rank the Pareto frontier, the weights obtained by the entropy weight method are still applied to each objective function to ensure the consistency of each condition. Figure 26 shows the relative closeness of the Pareto frontier obtained by the TOPSIS method, where the 264th scenario B has the relative closeness, 0.6189.

RC of Pareto frontier based on TOPSIS.
As shown in Table 5, from the overall point of view, scenarios A and C can satisfy the required requirements, where the bending fatigue life and safety factor of scheme A are smaller than that of scheme C, but it has a more significant mass reduction. In terms of weight reduction, although the mass of scheme B is the smallest among the three solutions, the fatigue life test requirement is neglected in the excessive pursuit of light weight. As a result, scheme A is the better overall performance of the three schemes, satisfying both the wheel fatigue performance requirements and the significant lightweighting effect. Thus, compared to TOPSIS, EGRA is more capable of balancing the performance of each solution, and is a superior guide in selecting the best compromise solution
Performance comparison of optimization schemes A, B, and C.

Variable rounding and simulation analysis of the preferred solution
Rounding of design variables for the preferred solution
Each design variable is a continuous variable in multi-objective optimization, thus rounding is required for engineering processing. The preferred value of scheme A has a wheel bending fatigue life of 111,000 cycles, which can satisfy the requirements of the test standard. However, in order to ensure a superior bending fatigue life and safety factor during the use of the wheel, the upward rounding strategy is adopted for each wheel design variable in this article, taking into account the processing error and process quality. Table 6 shows the initial, preferred and rounded values of each design variable.
The initial, preferred and rounded values of design variables.

Modeling and analysis of wheel after rounding
As can be seen in Table 6, the rounded value of the spoke slot width (x7) is 0, indicating that the slot of the spokes has disappeared. In order to improve the aerodynamic performance of the wheel, a hole was machined in the rim, and the structure at the corresponding spoke position was thus corrected. On this basis, the assembled wheel is modeled in 3D according to the rounded values of the design variables in Table 6, as shown in Figure 27.

The assembled wheel after muti-objective optimization: (a) front of wheel model and (b) back of wheel model.
The bending fatigue performance of the assembled wheel after optimization and rounding is presented in Figures 28 and 29. Due to the reduction of the overall wheel size after optimization and rounding, the maximum Von Mises stress and nodal displacement of the wheel are increased, and the bending fatigue life of the wheel is decreased. The optimized size of the spokes weight reduction groove has improved the load bearing condition at the back of the spokes root, thereby changing the location of the minimum bending fatigue life of the wheel from the back of the spokes root to the front, with a minimum bending fatigue life of 177,000 cycles. In addition to this, it is clear from Figures 28 and 29 that the other bending fatigue performance indicators of the assembled wheel after optimization and rounding also satisfy the design requirements.
Contours of stress and displacement of wheel after optimization and rounding: (a) rim stress in F1 condition, (b) wheel displacement in F2 condition, (c) front wheel stress in F3 condition, and (d) back wheel stress in F3 condition.

Bending fatigue life cloud diagram of wheel after optimization and rounding: (a) front of wheel model and (b) back of wheel model.
The radial fatigue performance of the assembled wheel after optimization and rounding is presented in Figures 30 to 32. Due to the disappearance of the spoke slots, the radial load capacity of the middle and upper part of the spoke is increased, resulting in an increase in the fatigue life safety factor at this location. The change in the size of the spoke groove increases the radial load capacity of the spoke roots, and the optimization of these structural parameters reduces the stress on the spokes. Reduction of rim thickness after optimization and rounding increases both rim stress and nodal displacement.

Contours of stress and displacement of wheel after optimization and rounding: (a) front spoke stress in A2 condition, (b) back spoke stress in A2 condition, (c) rim stress in A2 condition, and (d) wheel displacement in A2 condition.

Radial fatigue life cloud diagram of wheel after optimization and rounding: (a) front of wheel model and (b) back of wheel model.
Cloud diagram of safety factor of wheel after optimization and rounding: (a) front of wheel model and (b) back of wheel model.
The reduction in the thickness of the top of the spoke (x6) and the thickness of the disk ring (x17) weakens the radial load carrying capacity at the joint between the spoke and the disk ring, resulting in the smallest fatigue life safety factor at this point, with a minimum value of 1.72. In besides this, it is evident from Figures 30 to 32 that the other radial fatigue performance indicators of the assembled wheel after optimization and rounding also meet the design requirements.
The free mode analysis of the optimized and rounded assembled wheel is shown in Figure 33. The reduction of the rim and spoke root size of the assembled wheel has a significant effect on its modal frequency, and thus the reduction of the modal frequency is most obvious in the first and second order, but both meet the constraint requirements of the low frequency inherent vibration characteristics and the modal frequency requirements of automotive NVH.

The first-order bending and first-order torsional mode shapes of the assembled wheel after optimization and rounding: (a) first-order bending mode (309.5 Hz) and (b) first-order torsional mode (675.8 Hz).
Performance comparison of the optimized scheme before and after rounding
After the rounded wheels were subjected to simulation calculations, the optimized and rounded performance was compared, as shown in Table 7.
Comparison of preferred and rounded values.

From Table 7, it can be indicated that the mass, bending fatigue life and radial fatigue safety factor increased by 3.22%, 59.45% and 14.97% respectively after up-rounding, which again verifies the accuracy of the surrogate model. Bending fatigue life and radial fatigue safety factor are exponentially and linearly related to the mass respectively, and thus the amount of change in bending fatigue life is much more than the radial fatigue safety factor.
The performance comparison of initial and rounded values is shown in Table 8. The multi-objective optimization resulted in a 4.49% reduction in wheel mass, a 25% reduction in bending fatigue life, and a 9.95% reduction in radial fatigue safety factor compared to the joint topology optimization. In addition, the maximum stresses in the rim and spokes increased by 8.40% and 9.43%, respectively, in the bending fatigue condition, while the maximum stresses in the rim and spokes decreased by 16.74% and increased by 16.27%, respectively, in the radial fatigue condition, and the first-order bending mode of the wheel decreased by 10.57%. Although most of the performances deteriorated, they were within the acceptable range.
Comparison of optimal design result.

Fatigue test verification
Rectangular rosettes position
According to the results of the finite element analysis of the dynamic fatigue test of the wheel, five typical strain test points were selected for the bending and radial fatigue tests of the wheel, and the locations of the rectangular rosettes were pasted after polishing as shown in Figures 34 and 35.

Position of rectangular rosettes during dynamic bending fatigue test: (a) front of wheel model and (b) back of wheel model.

Position of rectangular rosettes during dynamic radial fatigue test: (a) front of wheel model and (b) back of wheel model.
Dynamic bending fatigue test
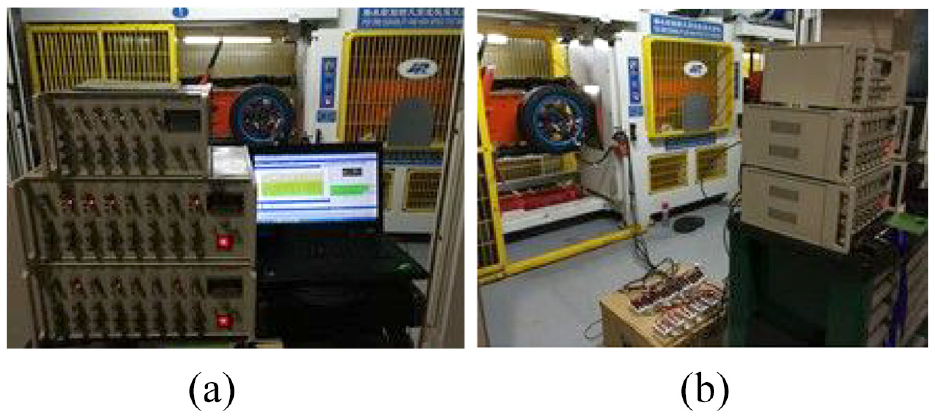
According to SAE J328, the test equipment and instrument connection for the dynamic bending fatigue test are shown in Figure 36, respectively. Figure 37 reveals the location of cracks in the wheel bending fatigue damage.

Test equipment and instrument connection: (a) front and (b) side.

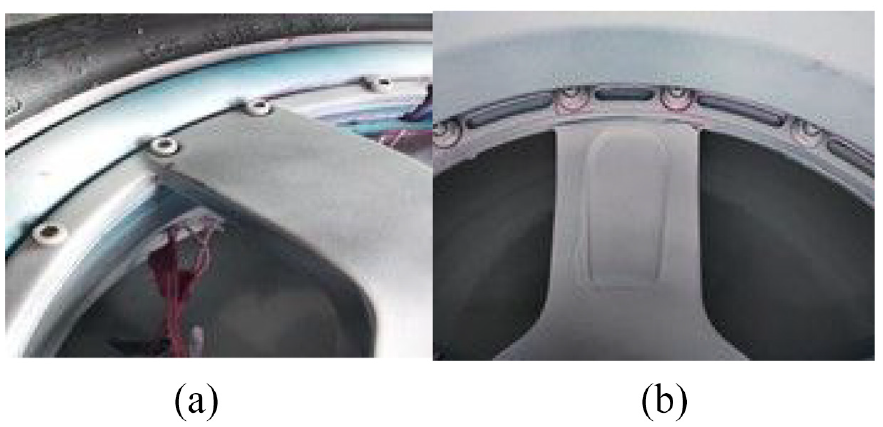
Wheel bending fatigue damage cracks.
Every cycle a certain number of times to take off the wheel for dye-penetrant testing method to find the location of cracks, the wheel in the cycle 185,000 cycles after the occurrence of fatigue damage, proving that the wheel satisfies the requirements. Bending fatigue damage occurred in the wheel after 185,000 cycles, proving that the wheel satisfied the requirements. The fatigue damage cracks are shown in Figure 37, from which it can be found that the cracks all occur at the root position of the front side of the spokes, which is consistent with the fatigue damage location of the simulation analysis. Moreover, the simulated value of bending fatigue life of the assembled wheel was 177,000 cycles, with an error of −4.32% compared with the experimental value, indicating that the FEM simulations effectively predicted the bending fatigue life of the wheel and the location of the fatigue damage.
The measured five sets of dynamic strain data were averaged, and the peak and trough values of the line strain in the three directions of 0°, 45° and 90° at each selected measurement point were recorded, and main stress at each selected measurement point was calculated accordingly. Table 9 depicts the strain, main stress, Von Mises stress test values and simulation values for measurement points, from which it can be concluded that the maximum error between the simulated and experimental values of Von Mises stress is 9.05%, further indicating the accuracy of the finite element model.
Stress values and error of each measuring point for bending fatigue test.

Dynamic radial fatigue test
Figure 38 presents the test equipment and instrument connection for dynamic radial fatigue testing. Wheel fatigue damage occurred after 800,000 cycles, meeting the standard requirement of not less than 500,000 cycles, radial fatigue damage cracks as shown in Figure 39.
Test equipment and instrument connection: (a) front and (b) side.
Wheel bending fatigue damage cracks: (a) front and (b) side.
The crack occurred at the joint between the spoke and spoke ring, which indicates that the crack location is consistent with the simulation analysis results. Moreover, the safety factor of radial fatigue life of the wheel is 1.6, and the error between the simulated value and the test value is 7.50%. It is illustrated that the finite element simulation calculation effectively predicts the safety factor of radial fatigue life of the wheel and the location of fatigue damage occurrence. Table 10 depicts the strain, main stress, Von Mises stress test values and simulation values for measurement points, from which it can be concluded that the maximum error between the simulated and experimental values of Von Mises stress is 9.715%, further demonstrating the reliability of the finite element model.
Stress values and error of each measuring point for radial fatigue test.

Conclusion
A conceptual design model of the wheel is established and a topology optimization method based on the joint working conditions is proposed, taking the
Based on the optimal topology of the spokes and rim design criteria, an assembled wheel consisting of a magnesium alloy rim and aluminum alloy spokes was initially designed and bolted together. A finite element model for bending and radial fatigue testing of the assembled wheel was established, and the performance of the wheel in terms of strength, stiffness, fatigue life and its safety factor under the two operating conditions was simulated and analyzed. According to the analysis results, the structural dimensional parameters at the root of the spokes and the top of the spokes have a significant effect on the bending fatigue performance and radial fatigue performance, respectively.
Combined with the mesh deformation technique, a parametric model of the assembled wheel was established and 21 parameter variables were set. After sampling by OLPD method, 16 parameter variables with high contribution to mass were selected as design variables for multi-objective optimization using contribution analysis method. By integrating the surrogate model approach and the modified NSGA-II, the multi-objective optimization of the assembled wheel was performed by to obtain the Pareto solution set.
Based on the EGRA method, the optimal solution is selected by ranking the Pareto solutions. Comparing the optimal solution obtained by TOPSIS and the optimal solution recommended by Isight, the solution adopted by the EGRA method is the one with more comprehensive performance among the three solutions, which not only satisfy the wheel fatigue performance requirements, but also have significant lightweight effect. As a consequence, EGRA is more capable of balancing the performance of each solution and is a better guide in choosing the best compromise solution.
The performance indexes of the assembled wheels before and after optimization were compared and analyzed, and subsequently verified by bending and radial fatigue tests. The optimized design of the assembled wheel reduces the weight by 4.49%, after the optimized design, the weight of the assembled wheel is reduced by 4.49%, the bending fatigue life is reduced by 25%, the radial fatigue safety factor is reduced by 9.95%, and the maximum stress of the rim and the maximum stress of the spoke under the bending fatigue condition are increased by 8.40% and 9.43%, respectively. The maximum stress of the rim and the maximum stress of the spoke under fatigue conditions are reduced by 16.74% and increased by 16.27%, respectively, and the first-order bending mode of the wheel is reduced by 10.57%. Although most of the performance has deteriorated, they are all within the acceptable range. In this article, the joint topology optimization of assembled wheels with multiple working conditions is combined with multi-objective optimization, and the optimal compromise solution is screened by EGRA method, which provides an approach and technical basis for the multi-objective optimization design of wheel lightweight.
Footnotes
Handling Editor: Chenhui Liang
Declaration of conflicting interests
The author(s) declared no potential conflicts of interest with respect to the research, authorship, and/or publication of this article.
Funding
The author(s) disclosed receipt of the following financial support for the research, authorship, and/or publication of this article: This work was supported by the Major Science and Technology Project of Henan Province(no. 221100240400). Key R&D and Promotion Project of Henan Province(no. 232102240052). Science and Technology Research Project of Henan Province (No. 212102310040).National Key Research and Development Program of China (no.2022YFD2001203).Key Scientific Research Project of Colleges and Universities in Henan Province (No. 21A580003).