
Abstract
In this article, the thermomechanical fatigue damage evolution of fiber-reinforced ceramic–matrix composites subjected to multiple loading sequences is investigated. The damage evolution models considering synergistic coupling effects of thermomechanical fatigue loading sequences, thermal cyclic temperature, and multiple thermomechanical fatigue damage mechanisms (i.e. matrix multi-cracking, fiber/matrix interface debonding/sliding/wear) are developed. The effects of composite material properties, peak stress, and matrix crack spacing on the thermomechanical fatigue damage evolution of fiber-reinforced ceramic–matrix composites are discussed. Comparisons of damage evolution between the in-phase and the out-of-phase thermomechanical fatigue loading under multiple loading sequences are performed. The thermomechanical fatigue hysteresis energy, hysteresis modulus, peak strain, and interface debonded length of cross-ply ceramic–matrix composites subjected to different loading sequences are predicted. The damage under thermomechanical fatigue multiple loading sequences is much more serious than that under thermomechanical fatigue single peak stress level.
Introduction
The development of high-temperature materials over the past 40 years has been one of the key factors responsible for improvements in performance of gas turbines. The fiber-reinforced ceramic–matrix composites (CMCs) are damage tolerant, tough, lightweight, and capable of withstanding higher temperatures than nickel (Ni) superalloys. If the fiber-reinforced CMCs are used instead of nickel-based superalloys in hot section components, the turbine engines of aircraft and power plants could operate more efficiently at higher temperatures, combusting fuel more completely and emitting fewer pollutants.1–3 The LEAP aircraft engine became the first widely developed CMC-containing product in 2016. The LEAP engine has a turbine shroud lining its hottest zone, so it can operate at up to 1315°C. 4
Under the thermomechanical fatigue (TMF) loading, the mechanical behavior of fiber-reinforced CMCs involves cyclic loading and temperature. 5 The cyclic fatigue stress and repetitive temperature change the stress and temperature field and cause serious physical and chemical damages inside CMCs.6,7 Butkus et al., 8 Allen and Mall, 9 Xie et al., 10 Mei and Cheng, 11 Kim et al., 12 and Cluzel et al. 7 investigated the TMF behavior of unidirectional, cross-ply, and two-dimensional (2D) woven CMCs for different temperature ranges and stress levels. The nondestructive testing (NDT) techniques, that is, infrared thermography, 13 acoustic emission,14–16 and electrical resistivity, 17 have been proposed to monitor the damage evolution in fiber-reinforced CMCs. However, these NDT methods cannot be applied for damage monitoring above 1000°C. The energy dissipation under cyclic loading can be used to monitor internal damage in fiber-reinforced CMCs.18–22 The tensile and cyclic fatigue tests can be conducted based on the ASTM standards.23–25 Li 26 developed a TMF hysteresis–based damage evolution model for fiber-reinforced CMCs under a single peak stress. Under TMF loading, multiple loading sequences affect the internal damage inside fiber-reinforced CMCs, that is, matrix multi-cracking and fiber/matrix interface debonding and sliding range. The synergistic coupling effects of multiple loading sequences and thermal cyclic temperature change the fiber/matrix interface shear stress at a single cycle upon unloading or reloading and decrease or increase the fiber/matrix interface debonding and sliding range depending upon the loading sequences. However, considering the synergistic coupling effects of multiple loading sequences, thermal cyclic temperature, and applied cycle number, the TMF damage evolution of fiber-reinforced CMCs under multiple loading sequences has not been investigated.
The objective of this article is to investigate the TMF damage evolution of fiber-reinforced CMCs under multiple loading sequences. The damage evolution models considering synergistic coupling effects of multiple loading sequences, thermal cyclic temperatures, and multiple TMF damage mechanisms are developed. The effects of composite material properties, peak stress, and loading sequences on the damage evolution of fiber-reinforced CMCs are analyzed. Comparisons of damage evolution between in-phase (IP) and out-of-phase (OP) TMF loading under multiple loading sequences are discussed. The TMF hysteresis dissipated energy, hysteresis modulus, peak strain, and interface debonding length of cross-ply CMCs under different loading sequences are predicted.
Theoretical analysis
Under TMF loading, the thermal cyclic temperature changes with decreasing or increasing applied stress upon unloading or reloading. The variation of temperature and peak stress with increasing applied cycles under IP and OP TMF loading can be divided into three cases as follows (Figures 1 and 2):
Case 1—single peak stress under IP/OP TMF loading;
Case 2—low–high peak stress under IP/OP TMF loading;
Case 3—high–low peak stress under IP/OP TMF loading.

The schematic of in-phase thermomechanical fatigue loading subjected to (a) single peak stress, (b) low–high peak stress, and (c) high–low peak stress.
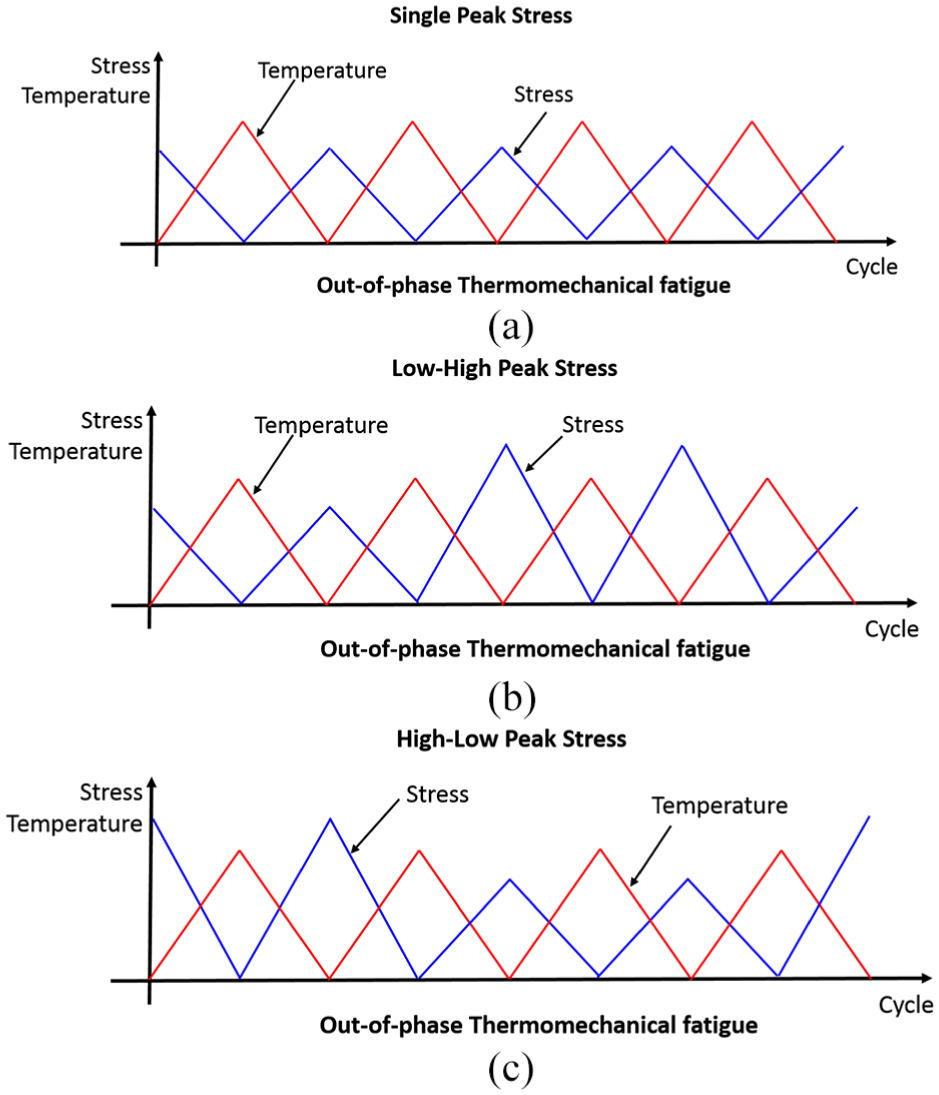
The schematic of out-of-phase thermomechanical fatigue loading subjected to (a) single peak stress, (b) low–high peak stress, and (c) high–low peak stress.
Thermomechanical interface damage models
Under multiple loading sequences, the cyclic- and temperature-dependent fiber/matrix interface shear stress can be described using the following equation 27

where µ denotes the interface frictional coefficient;28,29αrf and αrm denote the fiber and matrix radial thermal expansion coefficients, respectively; A is a constant depending on the elastic properties of the matrix and fibers; and τ0(N) denotes the cyclic-dependent interface shear stress, which can be determined using the following equation 30

where
Under TMF loading at the peak stress of σmax1 for N1 applied cycles, the interface debonded length (ld), counter-slip length (y), and new-slip length (z) can be described using the following equations, as shown in Figure 3 31
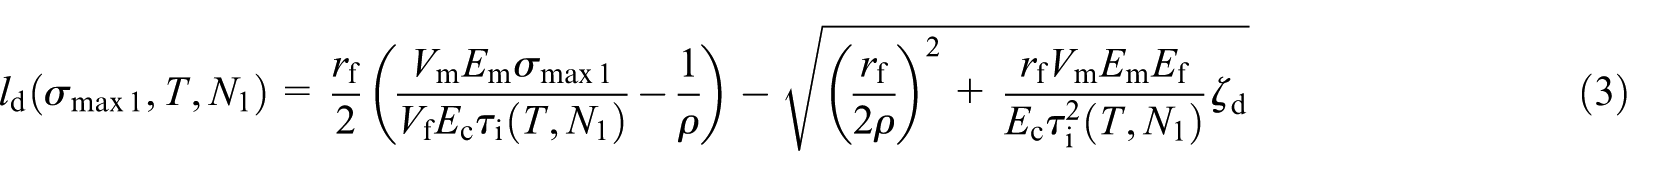


where rf denotes the fiber radius; Vf and Vm denote the fiber and matrix volume fractions, respectively; ζd denotes the fiber/matrix interface debonded energy; ρ denotes the shear-lag model parameter; 32 and Ef, Em, and Ec denote the fiber, matrix, and composite elastic moduli, respectively.

The schematic of fiber slip relative to matrix upon (a) unloading and (b) reloading.
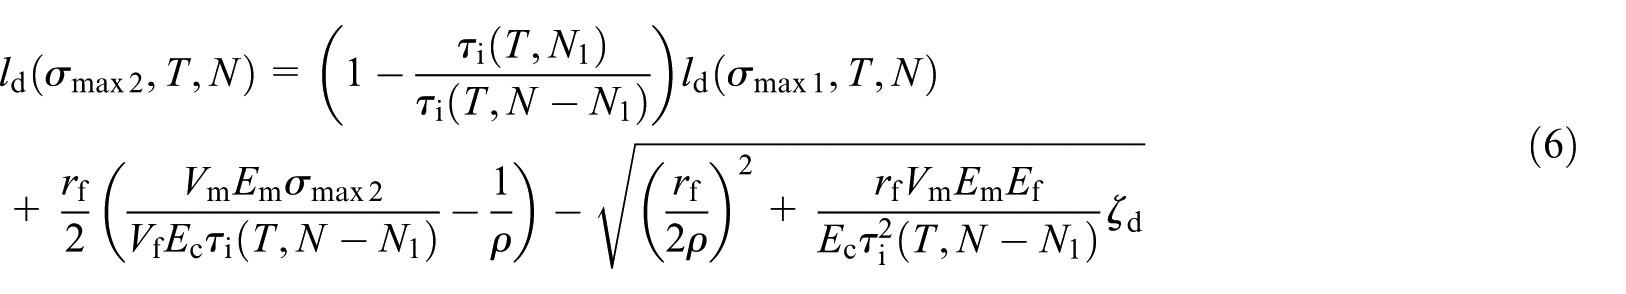
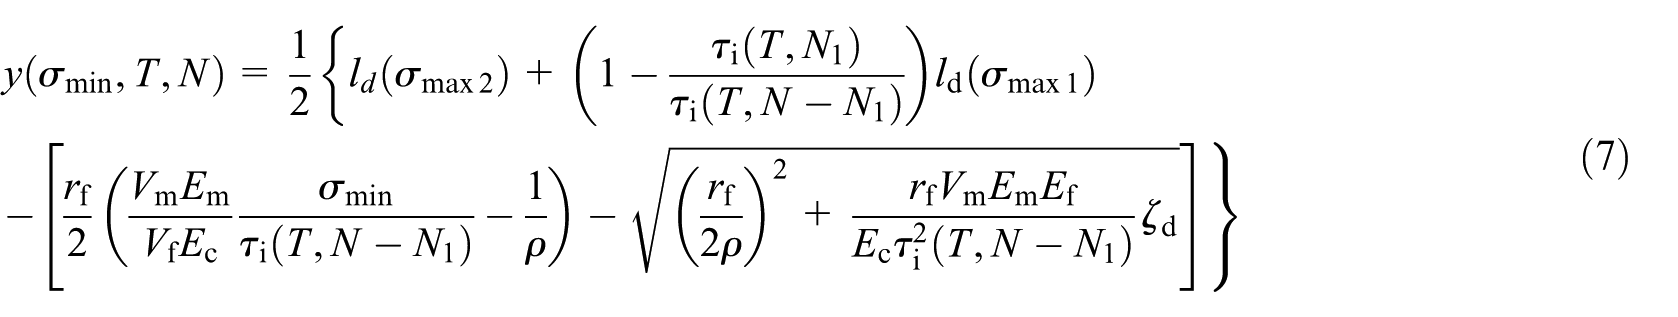
Upon increasing the peak stress from σmax1 to σmax2, the new interface debonding and sliding lengths are affected by the stress level and interface wear regions and can be described using the following equations 31

Thermomechanical hysteresis–based damage models
Under TMF loading at the peak stress of σmax1, the unloading strain of εunloading and reloading strain of εreloading can be determined using the following equations 31


where αlc and αlf denote the composite and fiber axial thermal expansion coefficients, respectively, and ΔT denotes the temperature difference between the fabricated temperature and testing temperature.
Under TMF loading at the peak stress of σmax2, the unloading strain of εunloading and the reloading strain of εreloading can be determined using the following equations 31


Under TMF loading, the area associated with the stress/strain hysteresis loops is the dissipated energy during the corresponding cycle, which can be described using the following equation

Substituting the unloading and reloading strains of equations (9)–(12) into equation (13), the hysteresis dissipated energy corresponding to different loading sequences can be obtained.
The hysteresis modulus of E is described using the following equation 33

where εmax denotes the peak strain and εmin denotes the valley strain. The hysteresis modulus can also reflect the internal damage inside fiber-reinforced CMCs under TMF loading, that is, matrix cracking and fiber/matrix interface debonding and sliding.
Results and discussion
Under TMF loading with multiple loading sequences, the effects of composite material properties, peak stress, and matrix crack spacing on the damage evolution of fiber-reinforced CMCs are analyzed. The comparison analysis of damage evolution between IP and OP TMF multiple loading sequences is discussed. The ceramic composite system of SiC/SiC is used for the case study and its material properties are provided by Fantozzi et al.: 34 Vf = 30%, Ef = 230 GPa, Em = 300 GPa, rf = 7.5 µm, ζd = 0.1 J/m2, αrf = 2.9 × 10⁻⁶/K, αlf = 3.9 × 10⁻⁶/K, αrm = 4.6 × 10⁻⁶/K, and αlm = 2.0 × 10⁻⁶/K.
Effect of material properties on TMF damage evolution
The effects of fiber volume fraction and interface properties on the TMF damage evolution of the SiC/SiC composite under σmax1 = 150 MPa and σmax2 = 200 MPa in the temperature range of T1 = 100°C and T2 = 1000°C are shown in Figures 4–7.

The effect of fiber volume fraction (Vf = 30% and 40%) on in-phase thermomechanical fatigue: (a) hysteresis dissipated energy versus cycle number curves; (b) hysteresis modulus versus cycle number curves; (c) peak strain versus cycle number curves; (d) interface debonding length versus cycle number curves; and (e) interface counter-slip/new-slip length versus cycle number curves of the SiC/SiC composite under multiple loading sequences of σmax1 = 150 MPa and σmax2 = 200 MPa in the temperature range of T1 = 100°C and T2 = 1000°C.

The effect of fiber/matrix initial interface shear stress (τinitial = 1 and 10 MPa) on the in-phase thermomechanical fatigue: (a) hysteresis dissipated energy versus cycle number curves; (b) hysteresis modulus versus cycle number curves; (c) peak strain versus cycle number curves; (d) interface debonding length versus cycle number curves; and (e) interface counter-slip/new-slip length versus cycle number curves of the SiC/SiC composite under multiple loading sequences of σmax1 = 150 MPa and σmax2 = 200 MPa in the temperature range of T1 = 100°C and T2 = 1000°C.

The effect of fiber/matrix steady interface shear stress (τsteady = 1 and 10 MPa) on the in-phase thermomechanical fatigue: (a) hysteresis dissipated energy versus cycle number curves; (b) hysteresis modulus versus cycle number curves; (c) peak strain versus cycle number curves; (d) interface debonding length versus cycle number curves; and (e) interface counter-slip/new-slip length versus cycle number curves of the SiC/SiC composite under multiple loading sequences of σmax1 = 150 MPa and σmax2 = 200 MPa in the temperature range of T1 = 100°C and T2 = 1000°C.

The effect of fiber/matrix interface frictional coefficient (µ = 0.1 and 0.2) on the in-phase thermomechanical fatigue: (a) hysteresis dissipated energy versus cycle number curves; (b) hysteresis modulus versus cycle number curves; (c) peak strain versus cycle number curves; (d) interface debonding length versus cycle number curves; and (e) interface counter-slip/new-slip length versus cycle number curves of the SiC/SiC composite under multiple loading sequences of σmax1 = 150 MPa and σmax2 = 200 MPa in the temperature range of T1 = 100°C and T2 = 1000°C.
When the fiber volume increases, the hysteresis dissipated energy, peak strain, interface debonded length, and interface slip length decrease, whereas the hysteresis modulus increases.
When the initial interface shear stress increases, the hysteresis dissipated energy, peak strain, interface debonded length, and interface slip length decrease, whereas the hysteresis modulus increases.
When the steady interface shear stress increases, the hysteresis dissipated energy, peak strain, interface debonded length, and interface slip length decrease, whereas the hysteresis modulus increases.
When the interface frictional coefficient increases, the hysteresis dissipated energy, peak strain, interface debonded length, and interface slip length decrease, whereas the hysteresis modulus increases.
Effect of peak stress with variable loading sequences on TMF damage evolution
The effect of peak stress on the TMF damage evolution of the SiC/SiC composite under multiple loading sequences in the temperature range of T1 = 100°C and T2 = 1000°C is shown in Figures 8 and 9.

The effect of peak stress (σmax1 = 100 and 180 MPa) on the in-phase thermomechanical fatigue: (a) hysteresis dissipated energy versus cycle number curves; (b) hysteresis modulus versus cycle number curves; (c) peak strain versus cycle number curves; (d) interface debonding length versus cycle number curves; and (e) interface counter-slip/new-slip length versus cycle number curves of the SiC/SiC composite under multiple loading sequences of σmax2 = 200 MPa in the temperature range of T1 = 100°C and T2 = 1000°C.

The effect of peak stress (σmax2 = 220 and 250 MPa) on the in-phase thermomechanical fatigue: (a) hysteresis dissipated energy versus cycle number curves; (b) hysteresis modulus versus cycle number curves; (c) peak strain versus cycle number curves; (d) interface debonding length versus cycle number curves; and (e) interface counter-slip/new-slip length versus cycle number curves of the SiC/SiC composite under multiple loading sequences of σmax1 = 150 MPa in the temperature range of T1 = 100°C and T2 = 1000°C.
When the first peak stress increases, the hysteresis dissipated energy, peak strain, interface debonded length, and interface slip length increase, whereas the hysteresis modulus decreases.
When the second peak stress increases, the hysteresis dissipated energy, peak strain, interface debonded length, and interface slip length increase, whereas the hysteresis modulus decreases.
Effect of matrix crack spacing on TMF damage evolution
The effect of matrix crack spacing on the TMF damage evolution of the SiC/SiC composite under σmax1 = 150 MPa and σmax2 = 200 MPa at T1 = 100°C and T2 = 1000°C is shown in Figure 10. When the matrix crack spacing increases, the hysteresis dissipated energy, peak strain, and interface slip length decrease, whereas the hysteresis modulus and the interface debonded length increase.
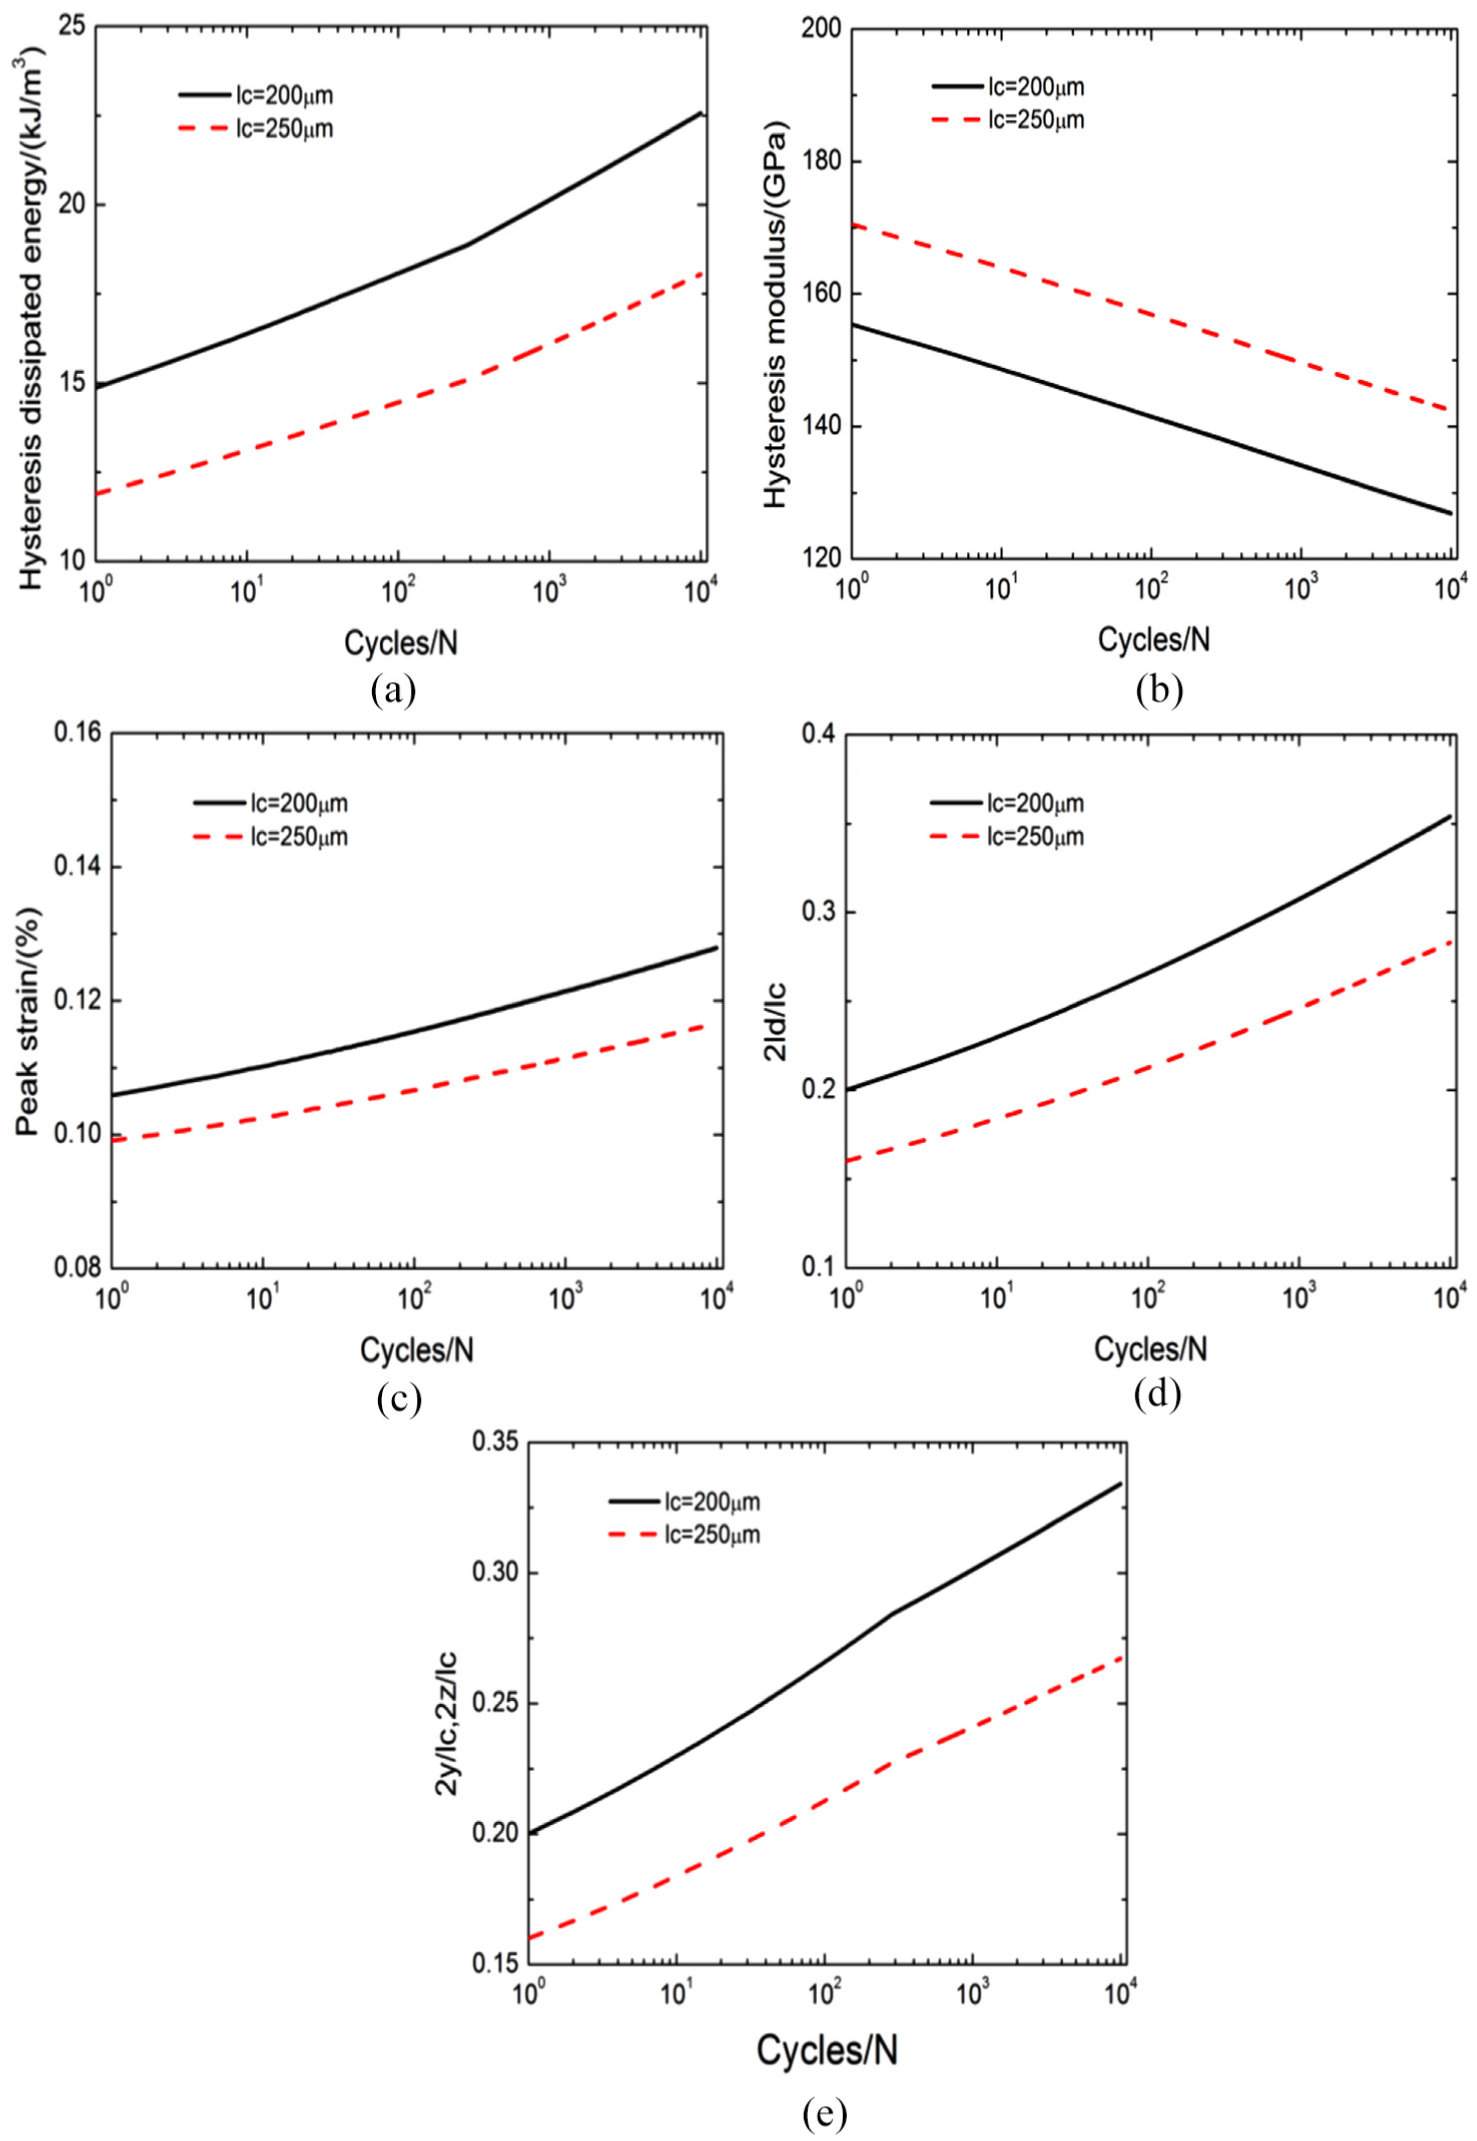
The effect of matrix crack spacing (lc = 200 and 250 µm) on the in-phase thermomechanical fatigue: (a) hysteresis dissipated energy versus cycle number curves; (b) hysteresis modulus versus cycle number curves; (c) peak strain versus cycle number curves; (d) interface debonding length versus cycle number curves; and (e) interface counter-slip/new-slip length versus cycle number curves of the SiC/SiC composite under multiple loading sequences of σmax1 = 150 MPa and σmax2 = 200 MPa in the temperature range of T1 = 100°C and T2 = 1000°C.
Comparison of damage evolution between IP and OP thermomechanical multiple loading sequences
The comparison of TMF damage evolution between IP and OP thermomechanical multiple loading sequences of σmax1 = 150 MPa and σmax2 = 200 MPa at T1 = 100°C and T2 = 1000°C is shown in Figure 11. For the IP TMF loading, the hysteresis dissipated energy and hysteresis modulus are lower than those of OP TMF loading; the peak strain, interface debonded length, and interface slip lengths are higher than those of OP TMF loading.
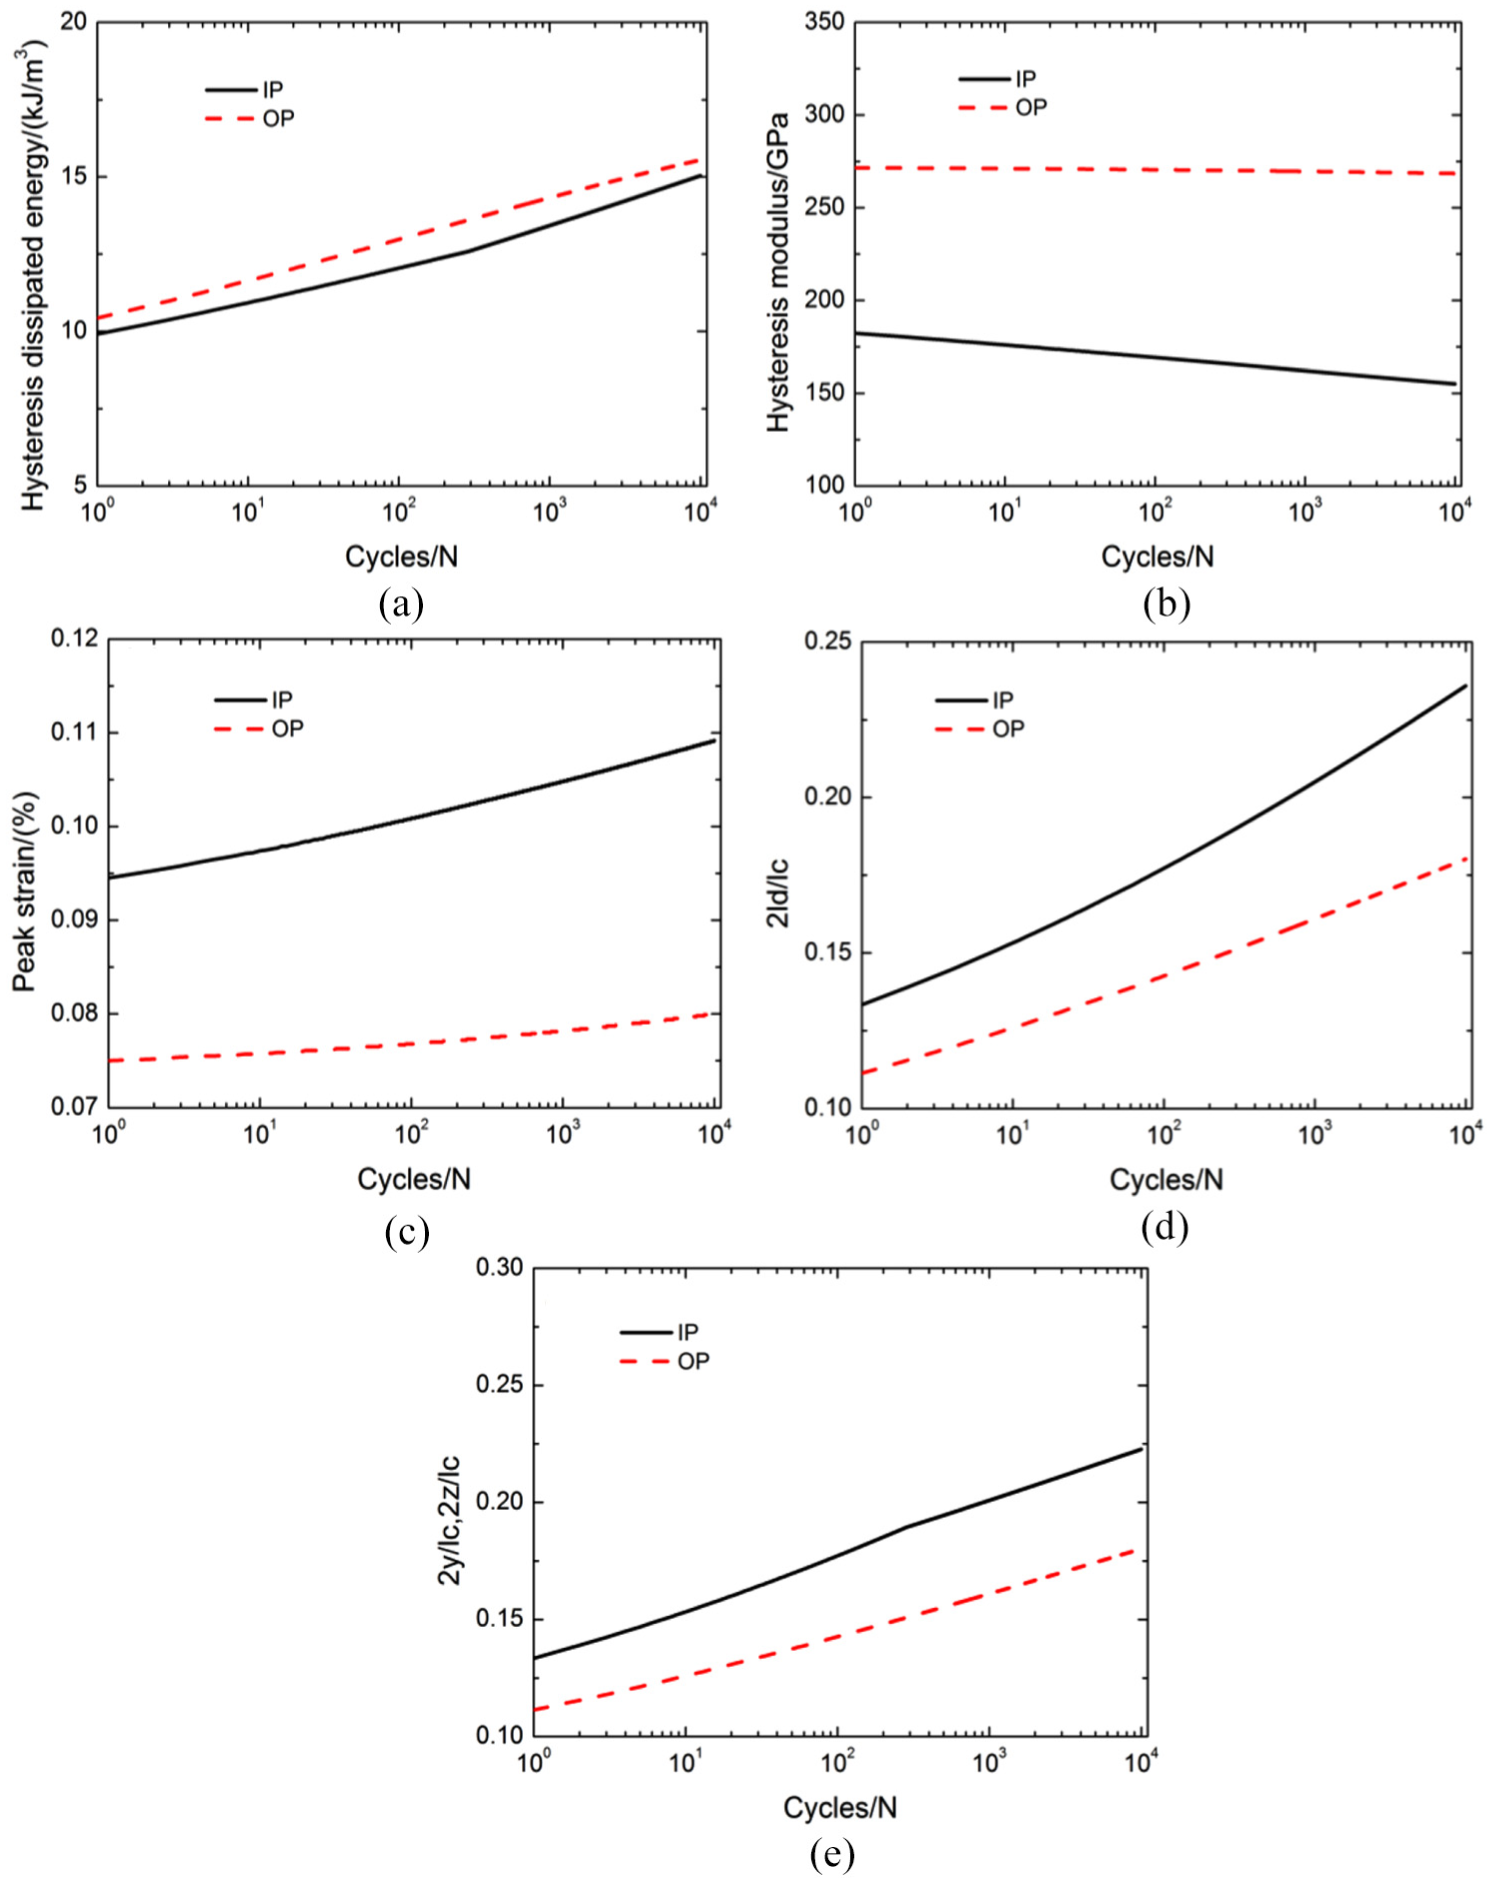
(a) The hysteresis dissipated energy versus cycle number curves; (b) hysteresis modulus versus cycle number curves; (c) peak strain versus cycle number curves; (d) interface debonding length versus cycle number curves; and (e) interface counter-slip/new-slip length versus cycle number curves of the SiC/SiC composite under in-phase and out-of-phase thermomechanical fatigue multiple loading sequences of σmax1 = 150 MPa and σmax2 = 200 MPa in the temperature range of T1 = 100°C and T2 = 1000°C.
Experimental comparisons
Allen and Mall 9 investigated the IP TMF loading behavior of [0/90]4s Nicalon™-SiC/magnesium aluminosilicate (MAS) composite in the thermal cyclic temperature range of 566°C–1093°C. The material properties reported by Allen and Mall 9 are as follows: Vf = 40%, Ef = 200 GPa, Em = 138 GPa, rf = 7.5 µm, ζd = 0.1 J/m2, αf = 4 × 10⁻⁶/°C, αm = 2.4 × 10⁻⁶/°C, and T0 = 1200°C.
The damage evolution curves under the TMF peak stress of σmax1 = 85 MPa are shown in Figure 12. The hysteresis dissipated energy increases from Ue(N = 1) = 11.6 kJ/m3 to Ue(N = 100) = 17.7 kJ/m3; the hysteresis modulus decreases from E(N = 1) = 113.5 GPa to E(N = 100) = 92.1 GPa; the peak strain increases from εmax(N = 1) = 0.147% to εmax(N = 350) = 0.214%; and the interface debonded length increases from 2ld/lc = 0.4 at N = 1 to 2ld/lc = 0.67 at N = 100. The predicted hysteresis dissipated energy, hysteresis modulus, and peak strain agreed with the experimental data, and the interface partial debonding at the peak stress of σmax1 = 85 MPa during the first 100 cycles.

(a) The hysteresis dissipated energy versus cycle number curves; (b) the hysteresis modulus versus cycle number curves; (c) the peak strain versus cycle number curves; and (d) the fiber/matrix interface debonding length versus cycle number curves of the cross-ply SiC/MAS composite under TMF loading at the peak stress of σmax = 85 MPa in the thermal cyclic temperature range of T1 = 566°C and T2 = 1093°C.
The damage evolution curves under the TMF peak stress of σmax2 = 105 MPa are shown in Figure 13. The hysteresis dissipated energy increases to the peak value of Ue(N = 10) = 27.5 kJ/m3 and then decreases to Ue(N = 100) = 23.9 kJ/m3; the hysteresis modulus decreases from E(N = 1) = 71.5 GPa to E(N = 100) = 50 GPa; the peak strain increases from εmax(N = 1) = 0.227% to εmax(N = 100) = 0.274%; and the interface debonded length increases from 2ld/lc = 0.54 at N = 1 to 2ld/lc = 0.98 at N = 100. The predicted hysteresis dissipated energy, hysteresis modulus, and peak strain agreed with the experimental data, and the interface partial debonding at the peak stress of σmax2 = 105 MPa during the first 100 cycles. The hysteresis dissipated energy and peak strain under multiple loading sequences of σmax1 = 85 MPa and σmax2 = 105 MPa are higher, and the hysteresis modulus is lower than those under the single peak stress of σmax = 105 MPa.

(a) The hysteresis dissipated energy versus cycle number curves; (b) the hysteresis modulus versus cycle number curves; (c) the peak strain versus cycle number curves; and (d) the fiber/matrix interface debonding length versus cycle number curves of the cross-ply SiC/MAS composite under TMF loading at the single peak stress of σmax = 105 MPa and multiple loading sequences of σmax1 = 85 MPa and σmax2 = 105 MPa in the thermal cyclic temperature range of T1 = 566°C and T2 = 1093°C.
The damage evolution curves under the TMF peak stress of σmax3 = 120 MPa are shown in Figure 14. The hysteresis dissipated energy increases to the peak value of Ue(N = 13) = 37.4 kJ/m3 and then decreases to Ue(N = 100) = 34.5 kJ/m3; the hysteresis modulus decreases from E(N = 1) = 75.5 GPa to E(N = 100) = 52.5 GPa; and the interface debonded length increases from 2ld/lc = 0.63 at N = 1 to 2ld/lc = 1 at N = 10. The predicted hysteresis dissipated energy, hysteresis modulus, and peak strain agreed with the experimental data, and the interface complete debonding at the peak stress of σmax3 = 120 MPa during the first 10 cycles. The TMF hysteresis dissipated energy and fiber/matrix interface debonding length under multiple loading sequences of σmax1 = 85 MPa, σmax2 = 105 Mpa, and σmax3 = 120 MPa are higher, and the hysteresis modulus is lower than that under the single peak stress of σmax = 120 MPa.

(a) The hysteresis dissipated energy versus cycle number curves; (b) the hysteresis modulus versus cycle number curves; and (c) the fiber/matrix interface debonding length versus cycle number curves of the cross-ply SiC/MAS composite under TMF loading at the single peak stress of σmax = 120 MPa and multiple loading sequences of σmax1 = 85 MPa, σmax2 = 105 MPa, and σmax3 = 120 MPa in the thermal cyclic temperature range of T1 = 566°C and T2 = 1093°C.
Conclusion
In this article, the TMF damage evolution of fiber-reinforced CMCs subjected to multiple loading sequences has been investigated. The effects of composite material properties, peak stress with different loading sequences, and damage state on the damage evolution of fiber-reinforced CMCs have been analyzed. Comparison analysis of damage evolution between IP and OP TMF loading has been conducted. The TMF hysteresis dissipated energy, hysteresis modulus, peak strain, and fiber/matrix interface debonding length versus applied cycle number curves of the cross-ply SiC/MAS composite under three low–high loading sequences have been predicted. The hysteresis-based damage parameters can be used for damage monitoring and lifetime prediction of fiber-reinforced CMCs under TMF loading:
When the fiber volume content, initial/steady interface shear stress, interface frictional coefficient, and matrix crack spacing increase, the TMF hysteresis dissipated energy and peak strain decrease and the TMF hysteresis modulus increases, due to the decrease of the interface debonding/sliding length.
When the first/second fatigue peak stress increases, the TMF hysteresis dissipated energy and the peak strain increase, and the TMF hysteresis modulus decreases, due to the increase of the interface debonding/sliding length.
For the IP TMF loading, the hysteresis dissipated energy and hysteresis modulus are lower than those under OP TMF loading; the peak strain is higher than that under OP TMF loading; the interface debonding/sliding lengths are higher than those under OP TMF loading.
Footnotes
Appendix 1
Acknowledgements
The author would like to thank the anonymous reviewers and the editor for their valuable comments on an earlier version of the paper.
Handling Editor: James Baldwin
Declaration of conflicting interests
The author(s) declared no potential conflicts of interest with respect to the research, authorship, and/or publication of this article.
Funding
The author(s) disclosed receipt of the following financial support for the research, authorship, and/or publication of this article: The work reported here was supported by the Fundamental Research Funds for the Central Universities (Grant No. NS2016070).