
Abstract
This study refers to the modification of the aerodynamic characteristics of the starter for the lift-type vertical axis wind turbine, the structure of the traditional drag starter was improved, and the lift-drag combined starter model was proposed. Based on the CFD numerical simulation and the particle image velocimetry visualization test, the aerodynamic characteristics of the lift-drag combined starter model and the drag starter model are studied, and the reasons for the regular variation of the flow field are explained. The results show that the lift-drag combined starter has obvious advantages over the traditional drag starter in both static start-up characteristics and dynamic output characteristics. The average static torque coefficient of the lift-drag combined starter is increased by 8% compared to that of the drag starter after one revolution. The increasing percentage of the maximum dynamic moment coefficient of the lift-drag combined starter is 89% compared to the drag starter, and the decreasing percentage of the minimum is only 30%.
Keywords
Introduction
Wind energy is considered as the most rapidly growing clean-energy source in the field of renewable energy resources. 1 In the recent 5 years, the total installed capacity of wind energy in China increases rapidly. 2 The wind turbine is a kind of wind energy conversion machinery and widely used in electrical energy supply in industries, households, and remote areas to utilize wind energy. The lift-type vertical axis wind turbine (VAWT) has advantages in off-grid power generation and energy storage system due to its simple structure, good aerodynamic characteristics, and underground generator. 3 VAWT had not been implemented on a large scale due to poor starting characteristics. Recently, many studies have been conducted to improve the starting characteristics of VAWT. The techniques employed to improve the starting characteristics of VAWT are (1) install starter or starter device internally, (2) install external air collector, and (3) structural modification of the wind turbine. The most effective measure was to install the drag rotor as the starter of the lift-type VAWT to improve the starting characteristics of VAWT. T Wakui 4 discussed the suitable hybrid configuration of Darrieus lift-type and Savonius drag-type rotors for stand-alone wind turbine–generator systems. R Gupta et al. 5 studied the performance of a Savonius rotor as well as a Savonius–Darrieus machine. There was an improvement in the power coefficient for Savonius–Darrieus machine compared to Savonius rotor; AM Jahangir and MT Iqbal 6 and Mohamed 7 indicated that hybrid system improves the self-starting capability of the Darrieus turbine. Y Li et al. 8 studied the starting performance effects of combining angle on combined type VAWT, and W Ko et al. 9 theoretically analyzed that the combined wind turbine has better performance than the single wind turbine. JJ Qu et al. 10 analyzed that a drag-lift operation mode of wind turbine was studied by increasing the number and length of the support arm. Z Zhao et al., 11 F Fang et al., 12 and S Xiaojing et al. 13 had studied and reported that the starter was more effective for the starting characteristics of VAWT. However, the aerodynamic characteristics of VAWT with drag starter (DS) were not ideal when operated at high speed. Owing to the characters of the drag wind wheel, the tip speed ratio in operation was not high, due to a negative effect on the increasing aerodynamic force of VAWT at high speed. Therefore, a further modification of the starter was required to improve the aerodynamic characteristics of the DS. In this research study, the DS was modified by attaching the small lift blade on it to create the lift-drag combined starter (LDCS). The aerodynamic characteristics of the two starters were simulated by CFD numerical simulation to evaluate and compare the effect of modified LDCS. The aerodynamic characteristics of the two different starters were analyzed, and the reliability results of the numerical simulation method was verified by the particle image velocimetry (PIV). Compared with PIV, early scholars at home and abroad mostly used computational methods to study the aerodynamic characteristics of VAWT, for example, CM Raciti et al. 14 proposed a new performance prediction model of Darrieus wind turbine based on CFD; A Rossetti and G Pavesi 15 studied approaches to the H-Darrieus turbines start-up; D Kim and M Gharib 16 improved straight-bladed VAWT with an upstream deflector; L Rosario et al. 17 used a transition turbulence model that reached the VAWT; domestic scholars CX Yang 18 studied design parameters on the power coefficient of the VAWT; and D Huang and colleagues, 19 ZZ Zhao et al., 20 and L Yan et al. 21 have used numerical methods to study the new characteristics of VAWT. In recent years, the identification method of vortices in the flow field has been improved continuously, which plays an important role in the flow field analysis. 22 studied tip clearance on pressure fluctuation intensity and vortex characteristic of a mixed flow pump as turbine at pump mode; C Liu 23 researched symmetrical and unsymmetrical tip clearances on cavitation performance and radial force of a mixed flow pump as turbine at pump mode; Liu C researched method of C groove on vortex suppression and energy performance improvement for a NACA0009 hydrofoil with tip clearance in tidal energy; 24 and YN Zhang et al. 25 done cavitation-vortex-turbulence interaction and one-dimensional model prediction of pressure for hydrofoil ALE15 by large eddy simulation. These studies provide a reference for the analysis of VAWT flow field. In addition, PIV is an advanced and intuitive means to study flow visualization. Foreign scholars such as N Fujisawa et al. 26 and Ferreira 27 researched dynamic stall on Darrieus wind turbine blades; Tescione et al. 28 studied the development of H-type wind wheel near tail track; and Dobrev et al. 29 studied the aerodynamic characteristics of VAWT visually and obtained important aerodynamic characteristics. In China, ZY Gao et al., 30 XQ Dong et al., 31 and other scholars have used this method to study the wake field of horizontal axis wind turbine, and JP Xiao et al., 32 R Guo et al., 33 and other scholars have studied the flow structure of blade airfoil. However, there are few studies on the flow field of VAWT. Especially, there are few studies on VAWTs with lift-drag combination structure. The internal flow field of VAWTs with lift-drag combination structure is complex, so it is more valuable to carry out visualization research to reveal the flow mechanism of the flow field. Therefore, this method is adopted in this study. The reason for the regular variation of flow field and the mechanism of the advantages in aerodynamic characteristics of the LDCS were analyzed.
Modeling
Figure 1 presented the designed models of a LDCS and a dragging starter. Defining U as the direction of the airflow, the starter rotated in a counterclockwise direction and θ denoted the azimuth angle of rotation. Figure 1(a) indicated the model of the LDCS. This model had two lift-drag combined blades installed on both sides of the beam by 180° azimuth. The lift-drag combined blade consisted of a semi-elliptical cylindrical drag blade and a small lift blade with the airfoil of NACA0018. Figure 1(b) showed that the model of the DS consisted of two semi-elliptical cylindrical drag blades to produce high aerodynamic torque. The installation position of the drag blade was consistent with that of the LDCS. Figure 2 indicated the flow field visualization test model. The test model was made of high transparent glass to ensure a clear image in the flow field visualization test. The detailed structural design parameters of the two models were shown in Table 1.

Schematic diagram of the model: (a) model of LDCS and (b) model of DS.

Blades model of flow visualization test: (a) lift-drag combined blade and (b) drag blade.
Designed structural specifications of LDCS.

LDCS: lift-drag combined starter; DS: drag starter.
Study methods
In this research study, the numerical simulation method was carried out to evaluate the aerodynamic characteristics of the lift-drag starter. The airflow field was observed and analyzed using PIV flow field visualization method.
Numerical computation method
The numerical simulation study of both starters was based on the mechanical model and structural parameters. The structural models and grid were created using Auto-CAD and gambit software, respectively, and imported into the fluent of ANSYS 18.0 for data analysis. The boundary conditions of the simulation of the area were shown in Figure 3. The length and width of the simulation area were 15 and 10 times the diameter of the model, respectively. The sliding mesh was applied to simulate rotational motion. Slip grid was used and a 1.5D rotational domain was set around structural modeling while the time step was set 0.00167 s when model speed reached 100 rpm.

Computational domain and boundary condition diagram.
The proper number of mesh was the basis of reducing the simulation time and ensure accuracy. Therefore, the grid independence verification must be conducted before numerical simulation. The five different grid numbers in the rotating domain were selected for verification in this study with the condition that the grid number of static domain unchanged. The Table 2 presented the result of DS torque coefficient value under the azimuth angle of 0°. The grid is shown in Figure 4.
Results of the grid verification.


Grid model diagram.
The results were not similar but the values of the last two numbers were observed similar, which was not more than 3%. Therefore, the number of rotating domain grids in this study was selected as 140,000.
The RNG k-ε turbulence model was applied during the solution simulation stage. The velocity and pressure were considered as inlet and outlet boundary conditions, respectively, while the central difference scheme was used for the diffusion term. The second-order upwind is used for the convection term and simulation was completed by the SIMPLE algorithm method.
PIV flow field visualization method
Principle of PIV
PIV is a method of measuring the flow velocity by recording the position of particles in the flow field repeatedly and analyzing the captured image. In a two-dimensional PIV system, the positional relationship of image points on the acquisition plane can be determined based on the imaging relationship of the two particles located on the acquisition plane.
34
Figure 4 showed the image on the particle recording plane under the sheet light source, and D is defined as the displacement of the particles in the laser pulse interval; thus, the particle displacements in the space X, Y, and Z were
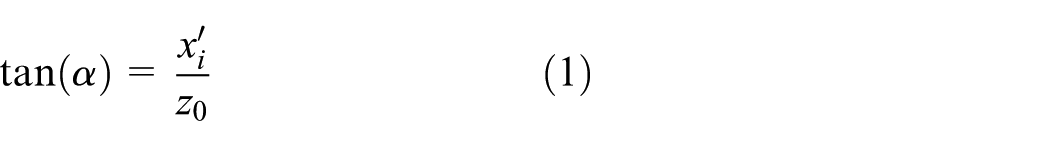
When the particle displacement was D, the image displacement became


Image of particle recording plane in light source.
The particles were in a two-dimensional plane, so the particle displacement in the Z direction

where
If the X axis is the observation plane and parallel to the axis of the eddy current and outside the vortex core, the function of each velocity component can be obtained


After obtaining the flow field velocity distribution by equations (5)–(7), the physical form of the flow field can be displayed by cross-correlation simulation.
Test system establishment
The PIV experiment system is consisted of the DC low-speed wind tunnel, PIV test system of TSI, and the independently designed test bench. The PIV test system included a laser, a laser pulse synchronizer, a CCD camera, and a smog generator. The tracer particles were inserted from the inlet section of the wind tunnel to ensure the uniform particle flow in the measurement section, and the experimental velocity was set to 4 m/s to ensure the uninterrupted flow field around the model. The text system site was shown in Figure 6 and the equipment with parameters and precision were presented in Table 3.
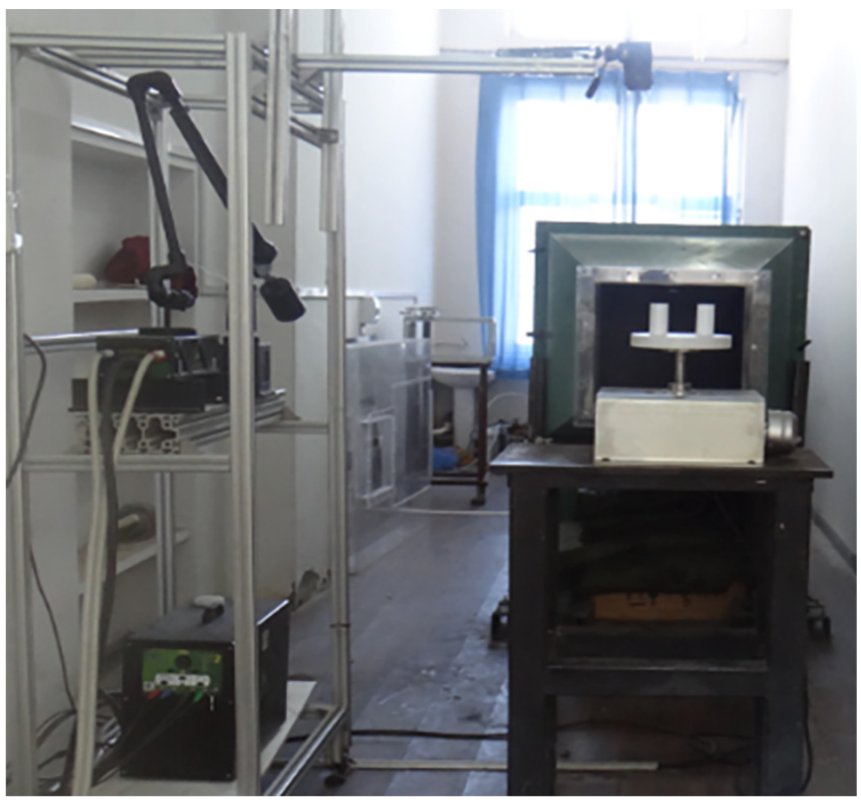
PIV text system.
List of equipment with parameters and precision.

Test method
The flow field image around the test model blades was acquired by the low-speed wind tunnel and captured by CCD camera. The low-speed wind tunnel provided the steady airflow under the studied conditions according to the Reynolds similarity criterion and the generator delivered the tracer particles. The test model was illuminated by a pulsed laser and the velocity image of the tracer particles in the airflow was captured by the CCD. Finally, the specific system software was used for function simulation and image processing to generate the flow field visualization image.
Results and analysis
Static starting characteristics
The static starting characteristics were primarily studied to determine the minimum torque required to overcome its internal frictional drag during static starting of a wind turbine. This minimum torque value is termed as static starting torque of the wind turbine and static torque coefficient of a wind turbine without dimension denoted by

Static torque coefficient with the azimuth angle of the two starters.
Figure 7 indicated that the static torque coefficients of LDCS and DS reached two peaks and one lowest point in a rotating period. The static torque coefficients of LDCS and DS showed a similar trend at the azimuth angles lies in 0°–180°, but at the range of 100°< θ < 140°, the static torque coefficient of DS is significantly larger than that of LDCS while the static torque coefficient of LDCS was higher than that of DS at the remaining azimuth angles. In the interval from 80° to 100°, the difference of static torque coefficient of LDCS and that of DS was increased to maximum. At θ = 80°, the LDCS and DS produced maximum and minimum static torque coefficient, respectively, with the difference of 0.093.
In addition, the static torque coefficient of DS reaches the peak value near θ = 115° while the static torque coefficient of LDCS gave the lowest static torque coefficient −0.0426. However, this value is still higher than that of the DS (–0.0573) at θ = 90°. The average static torque coefficients of LDCS and DS starters were 0.0365 and 0.0338, respectively, after each rotating cycle. The static torque coefficient of LDCS was found 8% higher than that of DS.
In order to analyze the static torque coefficient of LDCS and DS, the pressure contours and velocity streamlines diagram through CFD numerical simulation and the velocity vector image through PIV visualization were obtained with different azimuth angles. The specific research results are analyzed as follows.
θ = 0° and θ = 180°
It can be seen from Figure 8 that the static torque coefficients of LDCS and DS are not quite different at the two azimuth angles of θ = 0° and θ = 180°, which can be explained by the flow field distribution law. As the starter was designed with two blades and the rotating cycle is 180°, θ = 0° and θ = 180° were the same azimuth position. The θ = 0° image was used to analyze the airflow as shown in Figure 8.
CFD and PIV image of static flow field of two starters (θ = 0°): (a) CFD image of DS, (b) PIV image of DS, (c) CFD image of LDCS, and (d) PIV image of LDCS.
The image of PIV was shown in Figure 8(a) and (c) and the images of CFD in Figure 8(b) and (d) were compared at θ = 0°. The results showed that the tailing vortex position and distribution of PIV results that were like that of CFD were reliable. The grid division and the model establishment of the CFD were productive.
Figure 8(a) and (b) showed the flow field distribution around the DS at the azimuth angle of θ = 0°. The pressure difference and drag were observed low on both sides of the drag blade. The flow velocity in the leeward region of the lower blade was significantly high with the visible vortex. Therefore, there is a large pressure difference between the windward and leeward regions, and the drag force on both sides of the blade was significant which resulted in the main driving force of the two-blade DS at this azimuth angle.
Figure 8(c) and (d) showed the flow field distribution around LDCS at the azimuth angle of θ = 0°. The diagram illustrated that the drag blades in the LDCS provide a clockwise drag torque and the lift force is in the direction of the rotation axis. The installation of the small lift blade did not increase the aerodynamic force of the upper blade, but the separation of the flow field at the trailing edge of the drag blade was improved. However, the wake flow field of the lower blade changes greatly. Owing to the diversion of the small lift blade, the vortex close to the lower drag blade tends to develop backward.
It was found from Figure 8(b) and (d) that the vortex in the wake flow region of the LDCS is changing so the aerodynamic torque of LDCS is slightly smaller than that of DS.
θ = 60° and θ = 140°
It was depicted from Figure 7 that the static torque coefficients of LDCS and DS had two peaks that appeared at θ = 60°and θ = 140°; the second peak of LDCS was 20° after that of DS. The static torque coefficient of the LDCS at both peaks was higher than that of DS. At θ = 60° and θ = 140°, the torque coefficient of LDCS was 0.009 and 0.0093 higher than that of DS, respectively.
The image of PIV and CFD at two angles was analyzed to evaluate the difference in the static torque coefficient by Figures 9 and 10. Figure 9 showed the flow field image at θ = 60° while Figure 10 illustrated the flow field image at θ = 140°.

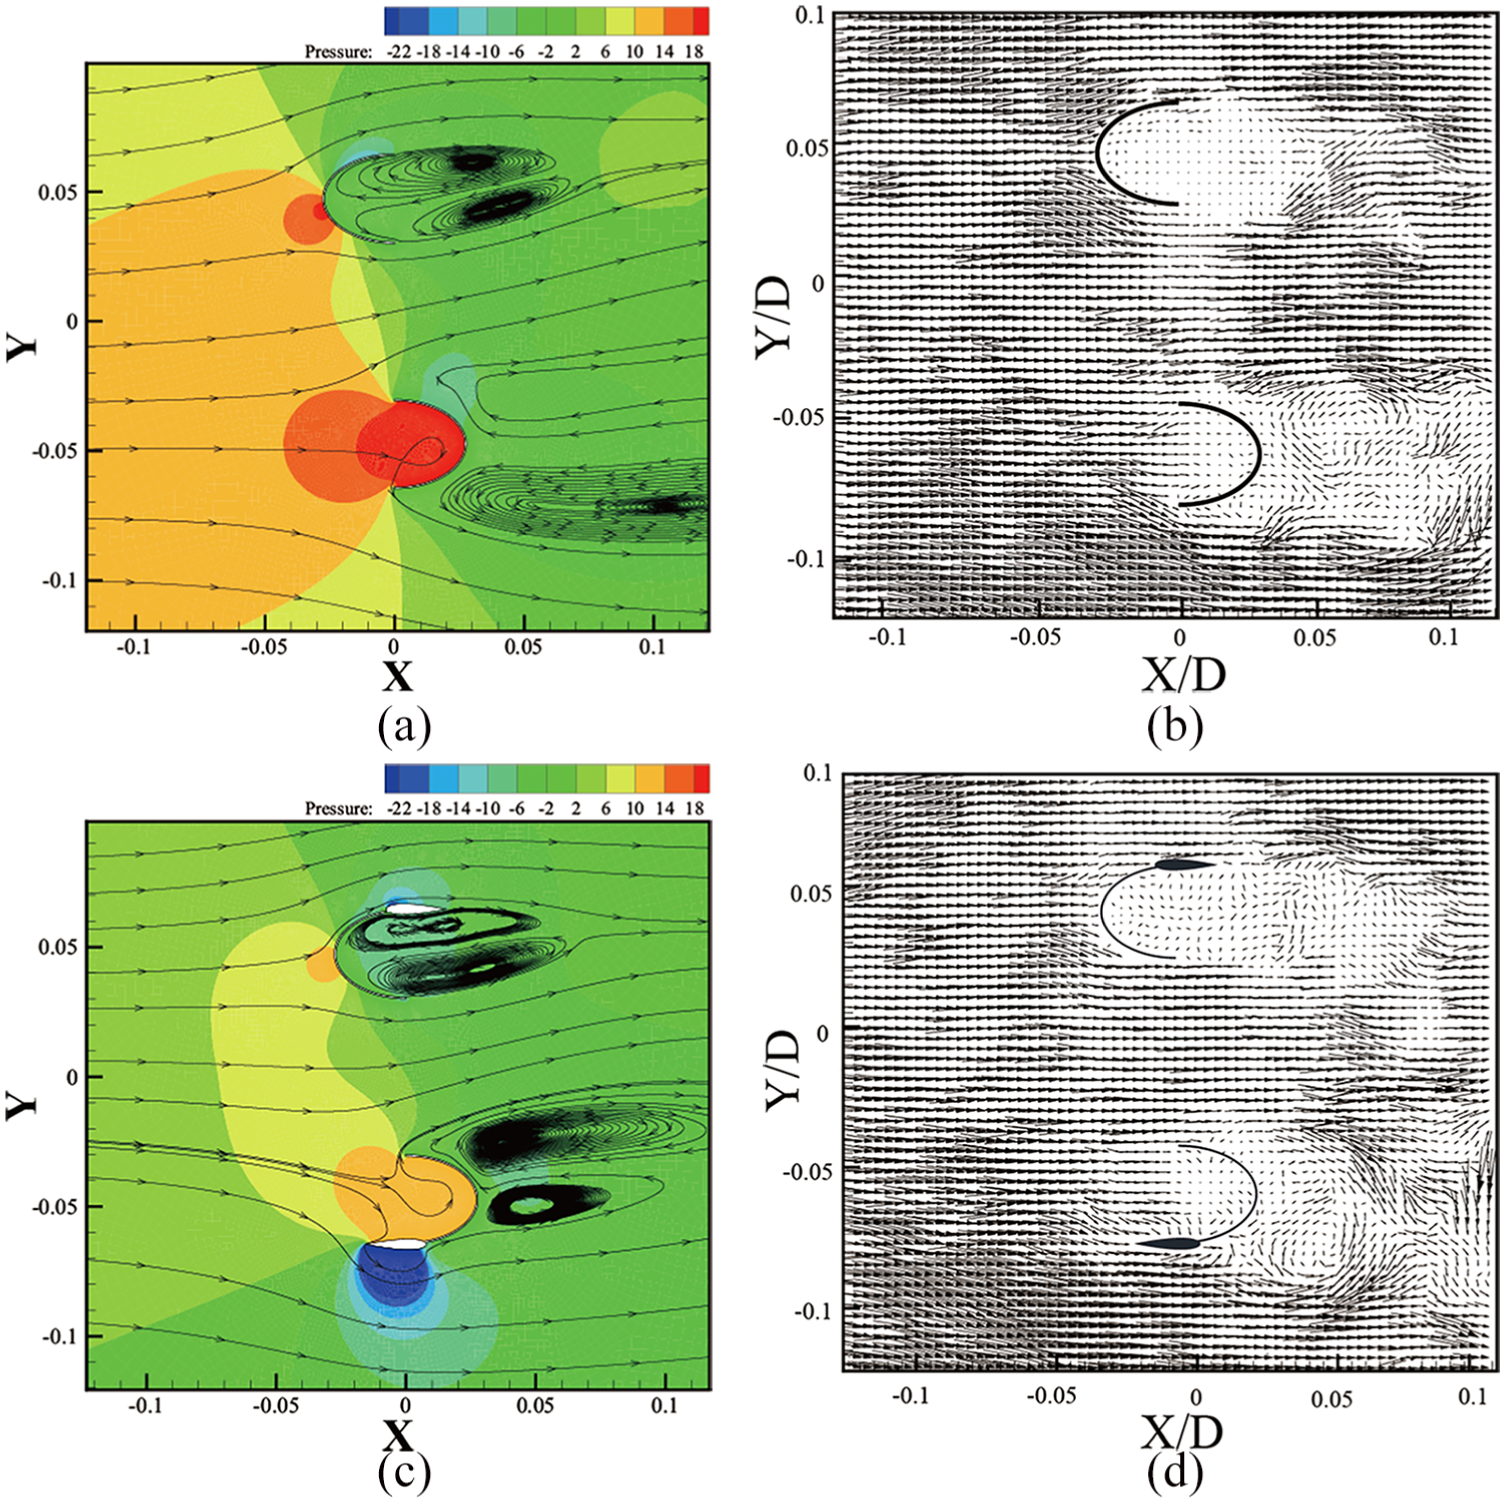
CFD and PIV image of static flow field of two starters (θ = 60°): (a) CFD image of DS, (b) PIV image of DS, (c) CFD image of LDCS, and (d) PIV image of LDCS.

CFD and PIV image of static flow field of two starters (θ = 140°): (a) CFD image of DS (b) PIV image of DS, (c) CFD image of LDCS, and (d) PIV image of LDCS.
Figure 9(a) showed that the large pressure field was developed on both sides of the blade and produced a clockwise drag. The lower blade of DS transformed the wind direction slowly and the wind moved into the blade. The high counterclockwise aerodynamic force was generated on the windward and leeward sides of the lower blade which initiated the DS to start and rotate. Figure 9(b) showed that the upper blade on the DS faced the wind at this azimuth angle and the wind passed through the upper drag blade and produces a large vortex at the behind. Therefore, the DS produced the highest torque coefficient at the azimuth angle.
Figure 9(c) showed the pressure difference at the wind side and rear side of LDCS was higher than that of DS and developed a high aerodynamic force to drive LDCS. The windward area of the lift-drag combined blade was significantly increased due to the small lift blade, and the internal airflow was enhanced. Owing to the blocking effect of the blade, the flow velocity was reduced, and the fluid pressure was significantly increased. The small lift blade breached the vortex and expanded the wake flow region. Figure 9(d) showed the presence of the small lift blade had a significant diversion effect on the wind. The rear vortex of the wake flow of small lift blade moved rearward and a big vortex was developed. The subsequent flow was uniform and created high-pressure difference at the windward and leeward sides of the lower blade and resulted in a higher aerodynamic force of LDCS than that of DS.
The vortex in Figure 9(b) and (d) illustrated that the distribution width of the vortex at the tailing flow of LDCS was larger compared with DS while the flow range of the influence wake of DS was larger. Therefore, the first peak of the static torque coefficient of LDCS appeared at this angle significantly higher than DS.
Figure 10(a) cleared that at the azimuth angle of θ = 140°, the upper blade of the DS faced the wind. The wind flows and the pressure inside the blade increased significantly, and the windward and leeward surfaces of the lower blade generated a large counterclockwise aerodynamic force to rotate DS. Figure 10(b) cleared that the wind flows through the upper drag blade produced a large vortex at the rear and a large pressure field was developed at both sides of the blade which resulted in a clockwise drag. The lower blade of the DS responded to the flow slowly. Moreover, their static torque coefficient was maximum. This drag was clearer in the image. The leeward surface produces a low-pressure divergent vortex and the area becomes larger. The aerodynamic force at the blade at the azimuth angle of θ = 140° was slightly lower than that at θ = 60° and the static torque coefficient of DS was also low.
Figure 10(c) indicated that at the azimuth θ = 140°, the wind passed along the surface of the small lift blade and increased the flow, and flow velocity resisted by the surface of small lift blade was reduced while the pressure increased significantly. Figure 10(d) indicated that at this azimuth angle, the presence of the small lift blade had a significant diversion effect on the wind after the upper blade of LDCS faced the flow. The rear vortex of small lift blade moves rearward and developed a larger vortex. The windward and leeward sides of the upper blade of LDCS were bigger than that of DS and developed a large aerodynamic force to propel LDCS due to the increased pressure difference of the driving forces. When the lower blade of the LDCS faced the wind, the windward area of the lift-drag combined blade was increased as a result of the small lift blade and the internal airflow was also enhanced. The airflow velocity was greatly reduced, and the fluid pressure was further increased due to the blocking effect of the blade. The aerodynamic force that propelled the LDCS was larger than that of the DS. Therefore, the second maximum of the static torque coefficient observed at this azimuth angle was significantly higher than that of DS.
It was found that the small lift blade breached the originally generated vortex and further expanded the region as compared with the Figure 9(c) at θ = 60° at the same time duration. The subsequent flow was more stable so the pressure difference between the windward and leeward sides of the lower blade was slightly smaller.
60°< θ < 100°
It was illustrated in Figure 7 that the static torque coefficient of LDCS was significantly higher than that of the DS in the range of 60°< θ < 100°. The static torque coefficient of DS at θ = 80° was 0.0055 and showed the least (–0.057) at θ = 90° while the least static torque coefficient of LDCS were 0.0669 and 0.031 at θ = 80° and θ = 90°.
The difference of the static torque coefficients of the two starters were 0.0614 and 0.088 at the azimuth angle of θ = 80° and θ = 90°, respectively, which indicated that the LDCS exerted the aerodynamic advantages at the azimuth angle of 80°< θ < 90°. The flow field image of the PIV and CFD at θ = 80° presented in Figure 11 was compared and analyzed. The trend of flow field captured by PIV result is not such clear in this azimuth angle, because of the shadow of the blade model.

CFD and PIV image of static flow field of two starters (θ = 80°): (a) CFD image of DS, (b) PIV image of DS, (c) CFD image of LDCS. and (d) PIV image of LDCS.
It was shown in Figure 11(a) and (b) that the wind area of the two drag blades of DS in the inflow was small at the azimuth angle of θ = 80°and the leading edge of the upper blade was in the windward position. The wind area accounted for one-fourth of the blade area and the convex surface was facing the wind, so the drag coefficient was less and obtained no windward drag. The convex surface of the lower blade received wind at the windward area of less than one-fourth of the blade area, and the driving force of the clockwise drag caused by wind drag was not large. The lower blade of DS was in the wake flow field of the upper blade and the inner center of DS brings the disordered incoming flow to the lower blade due to the large influence of vortex. The wake flow of the upper blade had impacted on the aerodynamic force of the lower blade and produces little aerodynamic force. The drag blades of DS were in the position where the aerodynamic force was non-significant at this angle.
It was shown in Figure 11(c) and (d) that the two lift-drag combined blades of the LDCS enhanced the wind area of the blade at the azimuth angle of θ = 80° due to the small lift blade. The wind flowed through the blade and passed along the surface due to the diversion of a small lift blade, which improved the vortex effect inside the blade and the wake flow. The upper blade of the lift-drag combined blade had a distinct high-pressure zone on the windward side of the small lift blade, where the lift-drag was large, and the lift was exerted. The drag blade produced the driving force of drag based on the wind area. The lower blade of the LDCS introduced the smooth flow of the flow field outside and into the blades due to the small lift blade and the high-pressure zone was developed in the blade. The range of the low-pressure area was significantly larger than that of the drag blade vortex because of the diversion of the leeward side of small lift blade as shown in Figure 11(a) and (b). The aerodynamic force was enhanced significantly on both sides of the lower blade of the lift-drag combined blade and the LDCS had a large static torque coefficient at this azimuth angle because of the lift of the small lift blade.
The airflow law of the DS was improved when the LDCS ranges 80°< θ < 100°. The rotational aerodynamic force of the starter was not only generated by the wind drag but also the lift and the drag of the small lift blade. This was the advantage of LDCS compared to the DS in static starting characteristic.
100°< θ < 130°
It was depicted in Figure 7 that the static torque coefficient of LDCS was lower than that of DS, particularly the static torque coefficient of LDCS was lowest at −0.043 at θ = 115° and the static torque coefficient of DS was 0.035. The static torque coefficient of LDCS and DS were −0.0192 and 0.047, respectively, at θ = 120° which were apparently different than each other at the range of 100°< θ < 130°. The flow field image of the PIV visualization flow field and numerical simulation vortices contour at θ = 120° were used to analyze the reason why the static torque coefficient of LDCS was low in this range and to improve the situation in the future as shown in Figure 12.

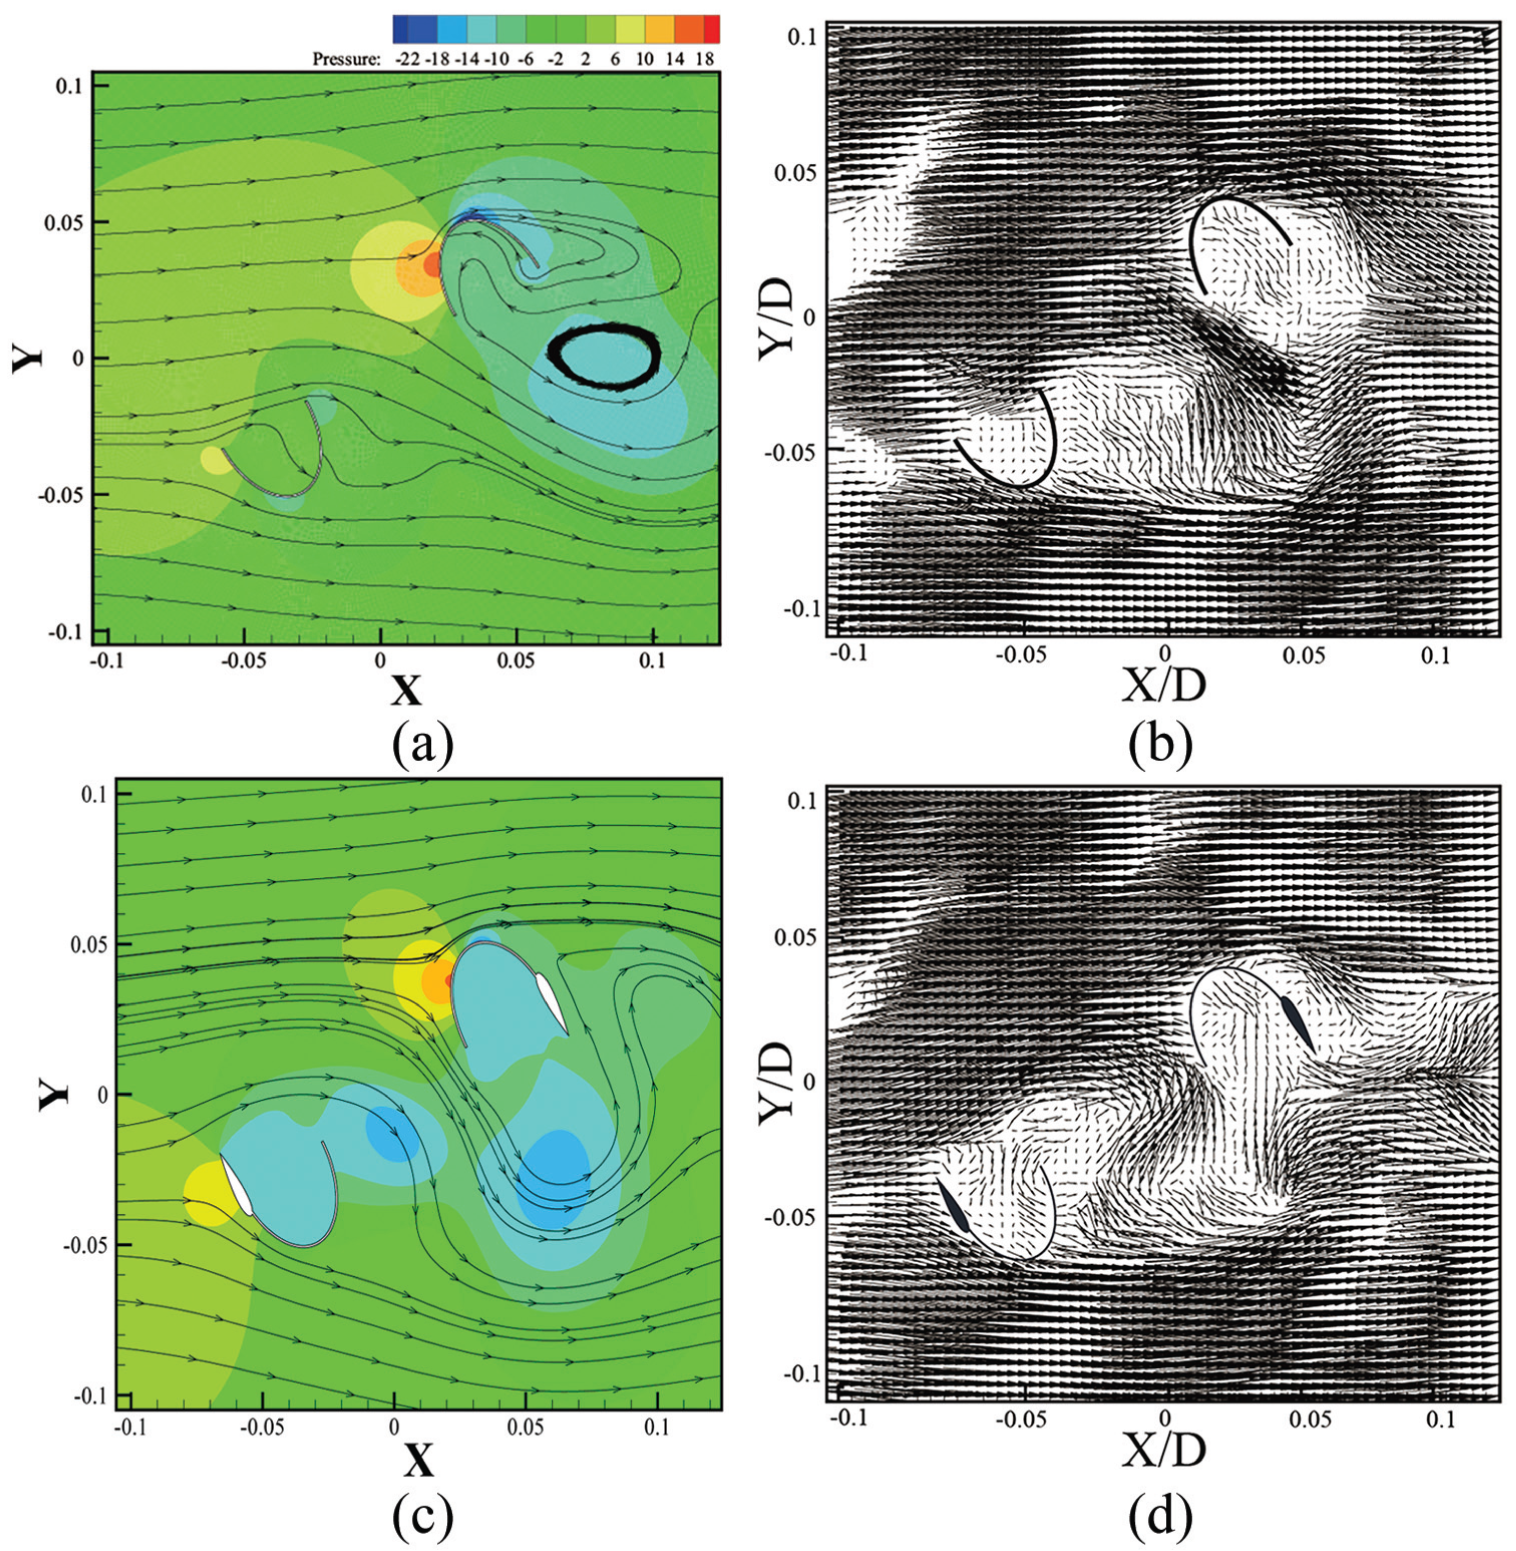
CFD and PIV image of static flow field of two starters (θ = 120°): (a) CFD image of DS, (b) PIV image of DS, (c) CFD image of LDCS, and (d) PIV image of LDC.
Figure 12 illustrated that at the azimuth angle of θ = 120°, the image of two starters was similar of CFD and PIV, and their features were well stated in numerical simulation image. In Figure 12(a) and (b), the leading edge of the upper blade of DS was in the windward position, the wind area is responsible for about half of the blade area, and the convex surface was facing the wind; thus, a high-pressure zone was produced by windward drag. For the lower blade, the concave surface was facing the wind, and the velocity of the airflow into the drag blade was sharply reduced, so that a large high-pressure zone was produced in the concave surface and the wake flow region of the protected side of the lower blade generated the large vortex and low-pressure zone as the obstruction of the concave surface of blade. The difference between the generated torque of the lower blade and the upper blade was the driving force to rotate the DS. The driving force torque was large, and the static torque coefficient of DS was high.
It was expressed in Figure 12(c) and (d) that at the azimuth angle of θ = 120°, the two lift-drag joined blades of LDCS changed the airflow law of the two blades of DS due to the small lift blade as shown in Figure 12(a) and (b). The front wind area at the leading edge of the upper blade of the lift-drag combined blade was the same as that of the drag blade. However, on the surface of the small lift blade, the airflow continuously flows because lift blade influenced the wake flow of blade which generated a large vortex and the upper blade of the lift-drag combined blade was subjected to an extended drag, which hinders rotation. The wind area at the leading edge of the lower blade of the lift-drag joined blade enhanced with small lift blade and the drag on the lower blade was increased. The incoming flow cannot enter the lower blade and flows rearward around the trailing edge of the lift blade, and then, a negative pressure zone comes out in the lower blade due to the lack of fluid. The flow was smoother than the wake flow of the drag blade at the leeward side of the concave blade, the vortex was smaller, and the lower blade did not generate clockwise aerodynamic force, so the aerodynamic force of the lift-drag combined blade contradictorily to the direction of rotation was greater. The static torque coefficient of LDCS was small and negative, and much smaller than the positive static torque coefficient of the DS blade at this azimuth angle.
From the comparison of the results of the above PIV visualization and CFD numerical simulation, it can be seen that the numerical simulation results expressed by the pressure contours and velocity streamlines diagram are in accordance with the PIV velocity vector diagram. The shape and position of the wake vortex are basically the same, and the experiment and simulation are qualitatively identical. The numerical simulation is credible.
Dynamic output characteristics
The dynamic output characteristic was studied to evaluate the variation of the dynamic characteristics produced by the rotating wind turbine under the action of the airflow. The velocity of the two starters was 4 m/s and the model rotational speed was 100 rpm. The rotational moment characteristic of the two starters after one revolution was subject to the numerical simulation, and the change curve of rotational moment coefficient with the azimuth angle was gained, as depicted in Figure 13.

Change curves of rotational moment coefficient of the two starters with the azimuth angle after one dynamic rotation.
Figure 13 cleared that the modification rules of the rotational moment coefficients of LDCS and DS curves were likewise with the azimuth angle, and there were a peak and a depression. The rotational moment coefficient of LDCS was significantly greater than that of DS at the ranges of 40°< θ < 110° and 160°< θ < 180° while the rotational moment coefficient was slightly lower at other azimuth angles. The peak rotational moment coefficient of LDCS was 0.11, and the lowest coefficient was −0.052. The peak rotational moment coefficient of DS was 0.076, and the minimum coefficient was −0.04. The percentage increase in rotational moment coefficient of LDCS was 89% compared with the maximum value of DS, and the percentage of reduction in the minimum value was only 30%; it was observed that the dynamic output characteristics of LDCS were better than that of DS.
In order to analyze the dynamic output characteristics of LDCS and DS, the images of the PIV visualization and CFD numerical simulation were obtained. The dynamic flow field images of the rotational moment coefficient of the two starters were maximum at θ = 60°and valley at θ = 120° as shown in Figures 14 and 15, respectively.

CFD and PIV image of the dynamic field of two starters (θ = 60°): (a) CFD image of DS, (b) PIV image of DS, (c) CFD image of LDCS, and (d) PIV image of LDCS.
CFD and PIV image of the dynamic field of two starters (θ = 120°): (a) CFD image of DS, (b) PIV image of DS, (c) CFD image of LDCS, and (d) PIV image of LDCS.
It was shown in Figure 14(a) and (b) that at the azimuth angle of θ = 60°, after the upper blade of DS was facing the wind and the wind flows through the upper drag blade, the airflow quickly flows to the back of the blade, and there was an obvious separation on the blade surface. A small pressure difference was produced on both sides of the blade, reducing the aerodynamic force. Around the lower blade of the DS when the wind flows into the blade, a large counterclockwise aerodynamic force developed on the windward and leeward faces of the lower blade. The developed aerodynamics force rotated the DS while the airflow rotates in the blade and along the edge of the lower blade to the rear and form a vortex at the wake flow.
Figure 14(c) and (d) showed that the upper blade of LDCS facing the wind had a significant effect on the diversion of the airflow because of the presence of the small lift blade. The airflow passed along the surface of the small lift blade to the wake flow, which makes the airflow separation behind the blades smaller. A large pressure difference was generated on both sides of the blade, and the aerodynamic force increased. The pressure difference of windward and leeward sides of the upper blade of LDCS was higher than that of DS, and a higher aerodynamic force was produced to drive the LDCS to start. The lower blade of the LDCS faced the wind and the windward area of the lift-drag combined blade was obviously increased due to the addition of the lift blade, and the flow of the internal airflow was increased. The airflow velocity was significantly reduced due to the blocking effect of the blade and the fluid pressure and low-pressure vortex were increased. In addition, the large aerodynamic force at LDCS was enhanced. In the lower blade of LDCS with the wake flow region of DS, it can be found that the wake flow vortex surface of LDCS becomes smaller behind the lift-drag blade. The windward and leeward faces of the lower blade also produce a larger pressure difference which increased the aerodynamic force of LDCS compared with that of DS. The airflow distribution law of the original DS was improved due to the small lift blade of LDCS and the rotational moment coefficient of LDCS was higher than that of DS, so the output characteristics were better.
Figure 15(a) and (b) showed that at the azimuth angle of θ = 120° when the leading edge of the upper blade of DS was in the windward position, the wind area accounts for about half of the blade area. The convex surface faced the wind and the airflow behind the blade forms a large separation from the blade which resulted in a decrease of the aerodynamic forces of the upper blade. When the lower blade of DS faced the wind, the concave surface faced the wind and the airflow inside the drag blade. A large pressure difference was produced inside and outside the blade which further enhanced the rotation of the blades, so the moment coefficient of DS was higher.
It was expressed in Figure 15(c) and (d) that at the azimuth angle of θ = 120°, the upper blade of the LDCS faced the wind. The wind area accounted for about half of the blade area with the presence of the small lift blade and the airflow continued to flow on the surface of the lift-drag combined blade. The blade wakes’ flow separation was reduced which increased the aerodynamic force of the lift-drag combined blade. When the lower blade of the LDCS faced the wind, the wind area at the leading edge of the lower blade of the lift-drag combined blade increases after the small lift blade was added, and the drag of the lower blade was increased. However, owing to the blocking of the small lift blade, the incoming wind did not enter the lower blade but flowed back around the trailing edge of the lift blade, so that the aerodynamic force decreases due to a lack of fluid ingress in the lower blade. The analysis interpreted that the two lift-drag combined blades of LDCS change the flow conditions of the airflow between the two blades of the DS due to the installation of small lift blade. When the airflow passes through the inside of the starter, the flow direction changed, which affects the airflow speed, and then upsets the output features of the entire starter. Therefore, in the case of the combined action of the aerodynamic forces of the upper and lower blades, the outcome characteristics of the LDCS were not good, and the rotational moment coefficient was significantly lower than that of DS. However, the poor output of this orientation occurs when θ = 120° only in a rotating cycle, so the influence orientation was small, and the LDCS still had an advantage from the comparison of the average output rotational moment characteristics.
Figures 14 and 15 show that the field of CFD is similar to that of PIV, but there are differences. The flow of numerical simulation structure is the result of gradual average. The wake has periodicity and symmetry The velocity field of PIV visualization is random and unique. Compared with the numerical simulation PIV visualization, it is easier to show the vortex structure.
Conclusion
This research study summarized the following conclusions by numerical simulation and flow field visualization study on the aerodynamic characteristics of the LDCS and the DS:
The static starting characteristics showed that the static torque coefficient of DS was significantly larger than that of LDCS in the range of 100°< θ < 140°. The static torque coefficient of LDCS was higher than that of DS at the remaining azimuth angles range of 80°< θ < 100°°. The static torque coefficient of LDCS was the highest compared to that of DS and the average static torque coefficient of LDCS of the two starters was increased by 8% compared with that of DS.
The dynamic output characteristics cleared that the rotational moment coefficient of LDCS was significantly higher than that of DS at the ranges of 40°< θ < 110° and 160°< θ < 180°. The maximum amplification percentage of rotational moment coefficient of the LDCS observed was 89% compared to that of the DS, and the minimum decreasing amplitude was only 30%. The dynamic output features of the LDCS were found better than that of DS.
It can be measured that the LDCS improved the inner flow of the starter. When the lift-drag combined blade with small lift blade, the flow continues to climb along the small lift blade on the windward side of the upper blade which reduced the flow separation and increased the aerodynamic characteristics of the LDCS. The windward area in the concave surface of the lower blades was enlarged and increased the torque value of lift-drag combined blade. The rotational aerodynamic force of the LDCS was generated by the resistance of the drag blade and the lifting power of the small lift blade. The moment coefficient of the LDCS was enhanced and its static start characteristics and dynamic output characteristics have significant advantages, which improves the aerodynamic characteristics of the legacy device DS.
Footnotes
Handling Editor: Xiaoxiao Han
Declaration of conflicting interests
The author(s) declared no potential conflicts of interest with respect to the research, authorship, and/or publication of this article.
Funding
The authors disclosed receipt of the following financial support for the research, authorship, and/or publication of this article: The project was supported by Foundation of Key Laboratory of Wind Energy and Solar Energy Technology, Ministry of Education, Project No.2017MS02. The authors would like to thank the support.