
Abstract
The processes of three-dimensional optical scanning depend on the reflection of the surface to be digitized. To scan specular or translucent surfaces, it is necessary to apply a coating material which interferes with the accuracy of the three-dimensional measurements. This study proposes the use of gold, silver, platinum, and carbon by sputtering to coat the surfaces to be scanned. The effects of these materials on the accuracy of the three-dimensional scanning were evaluated and compared with those of two frequently used materials, namely, talc and non-aqueous wet developer for penetrant testing. To verify the resulting geometric variations, specimens were scanned before and after the application of each coating material. The results showed that the intrinsic errors of the three-dimensional scanning process, such as the registration of several point clouds, can have more significant effects than the coating material used. Measurements taken from a single point cloud showed dimensional tolerances of approximately 0.01 mm for gold, platinum, and carbon coating. These coatings offer significantly higher accuracy than the traditionally used developer and are suggested for accurate three-dimensional scanning of specular and translucent surfaces.
Introduction
Three-dimensional (3D) laser scanning is ideally suited to the measurement and inspection of contoured surfaces and complex geometries. If the data are to be used for inspection, the scanned object can be compared to the designer’s CAD nominal data.1,2 The 3D data can also be used for evaluation of part wear after use.3–6 The 3D scanning has also been applied in forensics7–9 and in medicine.10,11 For all the cases mentioned above, the process is similar: the surfaces are scanned for evaluation and compared with a pattern, which may be either a digital model or any other scanned part/object.
There are numerous 3D scanners on the market today. Among these, 3D optical scanning technology is one of the most used, and the advantage is that it requires no contact with the object being scanned. However, the process depends on the characteristics of the surface to be scanned. Optical scanning systems can obtain data by sending laser light onto the object and processing the data obtained from the returning light. Accordingly, problems typically occur in the scanning of transparent or translucent materials, with shiny or specular surfaces and dark-colored surfaces.
In previous works, Meriaudeau et al. 12 reported the use of ultraviolet (UV) structured point for transparent object 3D measurement. Osorio et al. 13 presented the use of a commercial scanner with modified light source, but using infrared light for transparent materials and UV light for specular surfaces. G-H Liu et al. 14 studied the solution of the problem by using a conventional structured light scanning system with two cameras. Ihrke et al. 15 described the approaches to scanning of transparent and specular materials; however, the authors observed that the solutions are still very specific and that the difficulties for the traditional acquisition techniques still remain. A traditional approach used to resolve both the problem of transparency of the surface and the specular reflection is to apply coating materials.16–18
Palousek et al. 17 evaluated the measurement deviation in a 3D digitizing process of glossy surfaces coated with titanium dioxide (0.003 mm) and chalk powder spray (0.044 mm). The authors point that the chalk powder contains particles of approximately 0.009 mm, which, after application, remain sharply defined on the surface, and smaller particles, which form islets and a characteristic spatter diameter of up to 0.050 mm.
Mendřický 18 analyzed how seven commercial products (titanium dioxide and anti-reflective chalk sprays) affect the work-piece dimensions and the ease of coating removal. The author found that titanium dioxide yielded the thinnest layer (0.008 mm on average) but had the worst washability results. Using a developer (chalk spray), the lower average thickness was 0.016 mm associated with the best washability results. In addition, the author highlights that obtaining an optimal layer thickness requires a lot of experience and a skilled operator.
As shown in related works, when the surface is coated with some material, consequently, there is an increase in its dimensions. Therefore, we propose new alternatives of materials to coat the surfaces to be scanned. Sputter coating for Scanning Electron Microscope (SEM) was the process used to obtain ultra-thin coating. This process can be applied to small parts where high accuracy is required. This study evaluates the effects of six different surface coating materials on the accuracy of 3D scanning. Two are traditionally used for this purpose (talc and non-aqueous wet developer for liquid penetrant testing) and four are alternative materials used for SEM imaging (gold, platinum, silver, and carbon).
Materials and methods
The method used to evaluate the effects of the six coating materials consisted of creating a digital model, machining the samples on Computer Numerical Controlled (CNC) milling machine, scanning the samples produced, applying the coatings, scanning the coated samples, comparing the scanned models before and after coating, and analyzing the resulting geometric variations.
To create the digital model, the surfaces were modeled to be straight (steps) or curved (radii) with protrusions and grooves that could be affected by coating. The features were approximately 0.5 mm wide and the model external dimensions were 16 × 16 × 10 mm, as shown in Figure 1.
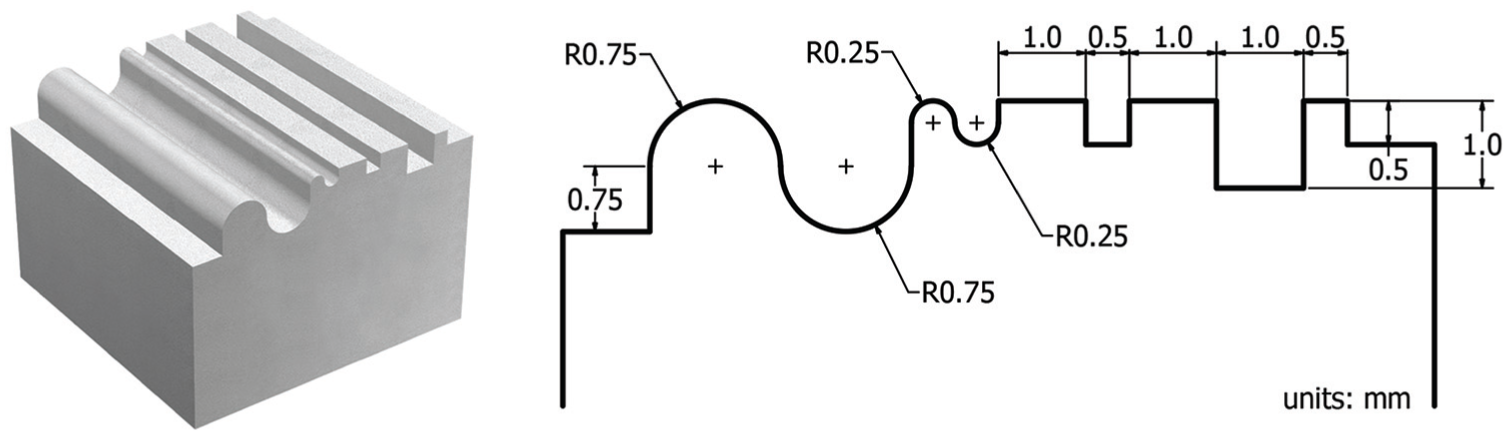
Digital model and its geometric profile.
The models were designed in CAD and manufactured by CNC machining in a Tecnodrill® Digimill 3D using Ren Shape® 460, a medium-high density polyurethane modeling board. The material of the test part was chosen as matte to allow it to be scanned without coating. In a single board, 56 samples were machined and randomly divided into seven groups of eight samples each. To quantitatively analyze the resulting surface structure, a group of eight machined samples was characterized for surface roughness. Roughness average (Ra) measurements were carried out by a stylus profilometer (Mitutoyo Surftest 401). The Ra mean value was 4.8 µm, with a standard deviation of 0.2 µm.
In group 1, the specimen surfaces were gold coated with a Balzers® SCD 050 sputter coater for 80 s at 40 mA. In group 2, the surfaces were platinum coated with the same equipment, using the same parameters. In group 3, the surfaces were carbon coated with the same equipment, for 2 s at 1.5 A, until the evaporation of the carbon source. In group 4, according to availability at our microscopy center, the surfaces were silver coated with a Baltec® MCS 010 sputter coater, for 80 s at 40 mA. In group 5, a non-aqueous wet developer Metal-Chek® D 70 was applied by aerosol spraying. The package contains approximately 9% of calcium carbonate, solvent (isopropanol and acetone), and propellant gas (propane and butane). In group 6, talcum powder (Johnson’s Baby®) was applied on the samples by manual spray. In group 7, the sample surfaces were not coated, and therefore, this group was called the control group. Table 1 shows the seven groups.
Coating materials and their respective application processes.

According to the manufacturer of the Balzers® SCD 050 sputter coater, the layers were approximately 20 nm. To evaluate the developer, a spray jet was applied on a glass surface. After the solvent evaporation, the resulting particles were collected. For the two materials applied manually (talc and developer), the particle size analysis was made using a Cilas® Particle Size Analyzer 1180. The average particle size diameters were 25.45 and 4.84 µm, respectively, with distribution according to Figure 2.

Particle-size distribution: talc and developer.
Samples were scanned before and after the coating process using Tecnodrill® Digimill 3D device. This scanner operates with a conoscopic holography sensor Optimet® Conoprobe 1000, which emits a red laser with 655 nm wavelength. To obtain the data from a view, a single dot is projected in order to measure the Z coordinate (accuracy according to the selected lens) while the CNC machine axes scan the XY directions with positioning accuracy of 0.001 mm. Each sample was scanned three times to collect surface data: one was taken from the top view and two at a 30° angle from the base. Both tilts were performed to reach the sides of slots. The top view digitization was performed with a 25 mm lens, with accuracy of 0.003 mm in the Z direction and resolution of 0.02 mm in the XY directions. Because of the read range, the tilted digitization had to be performed with a 50 mm lens, with accuracy of 0.006 mm in the Z direction and resolution of 0.05 mm in the XY directions. All samples were measured from top view and then the lens were changed, and all samples were measured from other views. After completing the 3D scans, two analyses were carried out to evaluate the coating type with the lowest thickness or the smallest dimensional variation: one with the point clouds of the top views and another using all point clouds and converting them into 3D meshes. The point cloud data were processed by Geomagic® Studio software.
In the first analysis, all the geometric features (widths of the steps and radii) of the 48 pieces were measured before and after the coating process, using only point clouds. The second measure was subtracted from the first one to obtain the coating layer thickness on the straight and curved surfaces. Each sample with and without coating was measured eight times in order to evaluate the variability introduced by the manufacturing of the samples, the scanner, and the coating. The analysis of variance (ANOVA) Gage R&R method was used to estimate the variance of each source: the equipment variation (the CNC machine and the scanner) and the coating variation. In addition, a control group of eight pieces without coating was scanned to verify the intrinsic accuracy of the scanning process. The one-way ANOVA method was used to examine the differences between the groups, based on one factor (the groups) and the dependent variables (the difference between the step widths and the difference between the radii). The Tukey’s test was used to compare the significant difference between each pair of means. The confidence interval was 95%.
In the second analysis, all the point clouds were aligned, processed, and converted into triangle meshes. The 48 meshes of the sample surfaces scanned before the coating process were compared with their respective 48 meshes obtained after the coating process using the Geomagic® Qualify software. Each mesh coated sample was positioned over its corresponding mesh (with no coating) using the algorithm “Best Fit,” which is a nonspecific alignment that globally minimizes the distance (based on mean squares) of every measured point to its reference. Thus, the geometric differences caused by the application of six different coating materials were quantified in this study.
Results and discussion
For the first analysis (with one single point cloud), the results for the sources of measurement variation showed that the used equipment is responsible for 17.2% of the total variance (0.0011) while the coating is responsible for 82.8%. In this analysis with the point clouds of the top view, it was observed that there was a significant difference between the groups with different coating materials. Group 5 (developer) presented greatest deviations among the coatings evaluated. Groups 4 and 6 (silver and talc) presented random results, with greater standard deviation. There were no statistically significant differences between groups 1, 2, 3, and 7 (gold, platinum, carbon, and control group), which presented smaller dimensional differences. All results for the step widths and for the radii were similar. For this reason, Figure 3 presents the calculated means and their respective standard deviation bars only of the radii measurement. It should be noted that the values are sometimes lower than zero because of the subtraction of the standard deviation and mean values.
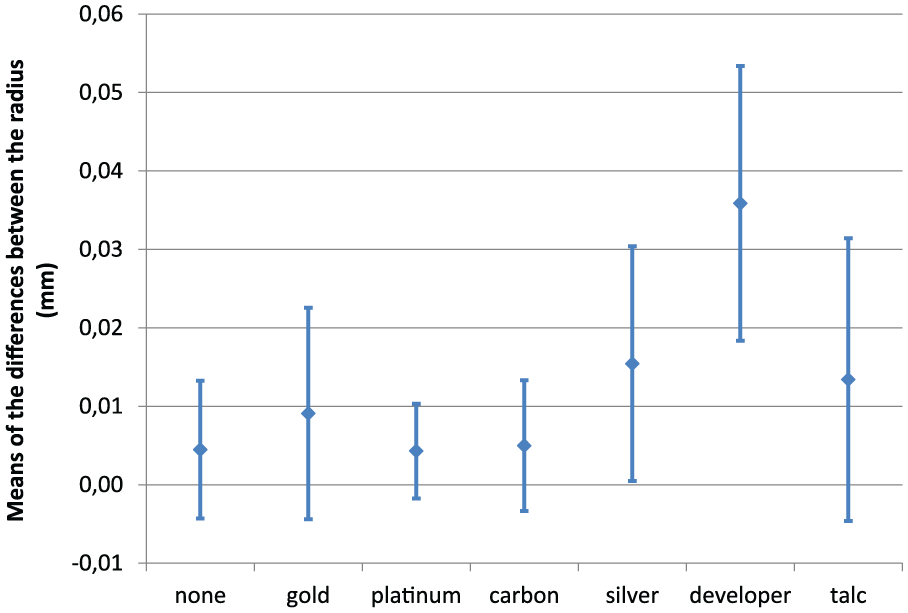
Means of the differences between the radii before and after coating.
The coatings applied via sputtering generated layers with nanometer-sized thicknesses, and the results obtained were almost similar to those of the control group. In this specific case, the centesimal geometric differences were due to the accuracy of the 3D scanner. For silver, there was probably a greater influence of the surface reflection. The talc and developer generated micrometric layers due to their larger size. Although the particle size of the developer was smaller than that of the talc, its application has resulted in a higher dimensional error. This can be attributed to the coating application method: manual or aerosol. The aerosol pressure implies a thicker layer, which caused this group to present higher significant difference compared with the other groups.
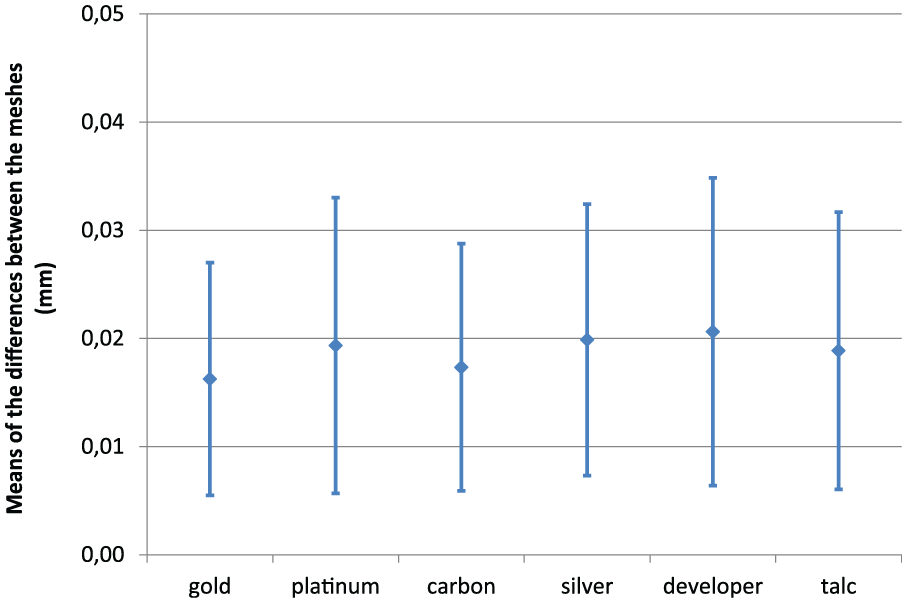
Means of the differences between the meshes before and after coating.
In the analyses carried out with the point cloud processing and the mesh generation, no significant differences were observed between the groups. The averages of the dimensional differences were concentrated between 0.016 and 0.021 mm with standard deviations between 0.011 and 0.014 mm, as shown in Figure 4. The result of this analysis was attributed to a sum of errors, which included the registration of three point clouds, two of them acquired with a lower precision lens, and to the interpolation process for the generation of mesh. Thus, this second method proved to be unsuitable for this case because the process errors were larger than the errors introduced by the coating. On the contrary, it can be inferred that the errors caused by the coatings studied can be disregarded in the analyses that do not require accuracy higher than 0.03 mm.
Qualitatively, there was a visible difference in the texture of the surface samples with the developer application, regardless of the dimensional error measured. This texture can be attributed to the particle size and the method of coating application.17,18 Figure 5 shows the best result obtained by a sample in the platinum group and the worst value in the developer group. For the geometric deviation, the values that were greater than the mean had a positive deviation while values less than the mean had a negative deviation. It should be noted that the negative deviations were not expected and can be attributed to the method and process errors. The images presented in green indicate areas of higher precision and in red or in blue were the regions with higher dimensional error. Therefore, a difference was observed in the homogeneity of the model surfaces, as revealed in the texture generated by the developer spray.

A 3D analysis: sample with platinum and sample with developer.
Conclusion
The analysis of dimensional accuracy should be made with a single point cloud, since the registration of several clouds could lead to significant errors. Therefore, gold, platinum, or carbon coating is recommended for measurements with tolerances of up to 0.01 mm. These coatings offer significantly higher accuracy compared with the traditionally used developer. The sputtered coatings can be easily removed from most surfaces using cloths, brushes, or even washing the part. In some cases, as highly porous materials, the use of ultrasonic cleaner or chemicals techniques may be required. Thus, our study suggests the use of sputter coating, which includes gold, platinum, or carbon, as a solution for accurate 3D scanning of specular and translucent surfaces.
For the geometric dimensional analysis of parts that require the use of multiple point clouds and mesh generation, the intrinsic errors of the 3D scanning process may be more important than the errors introduced by the selected coating. In this study, all coatings analyzed may be applied in cases that require accuracy up to 0.03 mm. However, it is worth mentioning that when those coatings are applied manually, perceptible changes may occur in the surface texture.
Footnotes
Acknowledgements
We gratefully acknowledge the support provided by Coordenação de Aperfeiçoamento de Pessoal de Nível Superior (CAPES), Conselho Nacional de Desenvolvimento Científico e Tecnológico (CNPq), and Instituto Federal de Educação, Ciência e Tecnologia do Rio Grande do Sul (IFRS).
Handling Editor: Ismet Baran
Declaration of conflicting interests
The author(s) declared no potential conflicts of interest with respect to the research, authorship, and/or publication of this article.
Funding
The author(s) received no financial support for the research, authorship, and/or publication of this article.