
Abstract
It is difficult to have enough samples to implement the full-scale life test on the loader drive axle due to high cost. But the extreme small sample size can hardly meet the statistical requirements of the traditional reliability analysis methods. In this work, the method of combining virtual sample expanding with Bootstrap is proposed to evaluate the fatigue reliability of the loader drive axle with extreme small sample. First, the sample size is expanded by virtual augmentation method to meet the requirement of Bootstrap method. Then, a modified Bootstrap method is used to evaluate the fatigue reliability of the expanded sample. Finally, the feasibility and reliability of the method are verified by comparing the results with the semi-empirical estimation method. Moreover, from the practical perspective, the promising result from this study indicates that the proposed method is more efficient than the semi-empirical method. The proposed method provides a new way for the reliability evaluation of costly and complex structures.
Introduction
The drive axle of the loader is located at the end of the power-transmission system to increase torque and transmit power to the drive wheel to produce traction force. Because of its harsh complicated high load working condition, variable operation mediums, and long-serving period, the drive axle of the loader undertakes frequent alternating load, which leads to the complex failure mode and mechanism. In the face of increased engineering requirements, such as extending the mission life duration of the loader, ensuring the performance and reliability of components such as the drive axle has become increasingly important.
In recent years, lots of researches have been conducted on the structural reliability analysis. According to the implemented uncertainty modeling techniques, the reliability analysis methods can be classified into three types: traditional reliability analysis, non-probability-based reliability analysis, and hybrid reliability analysis. 1 Traditional reliability analysis is developed based on the theories of probability and statistics. It includes various sampling-based simulation methods, such as Importance Sampling (IS),2,3 Line Sampling (LS),4,5directional sampling, 6 Subset Simulation (SubSim),7–9 and Weighted Average Simulation Method (WASM); 10 surrogate model based approximation approach such as response surface approach; 11 and moment methods. 12 For non-probability-based reliability analysis, all uncertain parameters are modeled by non-stochastic techniques.13,14 In addition, the hybrid reliability analysis combines the probability and non-probability based structural reliability analyses into a unified computational scheme.15,16 However, these methods require a large enough sample size to replicate “piece to piece variation” and ensure the accuracy of inference.17,18 For the large-scale complicated structure like loader drive axle, because of the high cost on the full-scale reliability tests, it can be very challenging to have enough samples to meet the statistical requirements of these purposed statistical methods. Therefore, the reliability estimation for the small sample or the extreme small sample has become a recognized technical problem.
For the sake of addressing this issue, various small sample theories have been proposed recently, such as Bootstrap method, Bayesian inference method, and support vector machine (SVM) method. Picheny et al. 19 presented the use of the Bootstrap method to safely estimate the reliability with the objective of obtaining a conservative but not overly conservative estimate. Li et al. 20 proposed a Bootstrap method for characterizing the uncertainty in probabilistic models and its effect on geotechnical reliability. The results indicated that the Bootstrap method can effectively characterize the uncertainty in probabilistic models derived from a small sample. M Akama 21 performed Bayesian analysis to estimate an appropriate value of the uncertain propagation rate of cracks that can be initiated at the wheelseat of a Shinkansen vehicle axle. Mahadevan et al. 22 proposed a methodology to apply Bayesian networks to structural system reliability reassessment and compared it with traditional reliability analysis methods. Liang et al. 23 proposed a dynamic Bayesian network and numerical simulation for warship reliability evaluation. Li et al. 24 and Atin et al. 25 established some SVM-based reliability analysis approaches in order to estimate the reliability of implicit performance function often encountered in structural safety assessment.
The basic idea of Bootstrap method is to estimate the sampling distribution of an estimator by sampling with replacement from the original sample. However, the disadvantage is that it can be utilized to solve the relatively small sample (
In this article, the method of combining virtual-augmented sample with Bootstrap is proposed to evaluate the fatigue reliability of the loader drive axle with extreme small sample. First, Kolmogorov–Smirnov model is used to the test data to determine the fatigue life distribution of drive axle. Then, the test life data of the drive axle are expanded by virtual augmentation method based on the small sample of fatigue test. The sample size is increased from n = 3 to n = 14. Then, the reliability of the expanded sample is evaluated by Bootstrap method. Finally, the feasibility and reliability of the method are verified by comparing the results with the semi-empirical estimation method. The proposed method provides a new way for the reliability evaluation of costly and complex structures.
Fatigue test of the loader drive axle
In this study, full-scale fatigue tests are carried out on three 5T loader front drive axle samples. The test sample is shown in Figure 1. The drive axle consists of main reducer, differential mechanism, half shaft, wheel reducer, and axle housing. Two-stage decelerating structure is adopted for the drive axle. Spiral bevel gears with great load-carrying capacity and high efficiency are adopted for main drive. The wheel is a planetary decelerating structure. The main reducer is equipped with the common bevel-gear differential mechanism with simple structure and flexible differential function.

A 5T loader drive axle test sample.
In order to get the typical load spectrum of the drive axle, the actual torque history of the front shaft is recorded in the operation process. The torque could be positive or negative since the loader could be moving forward or backward. The 8-grade load spectrum is obtained by classifying all the positive torque signals into forward-rotating loading test and all the negative torque signals into reverse-rotating loading test. It includes 5-grade forward-rotating load spectrum and 3-grade reversal load spectrum because the ratio of the positive to negative torque time of the drive shaft is nearly 5/3. The load spectrum of the intensified fatigue test is given in Table 1. 31
Test loading spectrum of the drive axle.

The layout of fatigue test bench is shown in Figure 2. The fatigue test bench consists of input motor (200 kW, the maximum output torque is 636 N m), adaptive loading motor (315 kW, the maximum output torque is 2000 N m), drive axle testing sample and its fixture, torque and speed sensors, lubricating oil thermometer, and control system. The three motors adopted are German Oswald. The characteristics of stepless speed-adjusting of the 200 kW motor at the range of 0–3600 r/min and the high transmission ratio transmission box can guarantee the input characteristics requirement of the test. Moreover, the 315 kW motor has stepless speed-adjusting characteristic at the range of 0–1500 r/min. There are one 6-speed gearbox and two high transmission ratio transmission boxes to match the output characteristic of the drive axle. Therefore, the output loading requirements of the drive axle can be guaranteed. It is required to fill the drive axle with enough lubricating oil before the test. The test fixture is employed to ensure the coaxiality between the axle of the input shaft and the motor shaft. The control system is developed to continuously record the torque, speed of the input and output axles, and the load cycles number. Moreover, the torque error should be controlled less than 5% and the speed error should be controlled less than 10% during a 20 h continuous operation.

Layout of the drive axle fatigue test bench.
The positive and reverse loading fatigue test is carried out on the test bench according to the load spectrum in Table 1, and the cyclic load is arranged as “low-high-low” loop. This cycle is repeated till the flaw is represented, and then, the cyclic loading number of the load spectrum is counted. A relatively stable temperature interval of the lubricating oil between 60°C and 90°C should be assured during the test by continuous tracking. The vibration and noise should also be monitored at the same time. The test should be terminated immediately when the following conditions occur in the test process: (1) the load or frequency drops by 5%–10% or the load changes abruptly, (2) abnormal noise caused by gear tooth fracture, and (3) abnormal noise from bearing and spline. 31
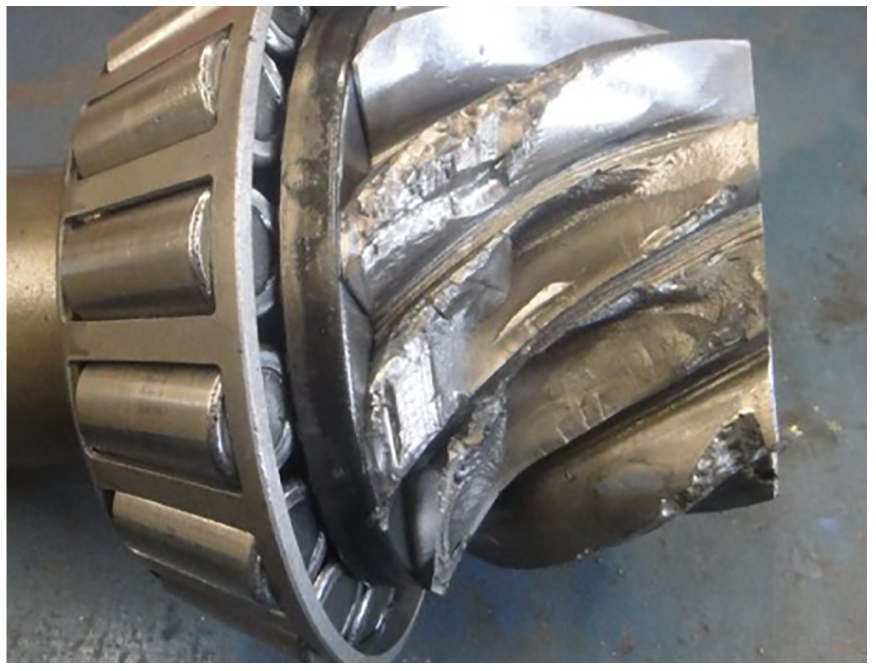
The fatigue test is conducted on three loader drive axle samples. After the test, the drive axle is disassembled to observe the failure. It is found that for all three samples, the damage occurs in the spiral bevel gear of the main reducer, both the pinion and the bull spiral bevel gear are broken, as illustrated in Figures 3 and 4. It can be seen from Figure 3 that varying surface tension in the underlying layer can lead to surface fatigue and result in chipping for the material. Figure 4 shows that the fatigue source is at the root of the tooth where tension concentration occurs, the crack propagates inward, and finally the tooth breaks. There is no tooth breaking in wheel-side reducer gear, but pitting corrosion on the teeth surface, as shown in Figure 5. This indicates that the failure of the driving axle occurs mainly in the spiral bevel gear of the main reducer, and the failure mode is bending fatigue for spiral bevel gear and contact fatigue for wheel-side reducer planetary gear. The test results are listed in Table 2. As shown in Table 2, the drive axle marked as 07/01170302-1 failed at 16.2 load spectrum cycle, which is equivalent to 39,476.16 h. Also, the equivalent fatigue life for 07/01170302-2 and 07/01170302-3 are 43,375.04 h and 41,181.92 h, respectively.
Fracture of the pinion for the main reducer.

Fracture of the bull spiral bevel gear for the main reducer.

Pitting corrosion in the wheel-side reducer gear.
Test results and equivalent fatigue life of the drive axle.

Virtual sample expanding & Bootstrap method
Virtually expanded small sample
Since Bootstrap method is suitable to small sample test evaluation in which sample size is more than 10, but for the extreme small sample case in which the sample size is less than 3, Bootstrap method could not be used directly. In this article, virtual augmentation sample method is adopted to expand extreme small sample to meet the requirement of Bootstrap method.
Sample from fatigue test is
where T is the expanded value,
The theoretical foundation of virtual sample expansion is that the mean and the standard deviation of the expanded samples should be the same as the original sample. So we have


Therefore, by virtual sample expanding, original sample
Bootstrap method
Original Bootstrap method
Bootstrap method is a simple, powerful, and suitable method to estimate uncertainty of confidence interval of statistical quantities in the evaluation of the distribution analysis with the following features: 33
Nonparametric: there is no necessity to assume any mathematical expression or model to represent the distribution.
Flexibility: it suits to evaluate not only the mean value or median of a distribution, but also any type of statistical quantities of interest, for example, any percentile or standard deviation can be evaluated for confidence interval.
Simplicity: the algorithm is relatively simple.
The basic idea of the Bootstrap method is to use the empirical distribution function to present the unknown distribution function. N samples are selected from the empirical distribution function randomly to estimate the sample distributions of statistics, which is equivalent to the resampling of the original samples. 34
Assuming that
The basic steps of calculating the distribution characteristics are summarized as follows:
Step 1. Construct the empirical distribution function
The computer-based simulation process generated random samples from empirical cumulative distribution function as follows: Generate uniform random numbers
Step 2. A sample of
Step 3. The corresponding Bootstrap statistic of estimation error

where
Step 4. Repeat Steps 2 and 3 N times, and get N possible values of Bootstrap statistics.
Step 5. The distribution of
Modified Bootstrap method
It should be mentioned that the random samples generated by original Bootstrap method are relatively concentrated in the interval
For the top

where
Moreover, a new sample
Finally, sort the augmented sample
The computer-based simulation process generated random samples from empirical cumulative distribution function are as follows:
Generate uniform random numbers
If
Otherwise,
Figure 6 illustrates the basic scheme of virtual augmentation sample and Bootstrap method for reliability estimation under small sample.

Procedure of the virtual augmentation sample and Bootstrap method.
Reliability analysis of 5T loader drive axle
The 5T loader described in this article is one of the most important loader types that is widely used in the areas of transportation, agriculture, construction, and so on. The fatigue test results of 5T loader drive axle are listed in Table 2. Since the sample size is only 3, which is far from the statistical requirement of traditional reliability assessment methods, it is difficult for conventional methods to deal with the reliability analysis of it. This article proposes a virtual augmented sample and Bootstrap method as shown above. Then the detailed analysis on the reliability analysis of 5T loader drive axle is conducted.
Life distribution model of the loader drive axle
From the test, we know that the fatigue lifetime experimental data for the three loader drive axles are
When it comes to the fatigue life distribution, none of the commonly used distributions (exponential, lognormal, normal, or Weibull) is capable of correctly modeling all the shapes encountered in fatigue lifetime experimental data. It means that there is no universally admitted distribution family for the modeling of fatigue lifetime. As a result, the distribution selection is usually depending on the modeling background of the researcher or the ability of the considered distribution that correctly fits the shape of the data under study. 35 In this study, Kolmogorov–Smirnov distribution hypothesis testing method is chosen to determine the life distribution. First, we assume that the sample obeys certain distribution, then calculates the Kolmogorov–Smirnov parameters of the sample, and determines whether the theoretical hypothesis is acceptable based on that. If the statistical hypothesis is acceptable, the distribution of the actual sample should be the same as the theoretical hypothesis; otherwise, it should be considered that the prior statistical hypothesis has a significant contradiction with the actual situation, and the prior statistical hypothesis should be rejected.
The Kolmogorov–Smirnov distribution hypothesis testing method includes four parameters, which are h, p, ksstat, and cv. Among them, h means acceptance of the hypothesis, h = 0 indicates the hypothesis is acceptable, that is, data disobey the distribution; while h = 1 indicates the hypothesis is rejectable, that is, data disobey the distribution. p represents the probability of obeying the distribution, ksstat represents the value of the test statistics, and cv indicates whether the critical value of the original hypothesis is rejected, and it accepts the original hypothesis when ksstat < cv. 36
The Kolmogorov–Smirnov model is applied to the sample data, and its fitting degrees with four different life distribution types (exponential, lognormal, normal, and Weibull distribution) are calculated. The results are shown in Table 3.
Hypothesis testing parameters for different life distribution.

It can be seen from Table 3 that the four hypotheses of the life data are all acceptable. Among them, the most possible alternative is logarithmic normal distribution since it has the largest p. Therefore, it is assumed that the fatigue life of the drive axle obeys lognormal distribution in this article.
Sample expansion
Random variable Y is defined by
In this article,

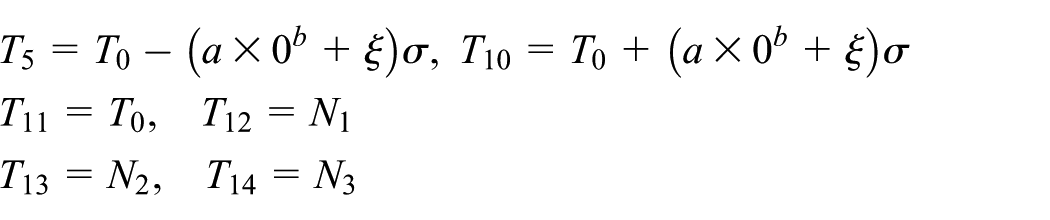
The standard deviation of the virtual augmented sample
Submitting
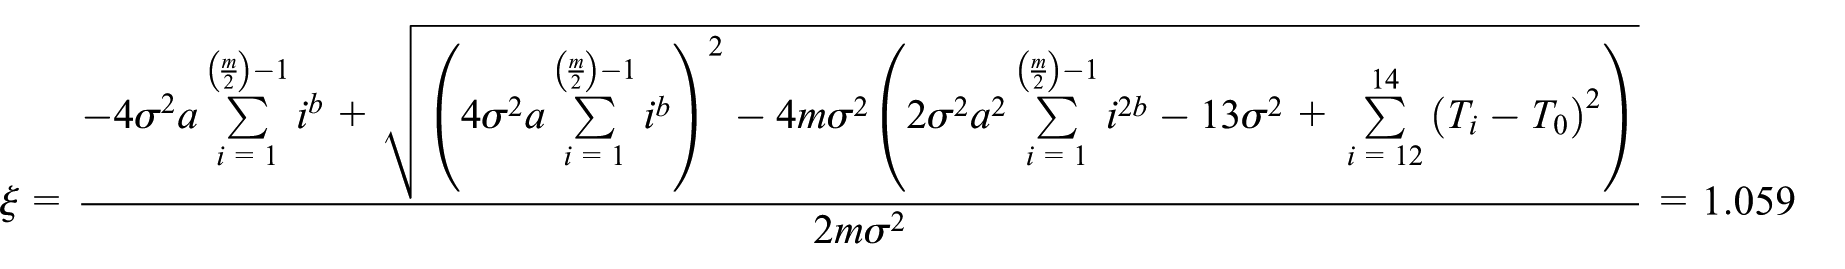
So the 14 expanded samples are
Reliability analysis
Then the modified empirical cumulative distribution function is established based on the above data, and random sampling has been done 1000, 10,000, 100,000 times, respectively, in this article. Figures 7–9 show the distribution of the parameter mean

Mean and standard deviation histograms of 1000 sampling.
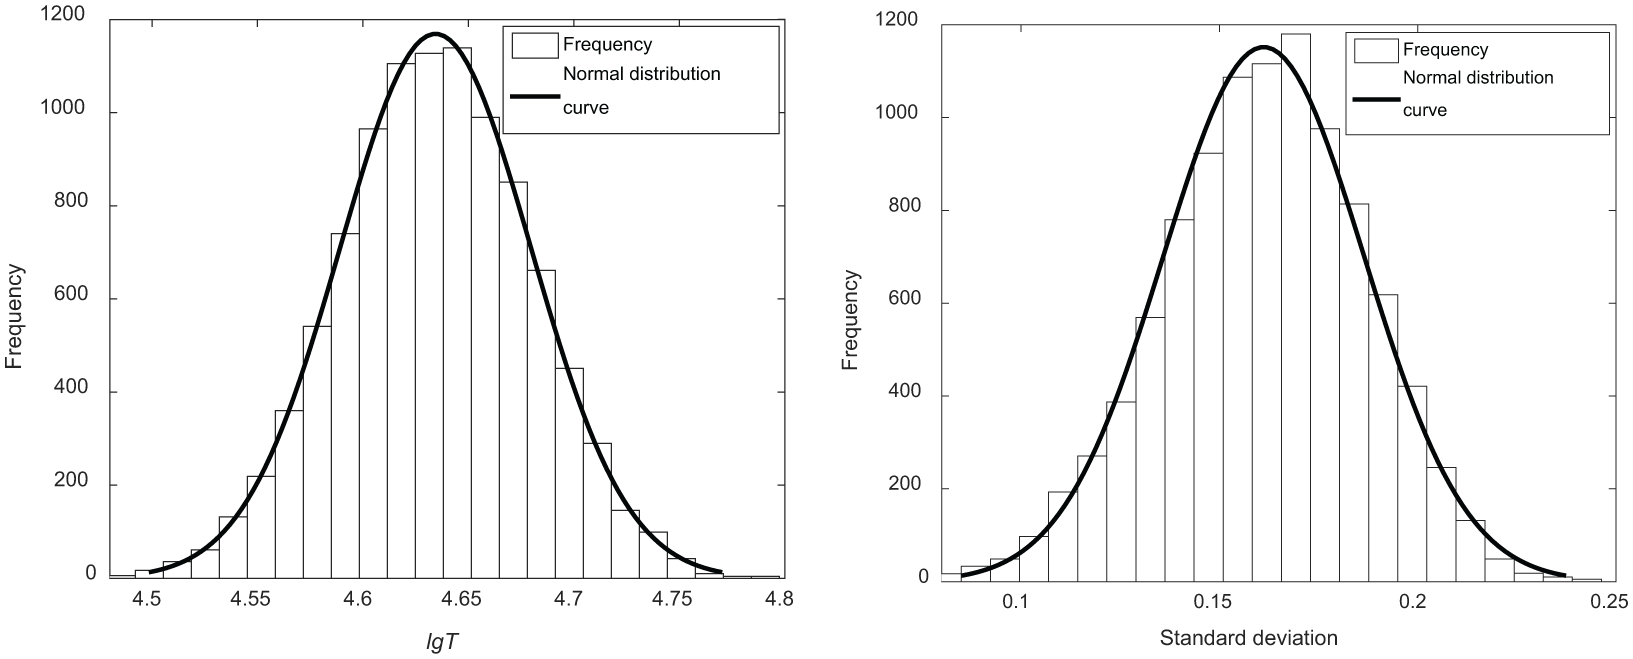
Mean and standard deviation histograms of 10,000 sampling.

Mean and standard deviation histograms of 100,000 sampling.
It can be seen from Figures 7–9 that the mean
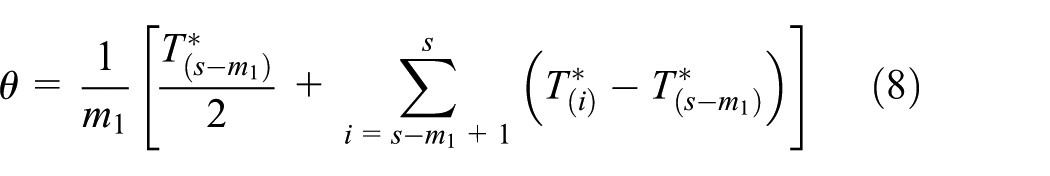
Then, the confidence interval of fatigue life of loader drive axle can be calculated

where
Confidence intervals of fatigue life at different confidence level.

From Table 4, we know that at 90% confidence level, the confidence interval of the fatigue life of the drive axle of the loader is [37,445.5 h, 48,595.9 h].
The reliability index of the drive axle can be obtained by substituting the lower confidence limit of mean value
The reliability index of the drive axle is

The reliability function of the drive axle is
The average life span of the drive axle is

The results show that the average life span of drive axle is more than 40,000 h, which can satisfy the engineering demand.
The reliability function curve of loader drive axle at 90% confidence level can be drawn by formula (10), as shown in Figure 10. It can be seen from Figure 10 that the reliability of the drive axle decreases with increasing working hours. When the working time is less than 18,000 h, the reliability is almost 100%; the reliability decreases sharply during 20,000–50,000 h working time. The fatigue life for different reliability, at 90% confidence level, is shown in Table 5.
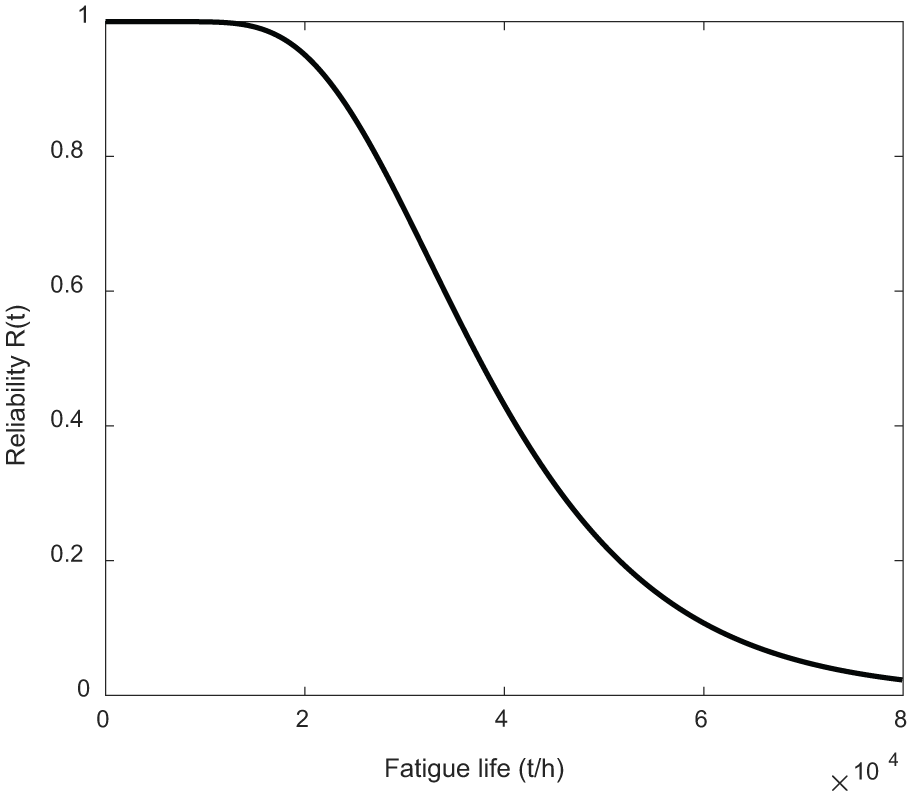
Reliability function curve of loader drive axle at 90% confidence level.
Drive axle fatigue life for different reliability (h).

Verification
For comparison, the semi-empirical method 37 is also applied to the same experimental data. The normal distribution variables are converted into standard normal distribution random transformation Z, that is

When confidence level

Then the confidence interval of fatigue life of loader drive axle can be calculated as

In this article,
Conclusion
In this article, the reliability of the drive axle is analyzed by the combination of the virtual sample expanding and the Bootstrap method. First, the Kolmogorov–Smirnov model is applied to the sample data to determine the fatigue life distribution. On this basis, the extreme small sample is augmented by virtual expanded sample method. A modified Bootstrap method is then used to evaluate the fatigue reliability of the expanded sample. In addition, an illustrative example is presented to demonstrate the application of the proposed method. The main conclusions are as follows:
In the case of the large-scale complicated structure, only small sample full-scale fatigue tests can be carried out for performance evaluation due to relatively resource constraints. Virtual sample expanding and Bootstrap sampling method provides a practical way to sufficiently expand the dataset. The corresponding results show that the augmented samples generated by the proposed method are acceptable and have a reasonable distribution in this study.
The reliability assessment and life prediction of the loader drive axle are conducted, and the result of which vivificates the reasonability and feasibility of the proposed method. Moreover, from the practical perspective, the promising result from this study indicates that the proposed method is more efficient than the semi-empirical method.
The proposed virtual augmented sample and Bootstrap method could provide an alternative way for the reliability evaluation of high-cost large-scale complicated structure, and the scope of solutions for typical application problems of extreme small sample case is thereby expanded.
Footnotes
Appendix 1
Acknowledgements
The authors wish to thank Professor Xuding Song, who gave the author very helpful suggestions.
Handling Editor: José Correia
Declaration of conflicting interests
The author(s) declared no potential conflicts of interest with respect to the research, authorship, and/or publication of this article.
Funding
The author(s) disclosed receipt of the following financial support for the research, authorship, and/or publication of this article: This work is supported by Provincial Natural Science Foundation of Shaanxi (Grant No.2018JM5108), National Sci-Tech Support Plan of China (Grant No.2015BAF07B02), National Natural Science Foundation of China (No.116 72048) and Fundamental Research Funds for the Central Universities (No. 300102258102).