
Abstract
The main purpose of this article is to compare the mode choice decisions between commuting and non-commuting trip chains and evaluate the uncertainties in the mode choice process. According to household survey data from a medium-sized city in China, the whole day of travel is divided into several types of travel chains. We used the multinomial logit model to estimate the impacts of factors on the choices of trip modes, which included walk, bike, public transit, and car. The entropy theory was introduced to evaluate the uncertainty of each traveler’s mode choice decision. The results indicate that there are great differences in mode choice between commuting and non-commuting trip chains. It is found that the causes and effects of different chains are different. The results help to understand the decision-making process of mode.
Introduction
Analysis of mode choice decision could help understand how factors affect travelers’ choices of trip modes in their travel activities. Factors contributing to this situation generally include the socio-demographic characteristics of individuals and families, the natural environment, and travel-related characteristics. Previously, many studies have developed mode choice models to evaluate the effect of contributing factors and estimate the demands of trip modes.1–8 In most of these studies, the mode choices were analyzed for particular purpose of trips such as commuting trips or recreational trips. Some other studies focused on all trip purposes without distinguishing commuting and non-commuting trips.
Actually, the mode choice decisions may be different between different purposes of trip. In commuting trips, the primary consideration of choosing trip mode is to make sure the travelers get their destinations rapidly and reliably. In recreational trips, the comfort or convenience may be the primary consideration. Thus, it is necessary to analyze the mode choice process separately for commuting and non-commuting activities. Besides, most of the previous studies investigated the mode choice behaviors in a single trip. In fact, travelers often plan their daily travel activities for multiple purposes or destinations at the same time. Features of multiple trips a day, which was descripted as trip chain, and it could have an impact on the decision making for pattern selection.9–13
The relationship between mode choice and trip chain pattern has attracted researchers’ interest.14–17 Previous studies thought that the pattern of trip chains affected the mode choice decisions, such as a recent study by Li et al. 17 shown that there was more bicycle use in commuting trips than non-commuting trips. 16 However, these studies did not examine and compare the mode choices between commuting and non-commuting trips. A factor may have an impact on the choice of trip mode in a particular chain but may have different impacts in other chains. As a consequence, it is desirable to distinguish the trip chain pattern when analyzing travelers’ mode choice decisions.
Multinomial logit (MNL) model is the most common method for mode choice studies. In an MNL model, a choice prediction can be made to the trip mode with the highest probability among all choice alternatives. However, the choice prediction in an MNL model does not provide the uncertainty information in the decision-making process, or in other words, the difficulty of the choice making. The uncertainty provides information about the decision-making process in addition to the outcome of the decision. A low uncertainty means a trip mode is obviously better than the others and the choice is quite easy to make, and a high uncertainty means a trip mode is not obviously better than the others and the traveler may choose to use other trip modes easily, even though the choice outcomes are the same in the two situations. Therefore, assessing the uncertainty in the mode choice process can help identify whether the traveler is a committed mode user or a potential mode switcher.
The primary objective of this article is to assess the decisions and uncertainties in the mode choices between commuting and non-commuting trip chains. More specifically, this study executes the following tasks: (1) to identify if the contributing factors and their impacts on choices of trip modes are different between different trip chains, and (2) to investigate if the uncertainty is different between trip modes in commuting and non-commuting trip chains. The MNL modeling technique and the entropy theory were used to achieve the study purposes. In the following section, we briefly introduce the data resource. The “Methods” section introduces the methodologies used for analysis. The “Modeling results” section shows the modeling results. The “Discussion” section discusses the findings and policy implications. The article ends with brief concluding remarks in the “Conclusion” section.
Data source
The analysis data come from the household survey in Bengbu, China, in year 2007. Bengbu is a typical medium-sized city in eastern China. By the end of year 2007, the population was 914,300 and the area was 601.5 km2. As shown in Figure 1, the urban area has 98 traffic analysis zones (TAZs), which are mainly divided into central group, northern group, and eastern group. The central group has complete facilities and diversified land-use patterns.

Descriptions of trip-chaining pattern and bicycle choice: (a) distribution of TAZ, (b) land patterns in the city area,(c) illustration of central district, and (d) illustration of three main groups.
The resident’s survey was conducted by the local government on a typical weekday to map out the city’s transportation system. The survey consists of two parts: (a) individual characteristics and family characteristics, and (b) all travel information throughout the day. According to the population situation of the TAZs group, 10,000 questionnaires were randomly distributed to them. Questionnaires are issued and collected by neighborhood committees. Initially, 7928 questionnaires were obtained. Further analysis is carried out by excluding samples with the following problems: (1) the lack of key information (such as travel mode or travel purpose), and (2) the case has logic problems in the coding process. Through data selection, a total of 5974 samples were obtained.
In this article, the travel chain was defined as a series of trips that start and end at home throughout the day. According to previous studies, a trip chain can be classified into different types by the complexity of chain (i.e. single chain and complex chain) or the purpose of trip (i.e. commuting chain, non-commuting chain, and composite chain). Chain information is extracted from survey data. To avoid inaccurate estimates, chain types with a small sample size (less than 1%) were excluded from the analysis. Finally, 5632 valid cases with five major types of trip chains were analyzed. The descriptions of trip chains are shown as follows, where “h” denotes home, “w” denotes a commuting activity (work, school, etc.), and “o” refers to a non-commuting activity (maintenance, recreational, etc.):
“hwh”: There is one commuting activity within a day. This type of chain contains only a simple commuting activity stop.
“hwhwh”: There are two commuting activities within a day. The chain contains commuting trips with a mid-trip that returns home. There are no non-commuting activity stops.
“hoh”: There is only one non-commuting activity within a day. This chain contains only a simple non-commuting activity stop.
“hohoh”: There are two non-commuting activities within a day. This chain contains two non-commuting trips with a mid-trip that returns home.
“hw + oh”: There are two types of activities within a day. This trip chain is a combination of commuting chains with at least one non-commuting activity stop.
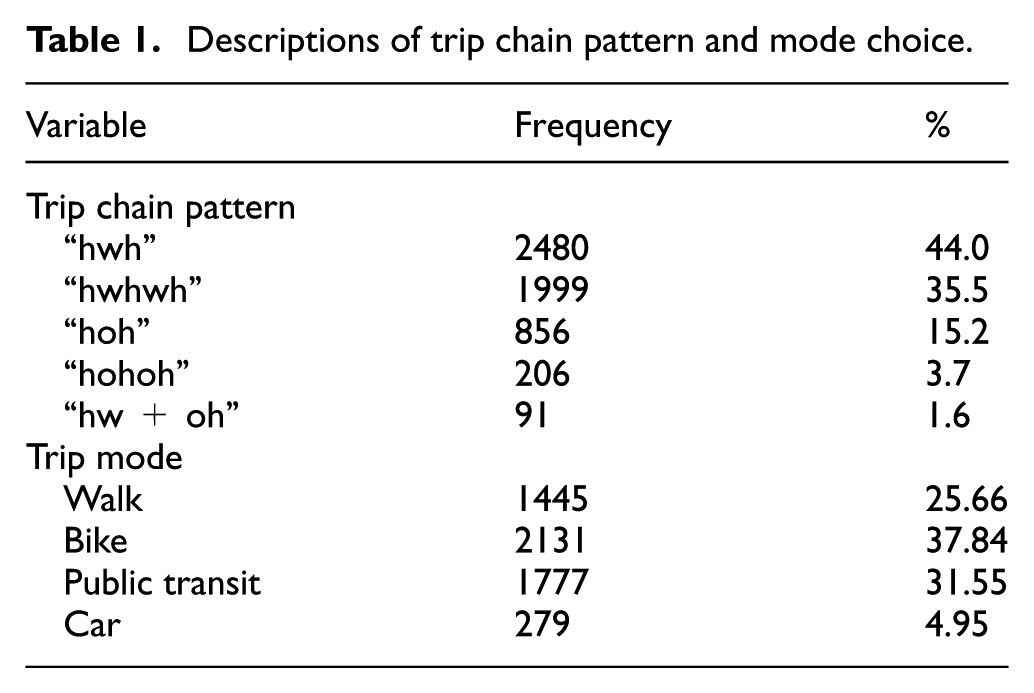
Table 1 reports the number of chains in the sample by type and the percentage of chains per trip mode. The commuting chains (“hwh” and “hwhwh”) are the most common patterns that present 79.5% of all chains. The complex chains (“hwhwh,”“hohoh,” and “hw + oh”) present 40.8% of all chains in our dataset which is comparable to some previous studies.12–14 Tripping mode is considered to be the mode of tripping chain if used in a single chain or the (most commonly used) tripping mode that dominates the complex chain. As shown in Table 1, bicycles are the most commonly used mode of transportation in Bengbu, accounting for 37.83% of the mode of transportation. Public transit is also a major trip mode, which accounts for 31.55% of all trip modes. The percentage of walk is 25.66%. Car is the least used trip model with the percentage of 4.95%.
Descriptions of trip chain pattern and mode choice.
The descriptions of explanatory variables are shown in Table 2. These variables include personal characteristics (such as gender, age), family characteristics (such as family size, family income), and travel information (such as travel time, distance). Land-use pattern and traffic network density of residential location were investigated. In surveys, people often have no concept about the length of their trip. Therefore, in this study, the travel length is calculated as the distance between the start point and the end point TAZs geometric center. The average travel distance of the chain is calculated as the average length of each trip in the chain and is expressed as a dummy variable. These explanatory variables were used to develop the mode choice models in the following sections.
Descriptions of explanatory variables for model development.

Methods
The methodological framework proposed in the study contains two consecutive steps. In the first step, the mode choice models were developed to assess the impacts of contributing factors on the choices of trip modes while the predicted probabilities of mode choice outcomes were calculated. In the second step, the entropy theory was used following the calculation equation to evaluate the uncertainty in the mode choice process. The above analysis was conducted for each individual traveler, and the aggregated results were discussed for giving policy suggestions. The methods used in this section are briefly described in the following paragraphs.
Mode choice model
The literature recommended estimating an MNL model for the mode choice studies. 18 The MNL model is used when the dependent variable is nominal (which means it belongs to any of a group of categories that cannot be sorted in any meaningful manner) and has more than two categories. In this study, the dependent variable in the choice of trip mode includes four categories: 1 = walk, 2 = bike, 3 = public transit, and 4 = car . The MNL model was used in this study to estimate the impacts of factors on the mode choices and predict the probabilities of all choice alternatives.
Assuming that the choice is an alternative based on utility, the expected utility of the alternative is usually a linear combination of attributes, and the parameters are estimated as follows

where
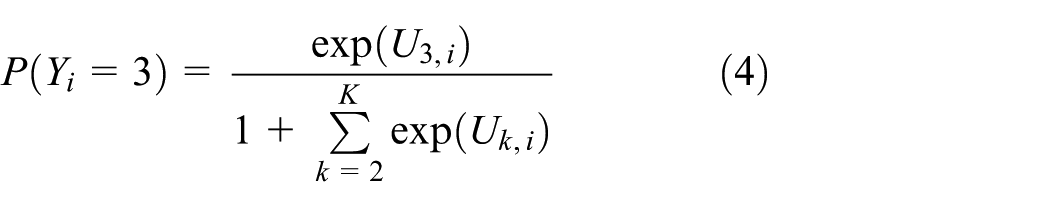
In the MNL modeling framework, the utility can directly be converted to a probability, indicating the probability of individual i choosing trip mode k, given measured attributes of explanatory variables for the individual. Considering the 1 = walk as the reference category, the probability of choosing an alternative can be calculated as


The parameter
Entropy theory
In the MNL model, a prediction about the choice outcome of trip mode can be made, which is often the one with the highest probability according to the estimates of equations (2) to (5). Actually, not only the choice outcomes are useful but also the uncertainty in the mode choice process can provide important information for researchers. A low uncertainty means that the traveler has a strong preference toward the use of a particular trip mode so that the choice is easy to be made. A high uncertainty means the utilities of choice alternatives are comparable and the mode choice decision is quite difficult to make.
Entropy is one of the most commonly used measures of uncertainty in the information theory.20,21 Entropy has also been widely used for measuring the unpredictability of the choice of different outcomes, which is quite consistent with the travel mode choice process in our study topic. More specifically, in the entropy theory, assuming that all the K mode choice outcomes are equally probable, that is, each outcome has a probability p = 1/K, it is clear that the inherent uncertainty of the mode choice process is the largest. In this situation, the maximum entropy is reached. If the probability of one mode choice outcome is 1, while the others are 0, the entropy in this situation is also 0, which indicates that there is no uncertainty in the choice process of travel modes.16,17 Thus, following this rule, we applied the entropy theory to measure the uncertainty and predictability of the mode choice process.
The uncertainty per outcome is expressed in terms of the probability

where P is the probability of choice outcome, and b is the base of the logarithm used. Common value of b is 2 and the unit of entropy is bit for b = 2.
For the mode choice decisions of K = 4 outcomes with probabilities P(Y = 1), P(Y = 2), P(Y = 3), and P(Y = 4), the entropy of the probabilistic process is defined by

The entropy calculated from equation (7) reflects the total uncertainty in the choice decisions. In recent years, the entropy theory has been used by several researchers for the travel behavior analysis. For example, Krygsman et al. 16 and Li et al. 17 used the entropy theory to explore the order of decisions between the choices of trip chain and trip mode. The entropy was calculated separately for the chain choice process and mode choice process. Assuming the choice with the least uncertainty (minimum entropy) was made first, the order of decision was determined.
In this study, the entropy was used to evaluate the uncertainty in the mode choice decision process. Small entropy means that the target trip mode is chosen easily from all choice alternatives, and vice versa. Consequently, evaluating the uncertainty could help to better understand the decision process of trip mode choices and provide useful information for policy makings. To explore which factors affect the magnitude of uncertainty in the mode choice, a linear regression model was estimated with the following model specification

where αi is the parameter for the ith explanatory variable Xi, and M is the number of explanatory variables. The parameter a can be estimated using the least square method.18,19 A positive parameter means the uncertainty increases as the variable increases, and vice versa.
Modeling results
The mode choices between different trip chain patterns were first analyzed. Then, the MNL models were estimated for commuting and non-commuting chains to explore the contributing factors. The uncertainty was calculated and compared for different trip modes. The factors that affect the entropy were investigated.
Mode choices between trip chains
The mode choices were summarized for different trip chain patterns as shown in Table 3. It is found that the proportion of mode choices is different between different chains. For the commuting chains “hwh” and “hwhwh,” bike is the dominant mode of transport, which accounts for more than 40% of total market. Public transit is also commonly used in the two trip chains. For the non-commuting chains “hoh” and “hohoh,” walk is the dominant mode of transport. The percentage of bikes in these two chains is obviously lower than in the other chains. For the composite chain “hw + oh,” public transit is the trip mode that is the most frequently used. The percentage of cars used in this chain is the highest among all activity patterns.
Comparison of mode choices between trip chains.

Table 3 shows that the uses of trip modes are different between commuting-based trip chains (“hwh,”“hwhwh,” and “hw + oh”) and non-commuting-based trip chains (“hoh” and “hohoh”). A possible reason is that commuting trips often have fixed origin and destination locations and strict time schedules, while non-commuting trips often allow travelers to change travel plans or schedules. The difference of mode choices between single chains and complex chains is not evident. Thus, the mode choices are analyzed separately for the commuting and non-commuting trip chains. The results of the analysis are presented in the following section.
Mode choice models for different trip chains
Two MNL models were estimated separately for the studied trip chains. The model estimates are shown in Tables 4 and 5. From the two tables, it is easy to identify that many individual and household characteristics as well as trip attributes significantly affect travelers’ mode choice decisions. The contributing factors of commuting and non-commuting trip chains are found to be different. Some factors are significant in one chain but are not significant in the other chain.
Modeling results of mode choices for commuting trip chains.
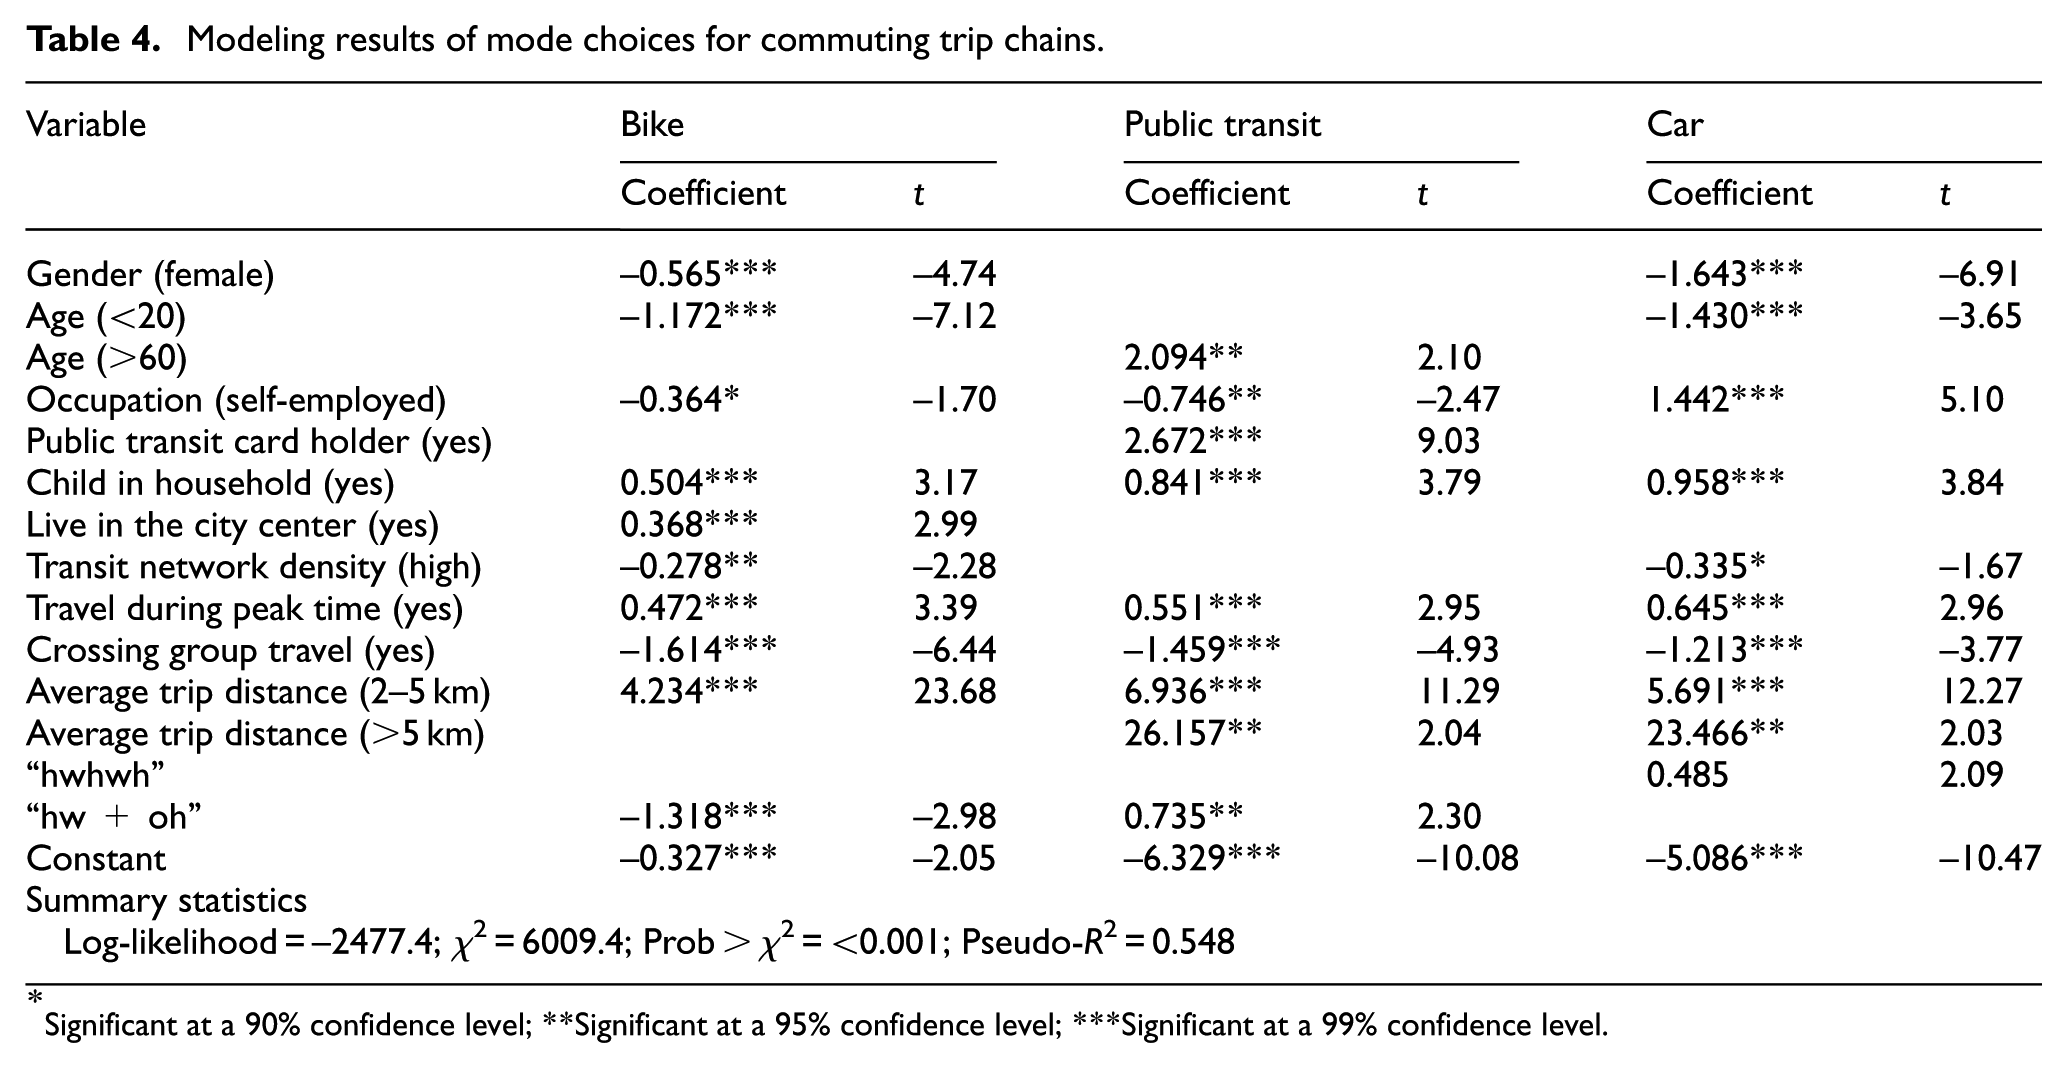
Significant at a 90% confidence level; **Significant at a 95% confidence level; ***Significant at a 99% confidence level.
Modeling results of mode choices for non-commuting trip chains.
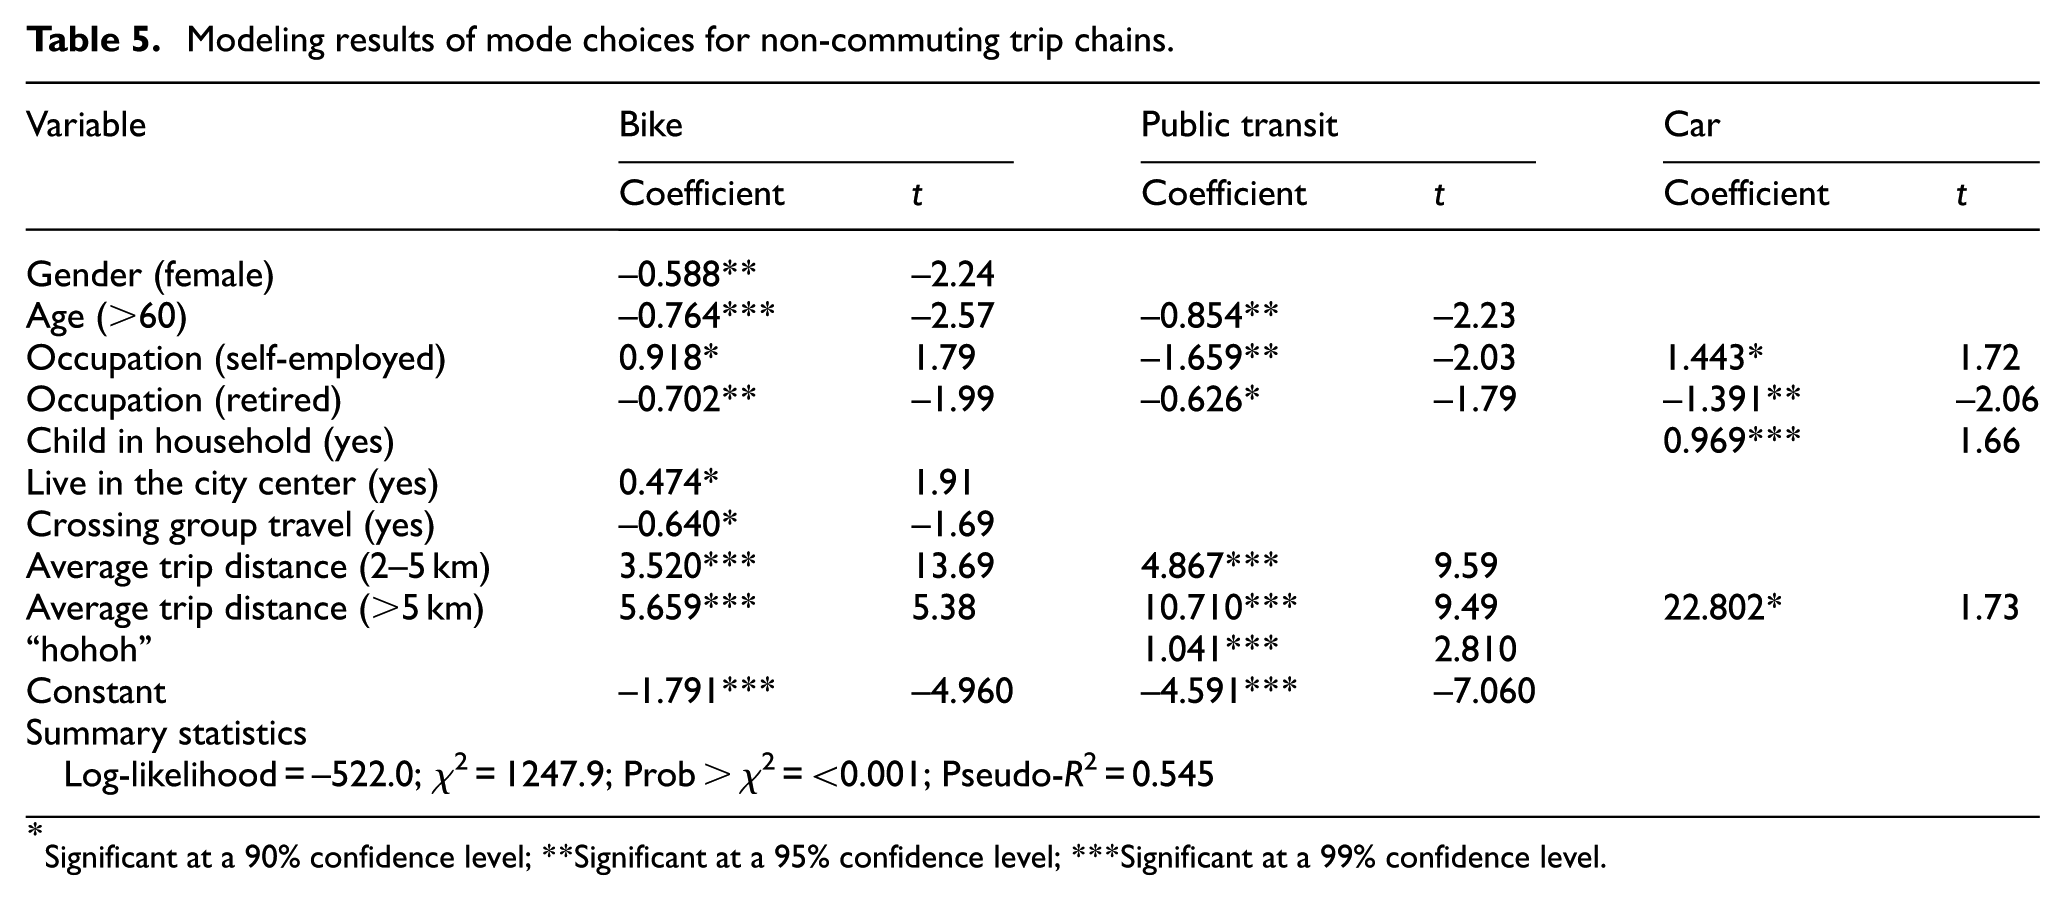
Significant at a 90% confidence level; **Significant at a 95% confidence level; ***Significant at a 99% confidence level.
For commuting trip chains, as it is shown in Table 4, females are less likely to choose a bike or a car for commuting. Young travelers would like to walk to school, while old travelers would like to use a public transit. Self-employed travelers take bike or public transit less but take car more. Holding a public transit card increases the probability of using public transit. Household with children is more likely to choose a bike, public transit, or car for commuting travels as compared to walk. Living in city center increases the probability of using a bike since the coefficient is positive. As compared to walk to work/school, the high transit network density decreases the uses of bike and car, but not significantly increases the use of public transit.
Several trip attribute variables are found to affect traveler’s commuting mode choice decisions. According to the model estimates, less people walk to work/school during peak time. The probabilities of using bike, public transit, and car increase in the peak-hour commuting trips. For short distance trips (less than 2 km) and medium distance trips (from 2 to 5 km), the bicycle, public transit, and car are more commonly used. The probability of using public transit or car is large if the trip distance is longer than 5 km. Compared to the single commuting chain, the chain “hwhwh” increases the use of car, and the chain “hw + oh” decreases the use of bike but increases the use of public transit.
For non-commuting trip chains, as shown in Table 5, females choose to use bike less than males for non-commuting trips. Travelers older than 60 use bike or public transit less since the coefficients are negative. Self-employed travelers ride a bike or driver a car more but take a public transit less than workers/students. Retired people would like to walk in recreation or maintenance trips. Household with children is more likely to use a car for recreation or maintenance trips, probably because that a car can accommodate the whole family in the trips. Living in city center increases the probability of using a bike for non-commuting trips. In general, as the distance in non-commuting trips increases, travelers would like to use a tool (especially motorized trip mode) in the trips other than walk. The public transit is used more in the chain with multiple non-commuting activities. The differences in modeling results between commuting and non-commuting trip chains are discussed in later sections.
Evaluation of uncertainty in mode choice decisions
The uncertainty in the mode choice decision was measured by entropy. The MNL model predicted probabilities of all trip modes. The overall predicting accuracy of the mode choices was 79.6% for commuting trip chains and 81.2% for non-commuting trip chains, which means that the relationships between mode choices and explanatory variables were well captured in the MNL models. The entropy was calculated using equation (7) for each individual traveler. Then, the entropy was summarized for each trip mode separately in the commuting and non-commuting trips. The information of entropy between different trip modes is shown in Figure 2. The distribution of entropy is different between commuting and non-commuting trip chains.

(a) Entropy between trip modes for commuting trip chains and (b) entropy between trip modes for non-commuting trip chains.
For commuting-based trip chains, as shown in Figure 2(a), public transit has the lowest entropy, 0.62. Car has the highest entropy, 1.13. The entropy for walk and bike is nearly equal, 0.83 and 0.84, respectively. The results suggested that in the commuting trips, public transit has obvious advantages and the choice decision for public transit is made easily. The choice decision for car is made less frequently, probably because car has several disadvantages (such as parking, running cost, traffic congestion), so that travelers do not have strong preferences on using it. Compared to public transit and car, the choices of walk and bike have moderate uncertainties.
For non-commuting trip chains, as shown in Figure 2(b), the entropy of walk is the lowest among all trip modes and the entropy of bike is the highest. The entropy of car is similar to that of public transit. The results suggested that in the non-commuting trips, walk has a larger utility than the others. The choice decision for walk is made easily. Bike has some drawbacks such as carrying ability and running speed, so that travelers do not have strong preferences of using it for non-commuting trips. The entropy of car is lower than that in commuting trips, which means that car users have stronger preferences of using it for non-commuting travels. The preference of using public transit for maintenance or entertainment activities is slightly less than that for commuting activities.
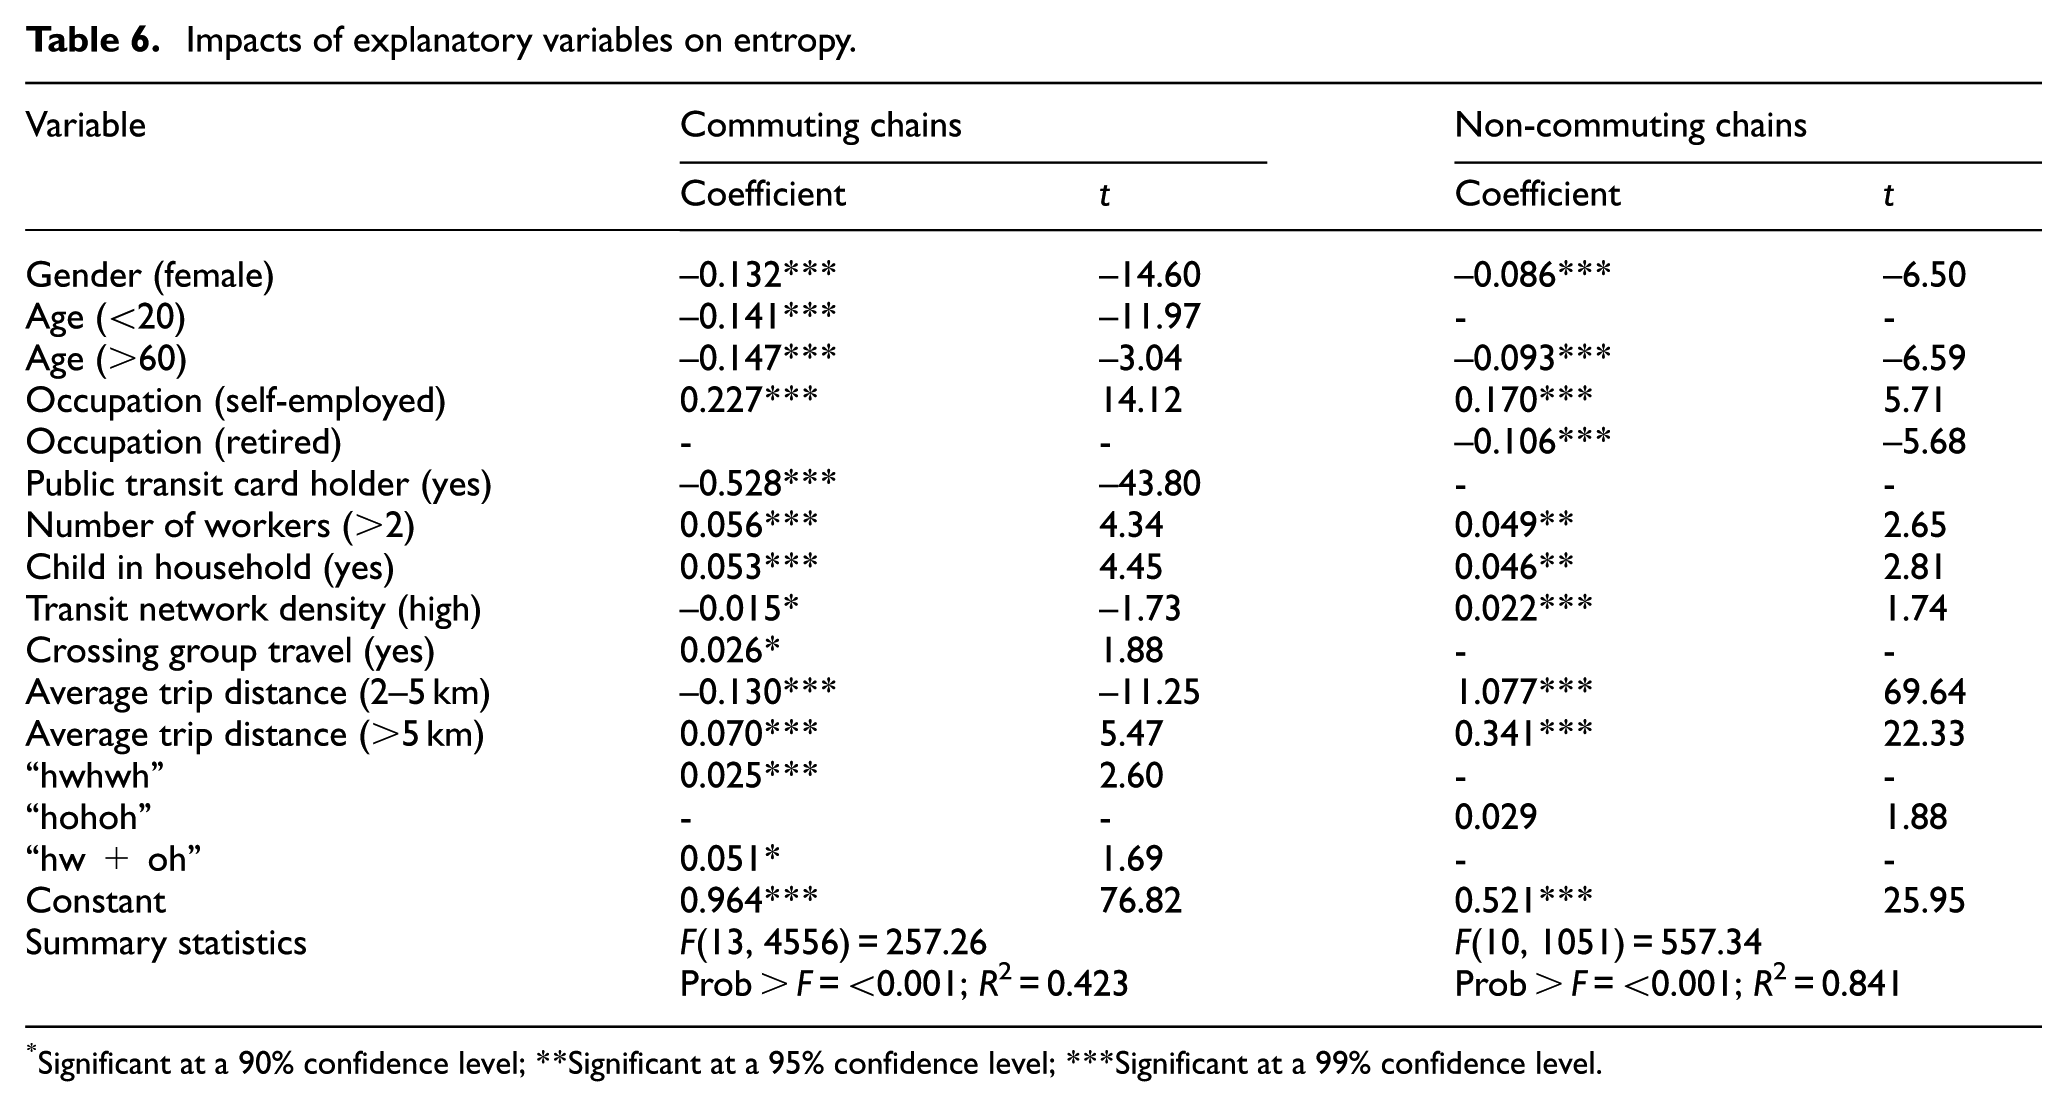
To investigate how factors affect the uncertainty in the mode choice process, we estimated linear regression models to relate the entropy to the explanatory variables. The modeling results for commuting and non-commuting trip chains are shown in Table 6. Females have lower entropy, which means mode choice is easy for females. Young and old people generally have lower entropy if compared to the people between 20 and 60 years old, probably because of the limitations in their physical conditions. Self-employed travelers have higher entropy in both chains, and retired people have lower entropy in non-commuting chains. In commuting trips, travelers holding a public transit card have lower entropy because they choose public transit more often.
Impacts of explanatory variables on entropy.
Significant at a 90% confidence level; **Significant at a 95% confidence level; ***Significant at a 99% confidence level.
The number of workers in household increases the entropy in the mode choices. The household with children has higher entropy because travelers need to consider the trip modes not only for themselves but also for their children. High transit network density decreases the entropy in commuting chains but increases the entropy in non-commuting chains. Cross group travelers have higher entropy because they have many considerations in the mode choice process such as speed, comfort, parking, or cost. As compared to short distance trips, medium distance commuting trips have lower entropy and long distance commuting trips have higher entropy. In non-commuting trips, both the medium distance and long distance have higher entropy. The complex trip chains are related to higher entropy because travelers need to consider more for different travel purposes in the selection of trip modes.
The analysis shows that the distributions of entropy among trip modes are different between the commuting and non-commuting trip chains. Some trip modes may have low entropy in one chain but may have high entropy in another chain. It indicates that the decision process of mode choice could have different mechanisms. Thus, it is desirable to distinguish the commuting and non-commuting trips in the analysis of mode choices. The information of entropy or uncertainty could be used to evaluate the easiness of mode switching behaviors—the trip mode with higher (or lower) uncertainty is more (or less) likely to switch to use other trip modes. This information could help policy makings to direct the mode switching behaviors in both commuting and non-commuting trips, which is discussed in the following section.
Discussion
The analysis in this study shows that not only the outcomes but also the decision process of mode choices are different between commuting and non-commuting trips. The differences between them are due to the facts that commuting trips often contain fixed destinations and time schedules, which are not allowed to change easily. Non-commuting trips often allow travelers to select the destinations and arrange the activities according to their preferences. This study suggests that the commuting and non-commuting travel activities need to be distinguished in the analysis of mode choice behaviors. Data analysis shows that bike and public transit are commonly used in commuting activities. Walk and public transit are common trip modes in non-commuting activities. The percentage of bike in non-commuting trips is quite lower than that in commuting trips.
Comparison between the results of two MNL models shows that the contributing factors to the mode choice decisions and their impacts are different between commuting and non-commuting trips. Some variables significantly affect mode choice in one trip chain but are not found to be significant in the other chain. Some variables even have opposite impacts. Travelers with children in household would like to use bike or public transit instead of walk for commuting. But in non-commuting trips, the coefficients for bike and public transit are not significant. High density of transit network decreases the probability of using bike or car in commuting trips but does not affect the choice of trip modes in non-commuting trips. Young travelers would like to choose walk or public transit for school but do not have preferences on trip modes in recreation or maintenance trips. Older travelers would like to take a public transit for work but would use bike or public transit less in non-commuting trips. Long distance commuting trips do not increase bike use, but long distance non-commuting trips increase bike use. In medium distance trips, car is used more for commuting but not for non-commuting trips.
The uncertainty in the mode choice process is investigated separately for commuting and non-commuting trips in this study. The uncertainty reflects the easiness of mode switching behaviors. If a traveler has a low entropy toward a trip mode, the traveler can be considered as a “firm mode user,” which means the traveler has a strong preference toward the trip mode chosen and will not easily change to use other trip modes. On the contrary, if a traveler has a high entropy, the traveler can be considered as a “potential mode switcher.” It means the traveler does not have strong preference in the mode choice and will probably change the trip modes easily. The information of uncertainty could help direct policy makings that affect mode choice behaviors.
In commuting trips, according to the entropy analysis results, travelers who are currently using public transit are considered as firm users. It means the public transit has loyal clients. The market share of public transit is quite stable and will not be impacted largely by new policies. The uncertainty evaluation shows that travelers who are using car for commuting are potential mode switchers. The mode share of car in commuting trips would switch to other trip modes if new policies that aim at regulating car use are applied.
In non-commuting trips, the entropy results reveal that walk has firm users and its market is quite stable. Bike users could choose other trip modes for non-commuting purposes easily. Policies that aim at promoting cycling in non-commuting trips would be less effective in such situation. The uncertainty of public transit in non-commuting trips is higher, indicating the public transit users are not as firm as in commuting trips. The uncertainty of car in non-commuting trips is higher, indicating car is considered as a preferred trip mode by travelers for non-commuting travel purposes. These results indicate that policies aim at promoting public transport use for those who driving car in non-commuting trips may be less effective than commuting trips.
Conclusion
This study explored the mode choice decisions between commuting and non-commuting trip chains and evaluated the uncertainty in the decision process. Based on the household survey data from one medium-sized city of Bengbu, China, five types of trip chains and four trip modes were considered. The MNL models were estimated separately for commuting and non-commuting chains, and the entropy was calculated as the measure of uncertainty in the mode choices. The factors that contribute to the uncertainty were estimated for different trip chains.
The results showed that the percentage of trip modes and the decision process were different between commuting and non-commuting trips. Bike was commonly used in commuting trips but was much less used in non-commuting trips. Walk was the nominate trip mode in non-commuting trips. The MNL model estimates showed that the contributing factors and their impacts on the mode choices were different between commuting and non-commuting trips. Some factors had significant impacts in one trip chain but do not have significant impacts in the other trip chain. Some factors were even found to have opposite impacts.
The analysis of uncertainty in the mode choice process showed that in commuting chains, the choice of car had the largest amount of uncertainty, while the choice of public transit had the least uncertainty. In non-commuting chains, the bike choice had the largest uncertainty, while the walk choice had the lowest uncertainty. The uncertainty reflects the difficulty in mode choices and the easiness in mode switching behaviors. According to the uncertainty, a traveler can be considered as a “firm mode user” or a “potential mode switcher.” The contributing factors to the magnitude of uncertainty in the mode choices were also investigated.
Findings of this study may help to better understand the decision process of mode choices between commuting and non-commuting trip chain patterns. This study suggests that different trip purposes need to be distinguished in the studies of mode choice behaviors. Besides, findings of this study could assist the policy makings that affect mode choices. In our future studies, more types of trip chains and trip modes could be considered in the mode choice studies. Besides, the sequence of trip modes used in multiple travel activities is not considered in the present study. A study on the “mode chains” in the trip chains could lead to more interesting findings. The authors recommend that future studies could focus on these issues.
Footnotes
Handling Editor: Martin Baumann
Declaration of conflicting interests
The author(s) declared no potential conflicts of interest with respect to the research, authorship, and/or publication of this article.
Funding
The author(s) disclosed receipt of the following financial support for the research, authorship, and/or publication of this article: The research is jointly supported by the National Natural Science Foundation of China (51508122, 71871057, 51678132), National Key R&D Program in China (2016 YFE0108000), Guangxi Key Research and Development Program (Grant No. 1524800210, Guike AB16380280, Guike AB17292087), Guangxi Natural Science Foundation (Grant No. 2015GXNSFBA139216), Innovation Project of Guangxi Graduate Education (YCSW2018146), and the Scientific Research Project of Chinese National Ministry of Housing and Urban-Rural Construction (2017K2-009).