
Abstract
To study the influence of tip clearance on performance (external characteristics, pressure fluctuation and tip loss) of a low specific speed mixed-flow pump, unsteady simulation was performed for the whole flow passage with five tip clearance sizes (δ0 = 0 mm, δ1 = 0.10 mm, δ2 = 0.25 mm, δ3 = 0.75 mm and δ4 = 1 mm). The reliability of the numerical methodology was verified in external characteristics (efficiency, head and power) and fluctuation. The performance of the pump was obtained under different discharges and tip clearance sizes using ANSYS CFX. The results showed that the variation of tip clearance size has greater effect on the external characteristics under large discharges. Meanwhile, along the flow direction, the fluctuation coefficients near the impeller shroud increase gradually with the smaller tip clearance sizes (δ = 0.10 and 0.25 mm), while for the larger tip clearance sizes (δ = 0.75 and 1.00 mm), the significant increase of fluctuation near the shroud of impeller inlet is closely associated with the clear leakage vortex and the large region of low pressure. Besides, with the increase of tip clearance size, the effect of tip clearance will become more remarkable under different discharge conditions. According to this study, for the optimization design of such pumps, the size of the tip clearance is suggested to be about 0.9% times the blade height at middle of the impeller passage.
Keywords
Introduction
Because the tip clearance (TC) of the mixed-flow pumps exists between impeller shroud and pump case, so the leakage of fluid is easily to happen. Also, the tip leakage vortex aroused by the TC may seriously affect the mainstream flow, resulting in the enhancement of pressure fluctuation and the degradation of overall performance of the pump.1–6
In recent years, many studies have been carried out in the aspects of the effect of TC on external characteristics, pressure fluctuation and tip leakage for pumps. In the first aspect, by setting different TC sizes of a mixed-flow pump, Li et al. 7 found the positive slope characteristic of the head curve could be effectively suppressed when TC was 0.5 mm. Meanwhile, Dong et al. 8 and Tan et al. 9 also found that the impeller TC effect could change the head curve of the mixed-flow pump. Also, Bing et al. 10 experimentally determined the external characteristics of a mixed-flow pump with different TCs and found that they all decrease with the TC increases. However, few quantitative studies were performed on the sensitivity of the external characteristics of pump to the TC size, especially for the low specific speed mixed-flow pump (LSSMFP).
For the aspect of pressure fluctuation, by simulating an axial flow pump, Feng et al. 11 demonstrated that the existence of TC will increase the pressure fluctuation from hub to shroud of the impeller, while no obvious impact on the pressure fluctuation in the diffuser. Meanwhile, Zhang et al. 12 found that the tip leakage had larger impact on the pressure fluctuation in impeller than that in diffuser by investigating the TC effect of a mixed-flow pump. Besides, Zhang et al. 12 and Liu and colleagues13,14 obtained a similar conclusion, that is, the pressure fluctuation will increase dramatically if the TC increases to 1 mm. Many studies have shown that the pressure fluctuation in the pumps will be enhanced with the increase of TC size. However, when the TC size is small enough, the pressure fluctuation will also be enhanced as a result of the enhancement of the rotor–stator interaction between impeller shroud and pump case, while few studies have been performed on this case.
For the aspect of tip leakage flow, Li et al. 15 explored the phenomenon of rotating stall in a mixed-flow pump and found that some vortexes were generated due to the mixture between mainstream and leakage flow. Also, many studies so far have focused on the leakage vortex. By investigating the evolution of tip leakage vortex, Miorini et al. 16 obtained that the leakage vortex could cause the flow separation. However, Yang et al. 17 found that the leakage vortex in a synchronal rotary multiphase pump could be effectively suppressed by reducing the rotor radial clearance.
Although many studies on the effect of TC on the performance of pump have been investigated by far, the effect of TC has not been quantitatively evaluated and no unified standard for the selection of TC size in the optimization design of pumps. In this study, under different TC sizes, the unsteady flow in a LSSMFP was simulated with ANSYS CFX 14.0. The sensitivity of the efficiency variation to the TC variation was analysed, and the relationship between tip leakage and pressure fluctuation was discussed, which will help in the optimization design for the LSSMFP.
Configuration description of the mixed-flow pump
The configuration descriptions of the pump are listed in Table 1. According to equation (1), 18 the specific speed of this pump is determined to be 149. Meanwhile, the three-dimensional calculation model and the experimental pump model are presented in Figures 1 and 2, respectively.
Configuration descriptions of the pump.


Calculation model.

Experimental model.
Furthermore, the relevant content of experiment has been described in previous published literature 12

Numerical methodology
Governing equations
To simulate the turbulence flow in the pump, unsteady Reynolds-averaged Navier–Stokes (URANS) equations were solved using the commercial code ANSYS CFX 14.0. The continuity and momentum equations in the Cartesian coordinates can be written as


where F is the sum of body forces,
To verify the applicability of the turbulence model, the turbulence is modelled by the

where Rsim and Rexp denote the performance value from simulation and experiment, respectively. From Table 2, the relative errors of the efficiency and the head calculated by SST
Comparison results between simulation and experiment.

SST: shear stress transport; RNG: renormalization group.
Structured grid and numerical solutions
Structured grids are generated for all parts of this pump, for the inlet and outlet pipes, the grids are generated with ICEM CFD 14.0, while for the impeller and diffuser passages, the grids are created with TurboGrid 14.0. Furthermore, H/J/C/L topologies are applied to the impeller and diffuser passages,
19
the values of Yplus at the blade wall are about 25, which is acceptable for the SST

Grids for (a) impeller and (b) diffuser passages.
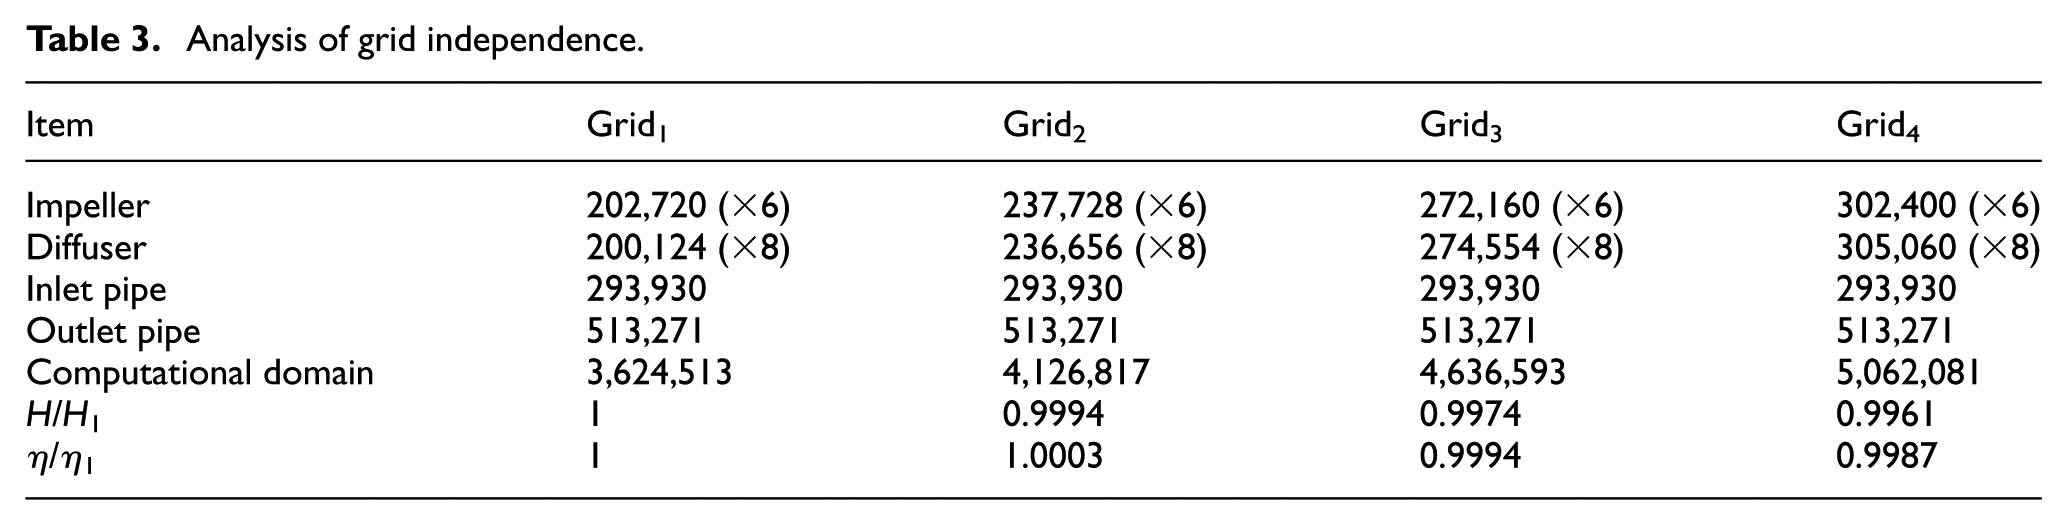
Analysis of grid independence.
At the inlet and outlet of the computational domain, the discharge and average pressure are specified, respectively. Nonslip condition of viscous fluid is imposed on the near-wall region and a transient rotor–stator approach is adopted for data exchange in the rotor–stator interaction region (namely the impeller–inlet pipe interface region and impeller–diffuser interface region). The unsteady simulation is initiated with the results of steady simulation. At the unsteady simulation stage, the timescale plays a key role in determining the numerical results, so two time steps (Δt1 = 0.00015 s, Δt2 = 0.0002 s) were analysed, as shown in Figure 4. There is little difference in the pressure variation of monitoring points PS2–PS4 at these two time steps. Therefore, Δt2 = 0.0002 s was selected finally to improve the computational efficiency. Meanwhile, the total time is 0.3 s, namely 15 cycles are calculated for the unsteady simulation; 21 root mean square (RMS) residual < 1 × 10⁻⁴ is regarded as the convergence criteria. The schemes of high-resolution and second-order backward Euler are adopted for the advection and transient terms, respectively.

Time domain characteristics of monitoring points PS2–PS4 at two time steps.
Setting of numerical and experimental points
The numerical monitoring points are set near the impeller shroud to acquire the effect of TC on the pressure fluctuation therein, as shown in Figure 5(a), where points PS1–PS4/SS1–SS4 are located near the pressure/suction surfaces, respectively. Due to the technical reasons, the pressure sensors are only deployed on the hub of diffuser in this test. The experimental points in the diffuser are displayed in Figure 5(b); also, the numerical monitoring points in the diffuser are set accordingly to compare with the experimental results.

Setting of numerical and experimental points: (a) numerical points in the impeller and (b) points on the hub of the diffuser.
Results and discussions
Validations of external characteristics and fluctuation characteristics
The results of unsteady simulations under 10 discharge conditions (δ1 = 0.25 mm) are shown in Figure 6. The variation trend of the numerical efficiency, head and power curves is in agreement with the experimental ones. The pressure fluctuation characteristics of points H5C–H8C (Figure 5(b)) with the TC of 0.25 mm under design condition are displayed in Figure 7. On the whole, the fluctuation characteristics from simulation are consistent with the experiment; 6 fn and 12 fn are the dominant frequency and subdominant frequency in these two cases, respectively. Therefore, based on the above analysis, it can be concluded that the numerical method used in our study is reasonable.

Comparison results for simulation and experiment (relative discharge m = Q/Qd).
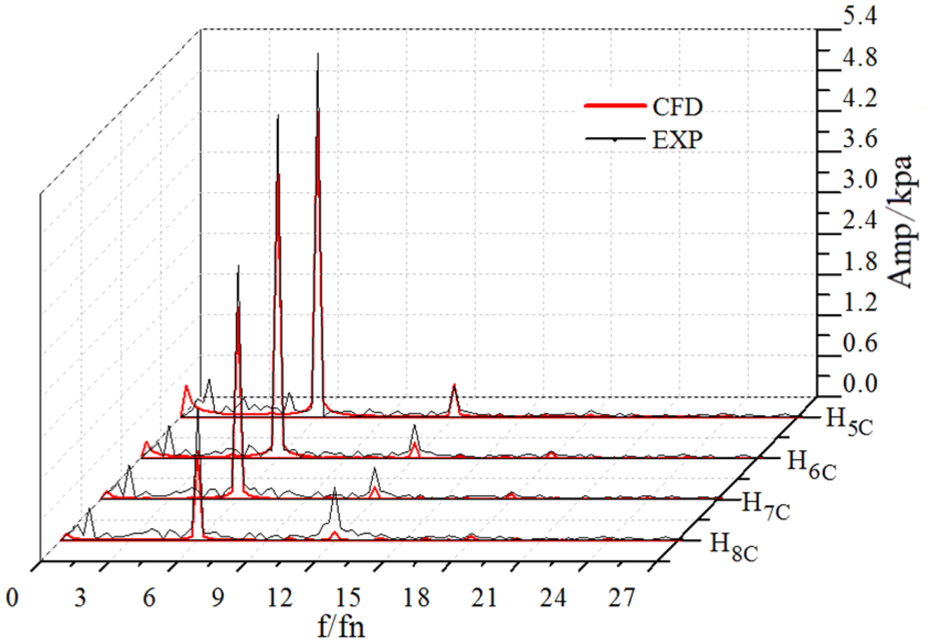
Fluctuation characteristics of points H5C–H8C under conditions of m = 1, δ1 = 0.25 mm.
Effect of TC on the external characteristics
In order to provide a theoretical basis for the TC’s selection in the optimization design of the LSSMFP, the effect of TC size on the external characteristics and internal flow is explored. Here, five discharge conditions (0.5Qd, 0.75Qd, 1Qd, 1.25Qd and 1.5Qd) with each TC size (δ0 = 0 mm, δ1 = 0.10 mm, δ2 = 0.25 mm, δ3 = 0.75 mm and δ4 = 1 mm) are studied; the results are presented in Figure 8. For the same relative discharge, the values of efficiency and head of this pump decrease gradually with the increase of TC size; this is mainly because the volumetric loss caused by the tip leakage increases with the TC increases. Besides, the differences of external characteristic values (efficiency, head and power) under large discharge conditions (1.25Qd, 1.5Qd) are greater than for small discharge conditions (0.5Qd, 0.75Qd). This is because the flow separation occurs near the pressure surface under large discharge condition; thus, the fluid therein will be subjected to a weaker driving effect by the mainstream. Then, under the action of pressure difference between the two sides of the blade, the tip leakage is easier to happen and results in greater hydraulic and volumetric losses. Meanwhile, it indicates that the effect of the TC variation on the internal flow is more prominent under large discharge conditions.

Comparison of external characteristics from simulation with different TCs: (a) relative discharge–efficiency characteristics, (b) relative discharge–head characteristics and (c) relative discharge–power characteristics.
According to Figure 8(a), the relationship between the efficiency reduction Δη and the relative discharge m can be obtained under different TC variations (Δδ1 = δ4 − δ3 = 0.25 mm, Δδ2 = δ3 − δ2 = 0.5 mm, Δδ3 = δ4 − δ2 = 0.75 mm), as shown in Figure 9. It can be seen that under different TC variations, the trend of efficiency reduction is similar to each other, while the slope of the relative discharge-efficiency reduction (m – Δη) curve increases gradually with the TC variation increases. Meanwhile, the variation range of efficiency reduction Δη is small under different TC variations at m < 1; while it expands significantly at m > 1. This is because more serious leakage loss happens under larger discharge conditions, and which is in accordance with the experiment results obtained by Bing et al. 10

Relative discharge m–efficiency reduction Δη characteristics.
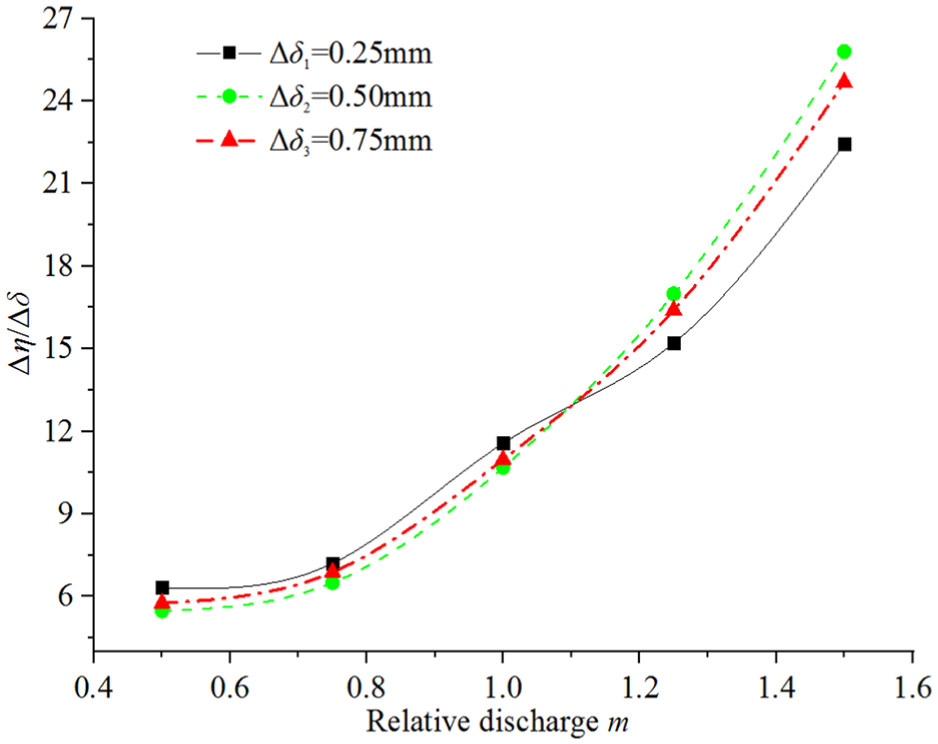
In addition, the variation trend of the relative discharge–the ratio of efficiency reduction to the TC variation (m – Δη/Δδ) is displayed in Figure 10. The variation trend of m – Δη/Δδ curves is similar under different TC variations, which illustrates that the effect of different TC variations on the efficiency of pump is similar. Besides, the m – Δη/Δδ curves are approximately parabolic under different TC variations, so a mathematical expression (5) can be obtained by fitting. Here, the value of R 2 for the fitting effect is 0.987

The relative discharge–the ratio of efficiency reduction to TC variation (m – Δη/Δδ).
It reveals from expression (5) that the Δη/Δδ value increases markedly if the relative discharge m increases, that is, for a given Δδ, the efficiency reduction Δη increases rapidly with the relative discharge m increases. Moreover, another form can be derived by deforming

Therefore, expression (6) shows that, for a given relative discharge m, there is a liner relationship between the efficiency reduction Δη and the TC variation Δδ, and its slope increases with the relative discharge m increases.
Effect of TC on the pressure fluctuation characteristics
The pressure fluctuation is a phenomenon that the pressure at any point in turbulence varies randomly around its time-averaged signal. Meanwhile, the pressure fluctuation coefficient Cp is usually used to indicate the degree of pressure fluctuation in the pump and it is defined as 14
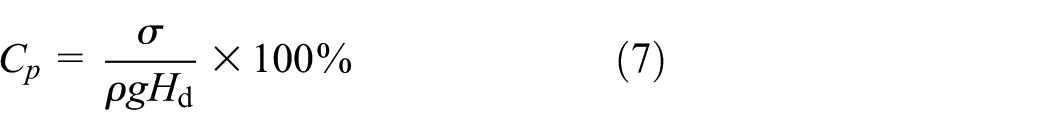
where Hd is the design head;

here, pi(t) is the instantaneous pressure while
The pressure fluctuation coefficients
Cp of points near the impeller shroud under design condition with different TCs (%).

TC: tip clearance.
It can also be obtained from Table 4, the fluctuation intensity of the corresponding points at pressure surface is larger than that at suction surface; thus, the time domain analysis of points PS1, PS4 (Figure 5(a)) with four TCs in one cycle is drawn in Figure 11. From Figure 11(a), compared with the smaller TCs (δ = 0.10 and 0.25 mm), the average pressure of point PS1 under larger TCs (δ = 0.75 and 1.00 mm) is smaller while the fluctuation is larger, which manifests that the large TC size will increase the pressure fluctuation. Form Figure 11(b), the average pressure of point PS4 decreases with the TC increases. Also, eight peaks and valleys occur during one cycle, which is consistent with the number of diffuser blades.

Time domain analysis of (a) point PS1 and (b) point PS4 with different TCs (Q = Qd).
The maximum amplitude of pressure fluctuation of points PS1, PS4 under different discharge conditions with different TCs is displayed in Figure 12. From Figure 12(a), the maximum amplitude of point PS1 with different TCs changes little when the discharge is smaller (Q = 0.50Qd, 0.75Qd). For the larger discharge conditions (Q = 1.00Qd, 1.25Qd), the maximum amplitude of point PS1 is small under conditions of δ = 0.10 and 0.25 mm, while it increases significantly under conditions of δ = 0.75 and 1.00 mm. that is, for Q = 1.25Qd, the maximum amplitude of point PS1 under conditions of δ = 0.75 and 1.00 mm is 22.09 and 8.4 times the condition of δ = 0.25 mm, and 13.86 and 5.27 times the condition of δ = 0.10 mm. This indicates that the maximum amplitude of fluctuation near the impeller inlet is closely associated with the leakage; it will increase markedly if the leakage is large (both the TC size and the discharge are large). Figure 12(b) shows that the maximum amplitude of point PS4 with different TCs at 0.50Qd condition is the largest, followed by the 1.25Qd and 0.75Qd conditions, then it is the smallest at 1.00Qd condition.

Maximum amplitude of (a) point PS1 and (b) point PS4 under different discharges with different TCs.
Effect of TC on the tip loss
The existence of TC is a major factor for the volumetric loss. Also, the hydraulic loss can be made by the disturbance of the tip leakage flow on the mainstream.22,23 Therefore, the tip loss here represents the gross effect aroused from the tip leakage flow. Figures 13 and 14 show the velocity vector and the pressure distribution near the pressure surface, respectively. From Figure 13(a) and (b), the flow separation occurs near the shroud when the TCs are smaller (δ = 0.10 and 0.25 mm). This ascribes to the disturbance of the tip leakage flow and an imbalance between the fluid inertia force within the boundary layer and the inverse pressure gradient. 12 The corresponding pressure distributions of the meridional surface are presented in Figure 14(a) and (b). Meanwhile, some higher speed fluid appears near the shroud at δ1 = 0.10 mm than that at δ2 = 0.25 mm, which is closely associated with the larger pressure fluctuation near the shroud at δ1 = 0.10 mm.

Distribution of velocity vector near the pressure surface with different TCs (Q = Qd): (a) δ1 = 0.10 mm, (b) δ2 = 0.25 mm, (c) δ3 = 0.75 mm and (d) δ4 = 1.00 mm.

Distribution of pressure near the pressure surface with different TCs (Q = Qd): (a) δ1 = 0.10 mm, (b) δ2 = 0.25 mm,(c) δ3 = 0.75 mm and (d) δ4 = 1.00 mm.
When the TC sizes are larger (δ = 0.75 and 1.00 mm), the flow separation area gets larger and the leakage vortex at the impeller inlet becomes more obvious (Figure 13(c) and (d)). It can be seen that a larger region of low pressure appears in the corresponding region, as shown in Figure 14(c) and (d). Then, combined with the results in Table 4, the significant increase in pressure fluctuation of point PS1 under larger TC sizes is closely connected with the obvious leakage vortexes and the larger region of low pressure.
Based on the results presented in Table 4, Figures 13 and 14, for these four TC sizes, the Cp at corresponding points near the impeller shroud is smallest at δ2 = 0.25 mm, which reveals that the smaller TC size is not necessarily the better. If the TC size is too small, the rotor–stator interaction between the impeller shroud and the pump case will enhance, while if the TC size is too large, the leakage and the flow separation will aggravate, resulting in the appearance of large leakage vortexes at the impeller inlet. According to this study, 0.25 mm is the most suitable for the TC size. Meanwhile, the blade height at the middle of impeller passage is 28 mm; thus, a suggestion can be made for the optimization design of the LSSMFP, that is, the TC size should be about 0.9% times the blade height at the middle of impeller passage.
The existence of the TC will lead to the decrease of pump efficiency. In order to measure the effect of TC on tip loss and pump efficiency, the following relation is defined

here, η1 is the pump efficiency at δ = 0 mm, while η2 denotes the efficiency considering the effect of TC; ξ is the impact factor of TC, and a larger value of ξ means the TC effect is more remarkable. The impact factor ξ with four TCs under different discharge conditions is displayed in Figure 15. It can be seen that with the increase of TC size, the impact factor ξ under these four discharge conditions increases. Compared with the smaller TCs (δ = 0.10 and 0.25 mm), the impact factor ξ increases dramatically under the larger TCs (δ = 0.75 and 1.00 mm), that is, for 1.0Qd condition, the impact factors ξ at conditions of δ = 0.10 and 0.25 mm are 2.18% and 2.81%, respectively, while under conditions of δ = 0.75 and 1.00 mm, they increase to 8.94% and 12.25%, respectively. This is closely related with the complex flow near the impeller inlet under the large TCs (Figures 13 and 14). Meanwhile, the impact factor ξ varies slightly among these four discharges under the smaller TC sizes, while there is a great difference in the large TC sizes. It can also be seen that for 1.25Qd condition, the impact factor ξ is the lowest under the smaller TC sizes, while it is the highest under the large TC sizes, which demonstrates that under the large discharge condition, the variation of TC has a significant influence on the flow in the pump, corresponding with the analysis of Figure 8.
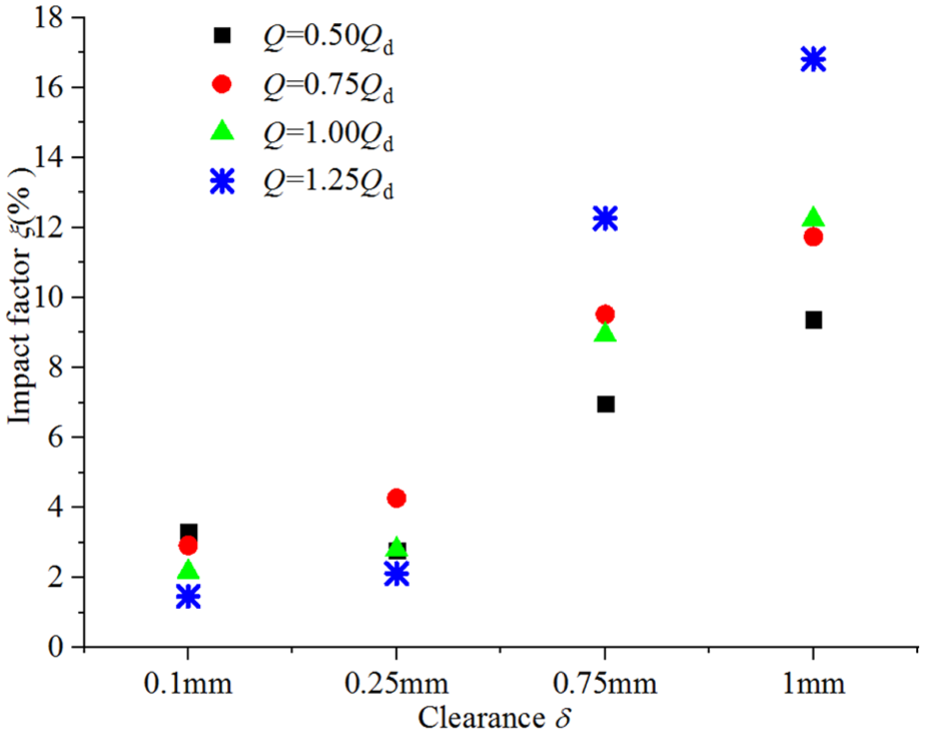
Analysis of impact factor ξ with four TCs under different discharge conditions.
Conclusion
Although the TC size is important for the optimization design of the pumps, there is no unified standard for its selection. In present paper, the effects of TC on the external characteristics, pressure fluctuation and tip loss of a LSSMFP were analysed. The main purpose of this study is to have a further understanding of the TC effect and propose a quantitative criterion for the selection of TC size of the LSSMFP.
For the same relative discharge condition, the efficiency and head of the pump decrease gradually with the TC increases, and the variation of TC size has a greater effect on the external characteristics under the large discharge conditions than for the small discharge conditions. Meanwhile, a quantitative relationship between TC variation, efficiency reduction and relative discharge is obtained.
Along the flow direction, the pressure fluctuation coefficients near the impeller shroud increase gradually under the smaller TC sizes (δ = 0.10 and 0.25 mm), while for the larger TC sizes (δ = 0.75 and 1.00 mm), the fluctuation intensity near the shroud of impeller inlet section increases significantly, which has a close correlation with the clear leakage vortex and the large region of low pressure therein.
Compared with the conditions of δ = 0.10, 0.75 and 1.00 mm, the pressure fluctuation of corresponding points near the impeller shroud is the smallest at δ2 = 0.25 mm, which reveals that the smaller TC size is not necessarily the better. According to this study, for the optimization design of LSSMFP, the TC size is suggested to be about 0.9% times the blade height at the middle of impeller passage.
Due to the tip leakage, the flow separation occurs near the impeller shroud and the leakage vortex comes into being gradually. Also, with the increase of the TC size, the separation area gets larger and the effect of TC becomes more significant. In particular, in the case of large TC sizes (δ = 0.75 and 1.00 mm), this effect gets a great promotion relative to the case of small TC sizes (δ = 0.10 and 0.25 mm).
Footnotes
Appendix 1
Handling Editor: Jose Ramon Serrano
Declaration of conflicting interests
The author(s) declared no potential conflicts of interest with respect to the research, authorship and/or publication of this article.
Funding
The author(s) disclosed receipt of the following financial support for the research, authorship and/or publication of this article: The project was supported by National Natural Science Foundation of China (grant nos 51579006 and 51679122).