
Abstract
The understanding of pressure fluctuation mechanism is the basis for stability and noise analysis in pumps. In this article, numerical study was carried out for the pressure fluctuation within the impeller and the guide vane of a low specific speed mixed-flow pump. Structured mesh was adopted in the whole flow passage. The numerical approach was validated by comparing with the experimental data of external characteristics and fluctuation in the guide vane passage. Through MATLAB code and Fourier analysis, the pressure fluctuation in the whole flow passage was obtained at four flow rate conditions. It is found that pressure fluctuation due to rotor–stator interaction is first enhanced and then weakened along the stream-wise direction with the maximal value located near the guide vane inlet. As a result of the structure design of passage and secondary flow, some obvious vortexes will form at the hub region near the pressure surface at small flow rate conditions, thus aggravating pressure fluctuation therein. On the whole, pressure fluctuation at small flow rate conditions is more remarkable with the fluctuation period being more disordered; the fluctuation intensity is higher in the guide vane than the impeller, while the area of strong fluctuation is also wider.
Keywords
Introduction
The structure and performance of mixed-flow pumps are between centrifugal and axial flow pumps. The features such as compact structure, easy starting, and high efficiency make it suitable for use in farmland irrigation, water-logging drainage, sewage treatment, power-plant cooling, and so on.1–4 Mixed-flow pumps are generally grouped into low specific speed, medium specific speed, and high specific speed mixed-flow pumps. And this range changes with market demand and R&D technology.
In recent years, research has been conducted on performance optimization, pressure fluctuation, and internal flow of the centrifugal and axial flow pumps.5–9 For mixed-flow pumps, related research has mainly concentrated on the performance and flow instability. In the first aspect, Kim et al. 10 explored the effect of tip clearance on head and hydraulic efficiency of a mixed-flow pump and found that the existence of tip clearance could improve the “saddle” phenomenon of head-flow characteristic; employing non-linear circulation distribution, Zhang et al. 11 optimized the flow pattern at the impeller outlet of a mixed-flow pump to increase the hydraulic efficiency. For flow instability, the study with particle image velocimetry (PIV) technology by Miyabe et al.12,13 shows that the unstable head-flow characteristic is caused by the large-scale abrupt backflow from the vaned diffuser to the impeller outlet, and some measures are put forward to improve the positive slope of the head performance curve; in the analysis of Yamade et al., 14 large eddy simulation was performed for internal flow of a mixed-flow pump and it was found that the instability characteristic took place when the flow rates are 55%–60% of the design condition.
On the whole, the specific speed of the mixed-flow pump in research so far is usually between 300 and 700. 15 For the case with the specific speed less than 300, Zhang et al. 16 explored the influence of tip clearance on the pressure fluctuation and found that the pressure fluctuation in the shroud region of the impeller inlet suddenly increased when the clearance value was 1.0 mm. In addition, as it is difficult to set monitoring points in the rotating passage, no much research is performed on the pressure fluctuation in the impeller passage. In this study, unsteady simulation was carried out with ANSYS_CFX 14.0 for the internal flow of a mixed-flow pump (ns = 149), and the results were processed with Fourier analysis and MATLAB. The flow field and pressure fluctuation in the impeller and guide vane passages were explored to obtain a more comprehensive understanding of pressure fluctuation mechanism in such pumps, which will help in design optimization.
Structure and parameters of the pump
The three-dimensional (3D) geometric model of the whole flow passage and the test pump model of the mixed-flow pump are shown in Figures 1 and 2, respectively. Its design parameters are listed in Table 1 where the specific speed is computed by 15


Configuration of the mixed-flow pump.

Test model of the mixed-flow pump.
Design parameters of the mixed-flow pump.

Numerical methods
Governing equations
To explore the characteristics of pressure fluctuation in this pump, unsteady Reynolds-averaged Navier–Stokes (RANS) equations are solved for the internal flow in the framework of ANSYS_CFX 14.0. The continuity and momentum equations for incompressible flow can be written as 17


where,
where a1 is the model constant (a1 = 5/9), S is an invariant measure of strain rate, F2 is the blending function, and k and ω are the turbulence kinetic energy and the turbulence frequency, respectively.
Mesh and boundary conditions
Separate meshes were generated for the inlet pipe, outlet pipe, impeller, and guide vane. ICEM_CFD and TurboGrid were used for the mesh generation of the former two parts and the latter two parts, respectively. The distance of the first node from the wall was controlled ensuring that the y+ values are between 20 and 30. Meanwhile, scalable wall functions were used and about 15 boundary layers were placed in the near-wall region. The mesh view of the four flow parts are demonstrated in Figure 3. Figure 4 shows the mesh independence analysis of the mesh system at the design condition. Here, efficiency_CFD represents the hydraulic efficiency of the pump calculated by ANSYS_CFX. The numbers of mesh elements and nodes in each part of the computation domain are shown in Table 2.

Mesh in the four parts: (a) impeller, (b) guide vane, (c) inlet pipe, and (d) outlet pipe.
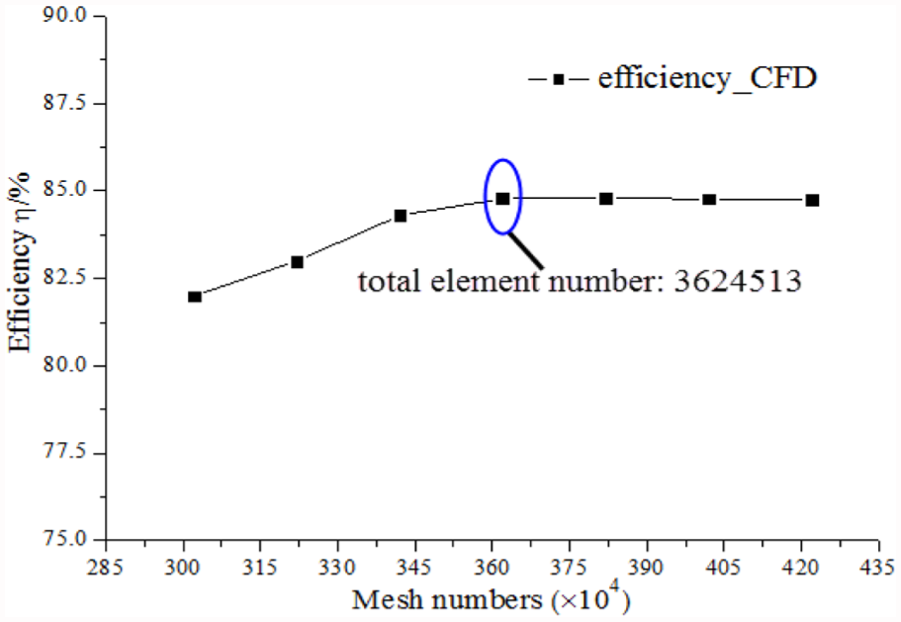
Analysis of mesh independence.
Mesh numbers in each part of the computation domain.

A constant velocity was specified according to experimental values at the inlet of the computational domain, with the flow direction normal to the inlet surface. At the outlet, the free outflow condition was used. No-slip condition was imposed on all wall boundaries. The transient rotor–stator approach was adopted for data exchange in the rotor–stator interaction region (namely, the impeller–inlet pipe interaction region and the impeller–guide vane interaction region), through which the true transient interaction of the flow can be predicted.
Setting and validation of monitoring points
According to the rotational speed listed in Table 1, the period of the rotation is 0.03 s. Meanwhile, according to Wang et al., 19 the time step for unsteady calculation was set to 0.0002 s in the simulation, corresponding to the impeller rotation of 2.4° a time step. The total time of simulation is set as 15 periods, that is, 0.45 s.
To obtain the pressure information in the mixed-flow pump, four surfaces were set in both the impeller and guide vane passages from the inlet to the outlet, respectively, as shown in Figure 5, where PiC (i = 1–8) denotes the center point of the surface, while Pih (i = 1–8) denotes the middle point of the hub side of these surfaces. What’s more, the setting of Pih in the simulation is in accordance with the experiment for reasonable comparison.

Location of monitoring points (ps, ss, and hub_s denote the pressure surface, the suction surface, and the hub surface, respectively): (a) impeller passage and (b) guide vane passage.
Figure 6 is the frequency domain diagrams of the points P5h and P8h located in the guide vane passage. It can be observed that the dominant frequencies of the two points are all 6fn in both the simulation and the experiment. The amplitudes of the dominant frequency agree well with each other, and the frequency 12fn occurs in both conditions. This is resulted from the action of the impeller on the guide vane as the impeller blade number is 6. Meanwhile, the fluctuation amplitude of point P5h, which is nearer to the guide vane inlet, is larger than that of point P8h, and there are more low frequencies from experiment.

Frequency domain diagrams of the points P5h and P8h.
Results and discussions
Performance comparison with the experiment
At eight different flow rate conditions, simulation was done for the transient flow in the pump, as shown in Figure 7. The performance curves (involving head, efficiency, and power performance) from the simulation agree well with the experiment, and the relative error of efficiency, head, and power at the design condition is 7.8%, 6.3%, and 2.1%, respectively, which manifests the reliability of the adopted numerical methodology. The relative error herein is defined as
where Xsim and Xexp denote the performance value from simulation and experiment, respectively. However, the performance curves demonstrate that the pump not only has a wide area of high efficiency but also avoids the saddle phenomenon of a traditional mixed-flow pump. Meanwhile, the maximum error is efficiency prediction at large flow rate conditions. This may be due to more severe cavitation at such conditions. What’s more, this simulation only considered hydraulic efficiency, ignoring volumetric and mechanical losses.

Performance comparison between the simulation and the experiment.
Pressure fluctuation in the impeller passage
The pressure fluctuation of the four center-monitoring points in the impeller passage is presented in Table 3. Here, the pressure fluctuation coefficient is defined as
where Hd is the design head, and S is the standard deviation of pressure fluctuation of the monitoring points, namely

where Pi(t) is the pressure at time t while
Pressure fluctuation coefficients in the impeller passage (%).

As shown in Table 3, the pressure fluctuation coefficients increase gradually from inlet to outlet of the impeller passage at four flow rate conditions. The maximum values appear near the impeller outlet, which is closely related to the rotor–stator interaction and the complicated flow state at the outlet region. Here, the pressure fluctuation coefficient of point P4C at the 0.5Qd, 0.75Qd, and 1.25Qd conditions are 6.27, 2.95, and 1.22 times as large as that at the design condition, respectively.
The pressure fluctuation of point P4C at different flow rates is demonstrated in Figure 8. Periodicity of the pressure fluctuation of point P4C at Qd and 1.25Qd conditions is better, while pressure fluctuation is more disordered in the 0.5Qd and 0.75Qd conditions. Through fast Fourier transform (FFT), corresponding frequency-domain diagram is obtained and shown in Figure 9. The dominant frequencies of point P4C are all 8fn in the four conditions, which is resulted from the action of the guide vane on the impeller (the blade number of guide vane is 8). The amplitude of fluctuation for the dominant frequency in the 0.5Qd, 0.75Qd, and 1.25Qd conditions are 4.68, 2.12, and 1.29 times as great as that in the design condition, respectively. In 0.5Qd and 0.75Qd conditions, there are also the secondary frequencies, that is, 0.37fn and 3.25fn, respectively, accompanied by many other frequencies. According to Table 3 and Figures 8 and 9, it can be concluded that the pressure fluctuation of the impeller passage in the small flow rate conditions is affected significantly by the rotor–stator interaction. Therefore, off-design conditions, especially the small flow rate conditions, should be avoided in the running of the mixed-flow pump.

Time domain characteristic of point P4C.

Frequency-domain characteristic of point P4C: (a) Q = 0.5Qd, (b) Q = 0.75Qd, (c) Q = Qd, and (d) Q = 1.25Qd.
Figure 10 shows the streamlines’ distribution in the impeller passage at 0.298 s on the span of 0.1. Here, the span denotes the dimensionless distance of the analyzed surface from the hub. It can be seen that the streamlines are well distributed in the design and 1.25Qd conditions, while in 0.5Qd and 0.75Qd conditions, obvious vortexes occur at the hub region near the pressure surface. The formation of vortexes is closely related to the passage design of the low specific speed mixed-flow pump. Impeller blades were designed with a great distortion and a large wrap angle. Due to the viscous effect, vortexes and dead zones will emerge at the convex surface (located at pressure surface) near the impeller outlet at 0.5Qd condition, 15 namely, vortex 1 in Figure 10(a). Because of this vortex 1, the cross-sectional area is reduced, and hence, the flow near the pressure surface becomes more disordered. Meanwhile, it hinders the succeeding fluid from upstream, leading to the thickening of upstream boundary layer, and thus forms vortex 2, as shown in Figure 10(a). At 0.75Qd condition, due to the larger velocity in the main flow area, no obvious dead zone can form near the pressure surface in the impeller outlet region, but the upstream near-wall region is still affected and vortexes appear there. With the further increment in flow rate (design and 1.25Qd conditions), vortexes near the pressure surface will gradually weaken and finally disappear.

Streamlines’ distribution in the impeller passage (span = 0.1): (a) Q = 0.5Qd, (b) Q = 0.75Qd, (c) Q = Qd, and (d) Q = 1.25Qd.
According to the vortex distribution at 0.5Qd condition in Figure 10(a), the central hub-to-shroud surface 15 can be drawn, which passes through the vortex center. Figure 11 demonstrates the meridional flow field corresponding to the central hub-to-shroud surface. The pressure distribution shows larger axial component of the pressure gradient near the impeller outlet, which results in the pressure gradient from the hub to the shroud. Meanwhile, because of wide flow passage of the pump, the pressure gradient effect in this direction becomes more prominent, which leads to the secondary flow in an opposite direction near the outlet. 20 Influenced by this secondary flow and adverse pressure gradient in the main flow direction, thickness of the boundary layer at hub wall increases, and hence, flow separation and vortex occur (Figure 11(b)).
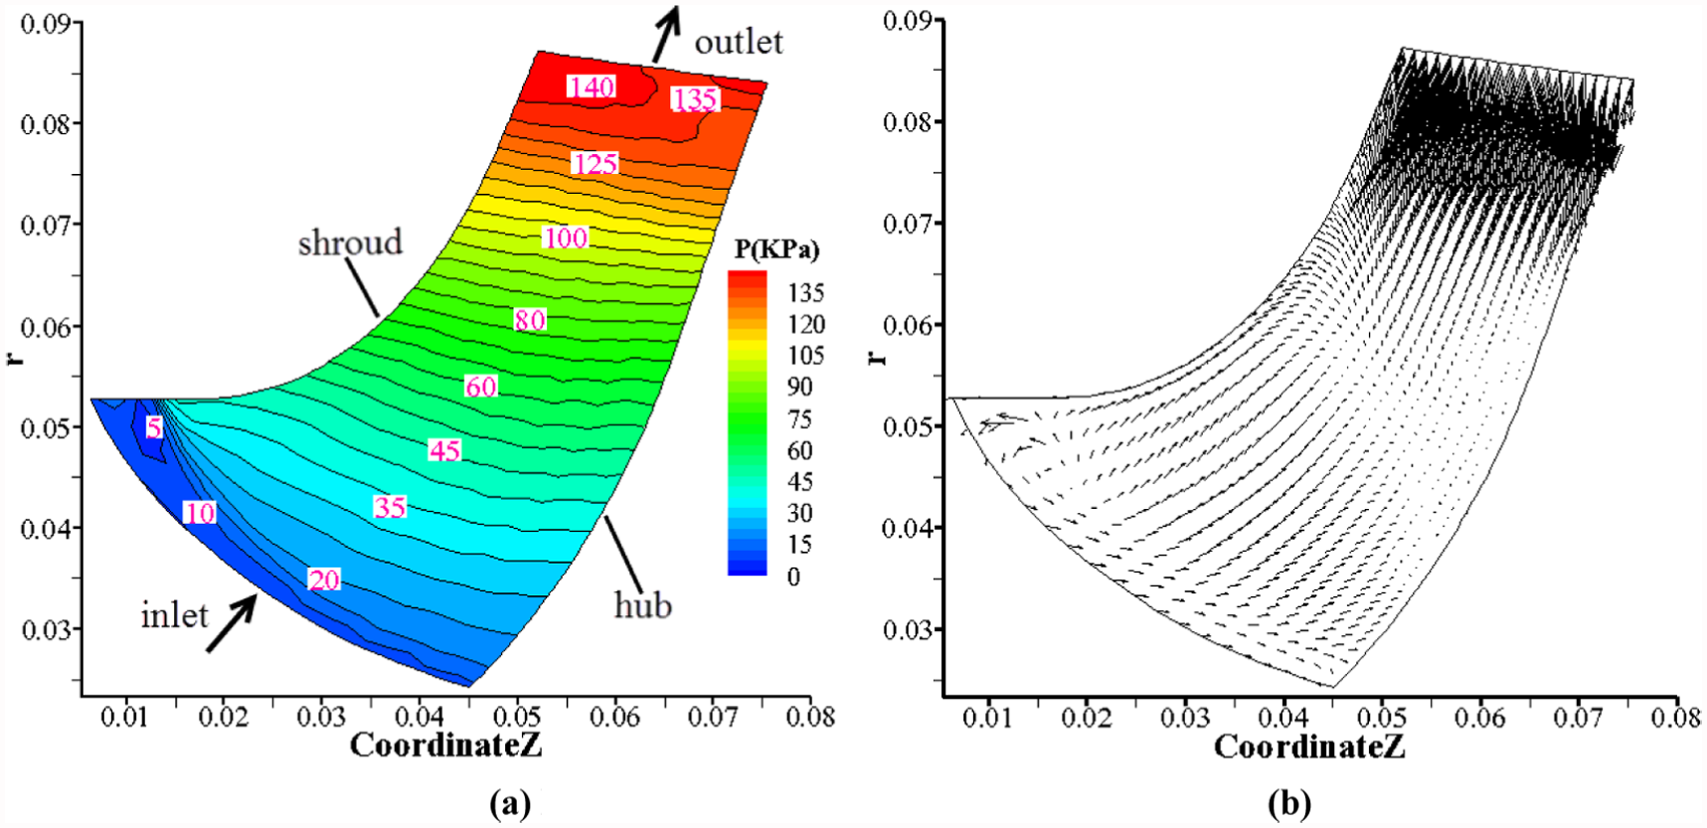
Meridional flow field corresponding to the central hub-to-shroud surface that passes through the vortex center (Q = 0.5Qd): (a) pressure distribution of axial surface and (b) velocity vector distribution of axial surface.
From the above analysis, it is found that due to the special passage design of this low specific speed mixed-flow pump, obvious vortexes will arise in small flow rate conditions at the hub region near the pressure surface. Thus, the generated vortexes will aggravate pressure fluctuation therein. Correspondingly, the pressure fluctuation intensity of the monitoring point P4C at small flow rate conditions will be much higher relative to the design and large flow rate conditions.
Pressure fluctuation in the guide vane passage
Due to the rotor–stator interaction, pressure fluctuation in the impeller and guide vane passages is closely related to each other. The distribution of velocity vector in the interaction region at 0.1 span, when t is 0.298 s, is shown in Figure 12. At small flow rate conditions (0.5Qd and 0.75Qd), vortexes and flow separation occur near pressure surface at the impeller outlet region, which is in accordance with the previous analysis. The vortexes at the impeller outlet region will have impact on the flow in the guide vane inlet region, resulting in the strong pressure fluctuation therein. From Figure 12, it can be observed that impact loss in the guide vane inlet region is the most serious at 0.5Qd condition (see Figure 12(a)), followed by 0.75Qd condition and then 1.25Qd condition. In addition, when impeller blades are close to the guide vane blades, velocity in the vicinity will increase significantly, which is especially remarkable at 0.5Qd condition. In fact, the rotor–stator interaction between the impeller blades and the guide vane blades is the main reason causing the pressure fluctuation in the pump passage.

Distribution of velocity vectors in the interaction region (span = 0.1, t = 0.298 s): (a) Q = 0.5Qd, (b) Q = 0.75Qd, (c) Q = Qd, and (d) Q = 1.25Qd.
Through the post-processing with MATLAB on the result data at all the moments, distribution of Cp in the guide vane passage was obtained according to equation (6). Figure 13 shows the distribution of Cp on the central hub-to-shroud surface of the guide vane passage in four flow rate conditions. It can be seen that the intensity of pressure fluctuation in these four conditions decreases from inlet to outlet in the guide vane passage. The gradient of pressure fluctuation in the inlet region is also larger than in the central and outlet regions, which illustrates that the impact of the rotor–stator interaction on pressure fluctuation in the guide vane passage is attenuated along the flow direction. On the whole, the difference of pressure fluctuation at four flow rates lies mainly in the inlet and central regions of the passage, while the difference in downstream region is small. The descending order of pressure fluctuation in the guide vane is 0.5Qd, 0.75Qd, 1.25Qd, and Qd which is in accordance with the impact strength at the inlet of the guide vane passage. According to the above analysis, the hydraulic design of such pumps should be focused on the rotor–stator interaction region and the guide vane inlet region to reduce the pressure fluctuation. The matching between the impeller outlet angle and the guide vane inlet angle, as well as the distance between the impeller and the guide vane may be two important factors, and this will be our study in the future.
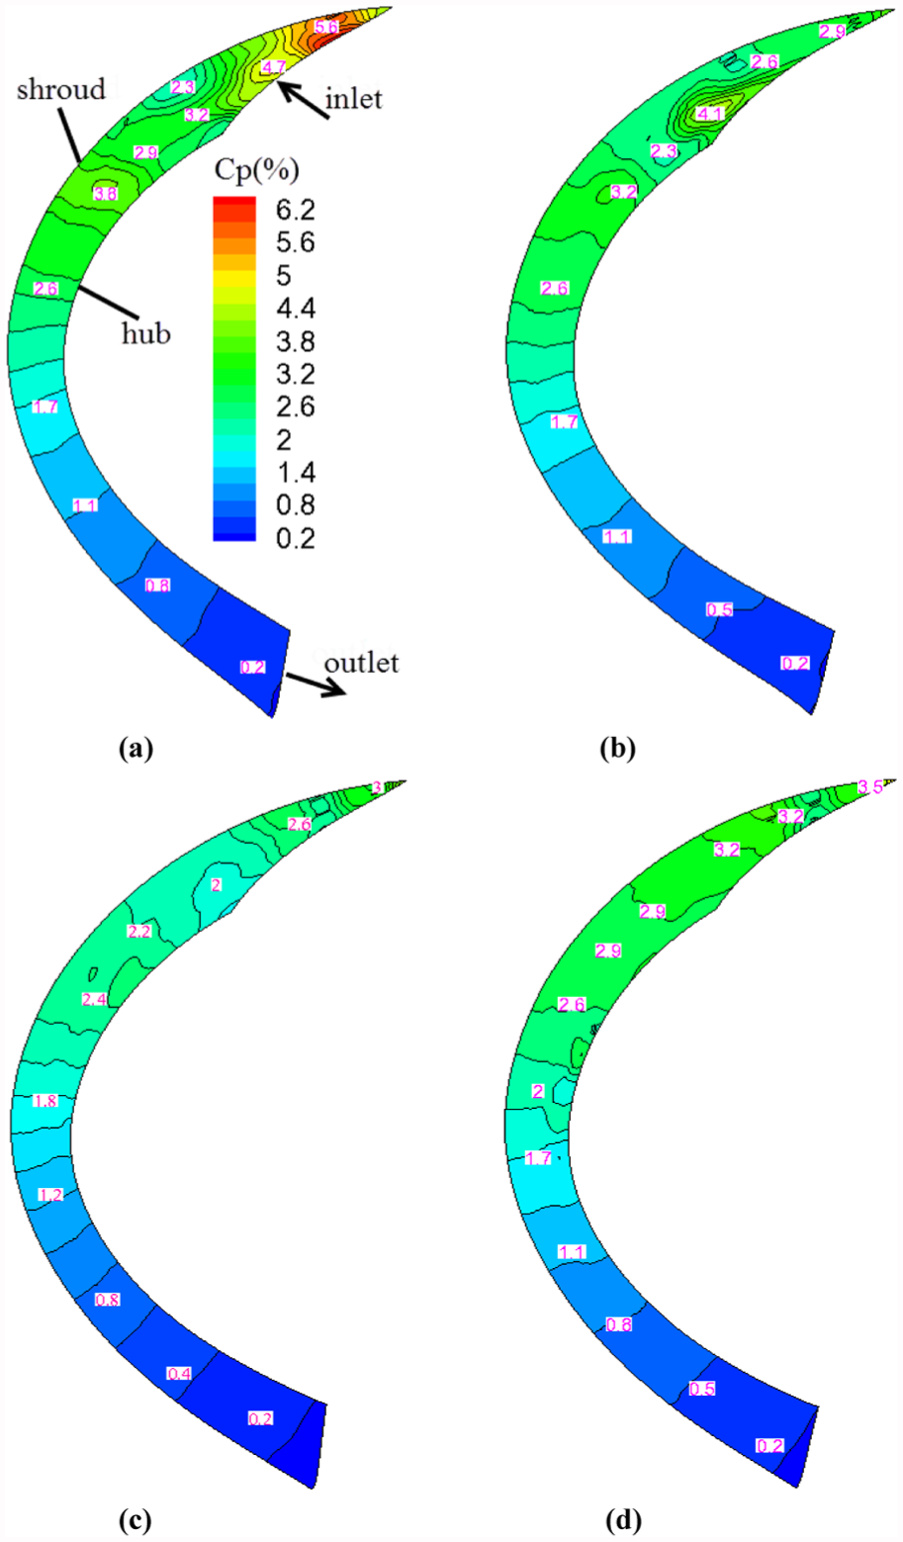
Distribution of Cp on the central hub-to-shroud surface of the guide vane passage: (a) Q = 0.5Qd, (b) Q = 0.75Qd, (c) Q = Qd, and Q = 1.25Qd.
Cp values of the center points of four surfaces in the guide vane (see Figure 5(b)) are listed in Table 4. From Tables 3 and 4, it can be seen that pressure fluctuation in the whole flow passage is enhanced first and then weakened, where the maximum value exists near the guide vane inlet. Generally, pressure fluctuation intensity in the guide vane is higher than that in the impeller, and distribution area of strong fluctuation (defined in this study as Cp > 2%) is also wider in the guide vane, which is directly related to the flow direction in the pump.
Pressure fluctuation coefficients in the guide vane passage (%).

The frequency domain of the pressure fluctuation of point P5C is presented in Figure 14. It can be found that the dominant frequencies of points P5C are all 6fn at four flow rate conditions, which is resulted from the action of the impeller on the guide vane (the impeller blade number is 6). At the small flow rate conditions (0.5Qd and 0.75Qd), relative to the design and 1.25Qd conditions, the amplitudes of the secondary frequency are also greater, and there are more other frequencies, which is similar to the case of the monitoring point P4C, illustrating the flow complexity in the pump at the small flow rate conditions.

Frequency domain characteristic of point P5C.
Conclusion
Through unsteady numerical calculation, the characteristics of pressure fluctuation in a low specific speed mixed-flow pump were explored at four flow rate conditions. The results can be summarized as follows:
Relative to the design and large flow rate conditions, fluctuation is more remarkable at small flow rate conditions, and the fluctuation period is more disordered. Moreover, the amplitude of the secondary frequency is greater, and more other frequencies are accompanied in small flow rate conditions.
Due to the passage design, the low specific speed mixed-flow pump can obtain a wider high-efficiency area, and it also avoids the saddle phenomenon existing in the traditional mixed-flow pumps. Meanwhile, obvious vortexes form at the hub region near pressure surface at small flow rate conditions, and the generated vortexes will aggravate pressure fluctuation therein. In the design and large flow rate conditions, as the velocity in main flow area is larger, the intensity of the vortexes near the pressure surface gets weaker.
At four flow rate conditions, the difference of pressure fluctuation in the guide vane mainly lies in the inlet and central regions, while the difference in the downstream region is smaller. The impact and pressure fluctuation in the inlet region of the guide vane is stronger at small flow rates, which is directly related to the vortexes at the impeller outlet in such conditions.
The pressure fluctuation from the impeller inlet to the guide vane outlet is enhanced first and then weakened, with the maximal value located near the guide vane inlet. So, the hydraulic design of such pumps should be focused on the rotor–stator interaction and the guide vane inlet regions to reduce the pressure fluctuation. Besides, the pressure fluctuation intensity in the guide vane is higher compared to the impeller, and the distribution area of strong fluctuation is wider.
Footnotes
Appendix 1
Academic Editor: Pietro Scandura
Declaration of conflicting interests
The author(s) declared no potential conflicts of interest with respect to the research, authorship, and/or publication of this article.
Funding
The author(s) disclosed receipt of the following financial support for the research, authorship, and/or publication of this article: This work was supported by the National Natural Science Foundation of China (nos 51579006 and 51679122).