
Abstract
Increase velocity in omnidirectional (INVELOX) is the wind power transporting system, which is suitable for providing the maximum wind energy for better maneuver of wind turbine. This venturi has innovative features that are accomplished for functioning the integrating multiple wind turbine generator system, capture the wind flow through the omnidirectional intake and speed-ups the flow across the venturi region that is release into ambient environment through diffuser. In this study, INVELOX model 1 and model 2 are designed for investigation of pressure and velocity contours. Power output of turbine depends on pressure and velocity of wind. The venturi section result specifies velocity and pressure drop of both models of INVELOX; velocity of model 1 and model 2 increases from 10.42 to 45.5 m/s, respectively. Pressure drops transpire in model 1 and model 2 which decrease from
Introduction
The utilization of renewable energy is essential to overcome energy demand of country. The wind conversion system has established for more than 3000 years. Due to energy crises and higher demand, many wind turbines have introduced rapidly all over the world in the last three eras. Many researchers have presented new model for capturing wind power for the wind turbines to enhance the performance of wind turbines. 1 A new concept of increase velocity in omnidirectional (INVELOX) is presented for wind transport system, which is appropriate for wind power utilizing. INVELOX has innovative features for capturing wind for operation of integrating numerous wind turbines in the venturi sections. Passive and active yaw control is not required for orientation of wind turbine. It accelerates torrents of wind that passing through venturi unit, which expands and releases to ambient atmosphere over diffuser. When two or three turbines operate in venturi unit, second and third turbine shows less potential than first turbine power conservation. However, modified design venturi shows that it is potential wind turbine using multistage turbine is higher.2–4 It is testified that wind energy can be captured and accelerated through INVELOX, can be increased wind speed by factor 2 or 3 as a result in power output increasing by factors 4–8. COMSOL is modern computational tool to design model and analysis of INVELOX system. 5 Numerical simulation and analysis of INVELOX wind turbine system have executed to find its advantages in terms of power generation of traditional turbines. The INVELOX attained 11.9 m/s wind speed at venturi section that is 6–8 times more power than traditional wind energy. The INVELOX system produced more power as compared to traditional wind turbines. 6 The funnel-based wind power capturing system developed with propeller blade having diameter of 7 cm that coupled with generator for producing power. Power is produced from 0.0001 to 9.93 W within scope of velocities limits at funnel inlet as 0.5–7.89 m/s. 7 Omnidirectional intake duct of wind power system was developed and investigated flow characteristics using computational fluid dynamics (CFD). Omnidirectional intake duct to horizontal axis provides improvement in wind power but it is very difficult to predict accurately the amount of increase power. Three-blade wind turbine is be inserted in intake system of INVELOX, which develop pressure drop on pressure side and suction sides. The results indicate the range of 1.5–6.7 m/s. 8 The objective of this article is to enhance power output of wind energy with effect of design modification on output wind velocity. The design developed on SolidWorks and flow simulation conducted through ANSYS Fluent software. Finally, output wind velocity is achieved two time than input velocity. 9 The INVELOX is a new concept for capturing wind from all directions and measured data confirmed that wind captures in 360°. Turbine performance was enhanced from 300 to 3600 W due to amplified wind speed and higher power coefficient when turbine was mounted in the venturi section of INVELOX. 10 INVELOX is better solution for optimizing efficiency in commercial renewable power generation implementation. It has better architecture design that can be mounted at ground level applications. 11
The aim of this work is to analyze the execution of wind capturing structure when multiples turbines installed in the venturi unit. It is possible to increase the wind power for operating multiple wind turbines and to enhance the total power output of the system. 2 Inlet area and venturi cross-sectional area shows significant effect on speed ratio. Appropriate selection of geometry of INVELOX and velocity increment up to 1.9 m/s is attainable. INVELOX decreases tip speed ratio and increases turbine maximum power coefficient. 12 It was described that a novel ducted turbine designed for induction wind power for commercial or residential application. A mathematical model introduced for prediction the flow mechanism inside the tower and a velocity coefficient is measured a definite value at different test conditions. It was special design for elimination of wind tower promising solution for commercial and residential application. It provides better power output due to pressure difference created by surrounding environment. 13 It was investigated that suction flow rate from funnel to provide highest velocity output. Conservation of mass and momentum principle has been used for solving resulting equation numerically. 14
It was investigated that the blades of small wind turbines start rotating at the lowest potential wind speed. Horizontal wind axis turbine having diameter of 2 m with three blades was tested under test chamber for quasi-steady blade element analysis. Analysis of rotor acceleration was carried out under large range of wind speed and interpolated airfoil data and generic equation for lift and drag at large angle of incidence. Based on the blade element calculations, it was suggested that the starting torque is produced near the hub, but more power-generating torque comes from the tip region. 15 It was revealed that new wind energy capturing design was developed for omnidirectional wind flow and thereby not required for passive and active yaw mechanism. 16 The aim of this work is that transformation of wind power is organized by two key factors: first one is free stream wind speed and second one is blade radius. These two design parameters diminished the blade sizes and tower height in conventional systems. In this study, both computational and test results measured are described. 17 The main problem was to eliminate tower-mounted turbine that is the fundamental innovation of multiple wind turbines. In this study, analysis of INVELOX presented in which mass flow rate at first turbine is high as compared to second and third turbines in venturi duct. The velocity drop occurs at exit of first turbine and the entrance to second and third turbine. The stream of kinetic energy is used to operate the turbine safely at ground level. 4 It was described that fluid stream in and around INVELOX is increasing capability of wind capturing. CFD analysis was carried out at different configurations of intake system for generating more power for commercial wind turbine. 18
This work is segmented into four sections. In section 2, methodology is discoursed. In section 3, result and discussion is deliberated. In section 4, whole work is concluded.
Methodology
In this section, basic steps in designing and simulation process of INVELOX are described with the effect of intake hopper in model 1 and vertical axis wind turbine (VAWT) in model 2.
Modeling
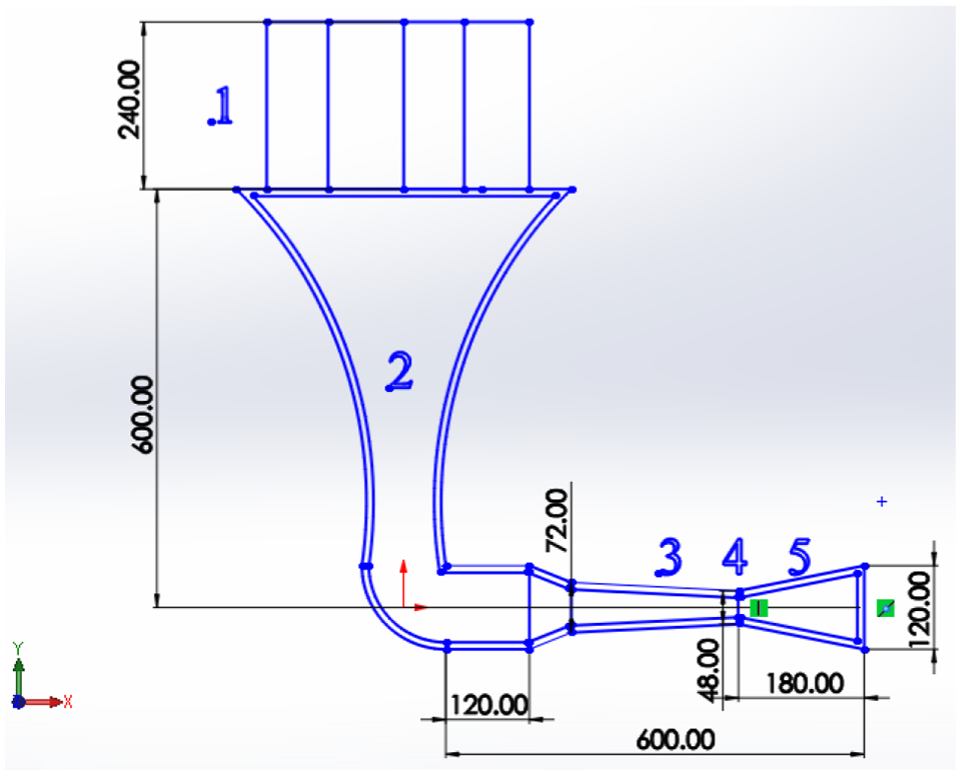
Solid model of INVELOX is designed in SolidWorks according to size and dimensions of INVELOX model 1, and its geometry is imported to ANSYS for fluent analysis. It has two sections: (a) intake hopper and (b) converging section. The converging section consists of a funnel, bend, and venturi section. Figures 1–3 show complete model 1. Figure 4 indicates complete geometry of model 1 with dimensions.

Intake hopper.
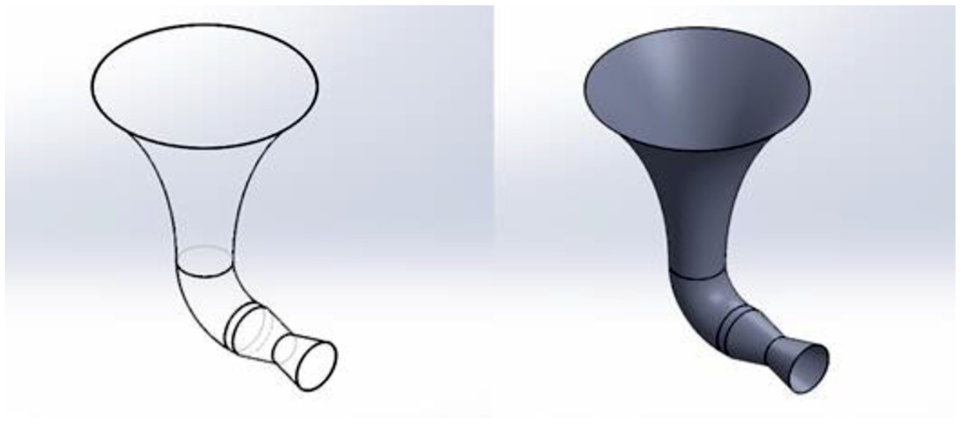
Funnel and venturi of model 1.

Complete design model 1.

Design dimension of model 1.
The combination of VAWT blade and propeller fan is introduced in the intake system of INVELOX model 2 instead of intake Hooper. Design of VAWT blade is presented in Figure 5.

Vertical axis wind turbine (VAWT) blades.
Propeller fan is directly attach with shaft of VAWT so it takes power from VAWT and rotates which creates a pressure drop ahead of its blades so more wind is pushed toward the inlet of INVELOX system, as shown in Figures 6 and 7.

Propeller fan.

Complete design model 2.
Wind velocity is increased at inlet of INVELOX system with installation of VAWT blades and propeller fan and further increase the length of throat, to get more wind velocity at venturi section (Figure 8).
Design dimension of model 2.
Analysis
CFD uses different algorithms and numerical techniques to obtain valid solution and to evaluate the problem that comprises fluid flow. Modeling through CFD is based on elementary equations of fluid dynamics:
Conservation of mass;
Conservation of momentum;
Conservation of energy.
CFD simulation process takes several processes that are involved in the examination of the fluent flow in INVELOX duct.
Pre-processor
In pre-processing of ANSYS Workbench, geometry of model can be described in the best possible way in which to establish the fluid domain of interest (Figure 9). This domain is further subdivided into smaller areas, called as mesh generation step.

Interface of Workbench.
Solver
ANSYS Fluent software is used to identify fluid material properties as flow physical model, and boundary conditions are adjusted to determine fundamental equations related to flow physics problem using a computer.
Post-processor
CFD results are analyzed with various methods as vector plots, contour plots, data curve for suitable graphical illustrations, and report. Preprocessing is defining the geometry to define our domain of interest. Domain of interest is divided into segments called mesh generation step and problem is setup to defining the boundary condition, we solve it with CFD solver.
Boundary conditions
In the modeling, it is developed right rectangular prism around the 3D model which to make approximate boundary condition. It is extruded in such a manner to create an envelope around 3D model and then generate it. It is created Boolean to separate entities (rectangle prism and 3D object) and subtract 3D object from the right rectangular prism to develop cavity for the object under analysis.
Meshing
It is a very essential step to adopt the optimum mesh number and size for acquiring accurate results with least computational time and suitable outcome with lowest error in the solution (Figure 10). Most important part of CFD model is to describe sections: (a) inlet, (b) outlet, (c) walls, and (d) INVELOX.

Suitable condition.
Application of boundary conditions
It is the third step for performing specific analysis in which all the physical values and conditions are given (Figure 11). Select the following options: (a) double precision and (b) serial. Apply the condition in solver.
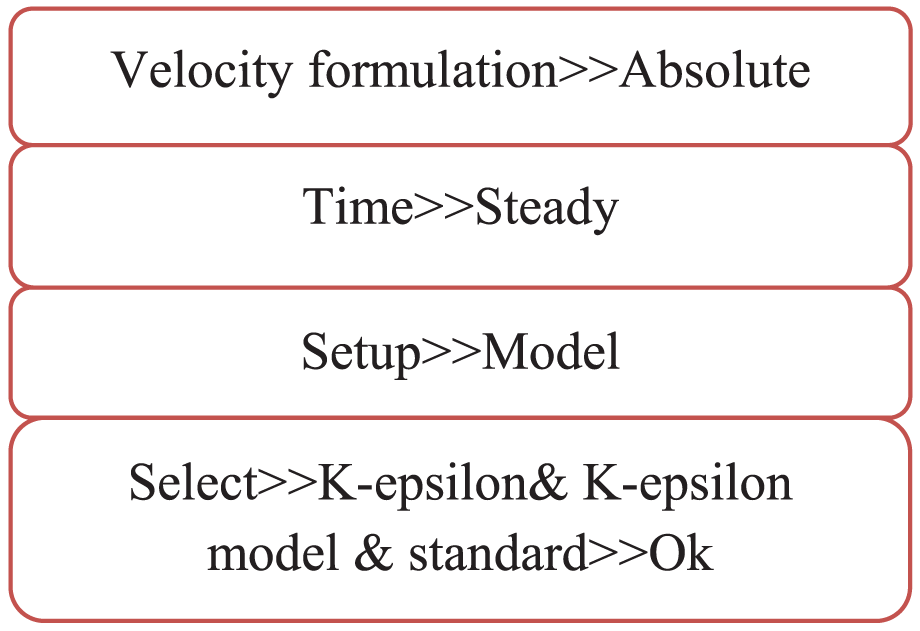
Select pressure based model.
Select air and apply fiberglass properties, then apply cell zone conditions. Apply inlet boundary conditions (Figure 12).

Inlet boundary conditions.
Apply outlet boundary conditions (Figure 13).

Outlet boundary condition.
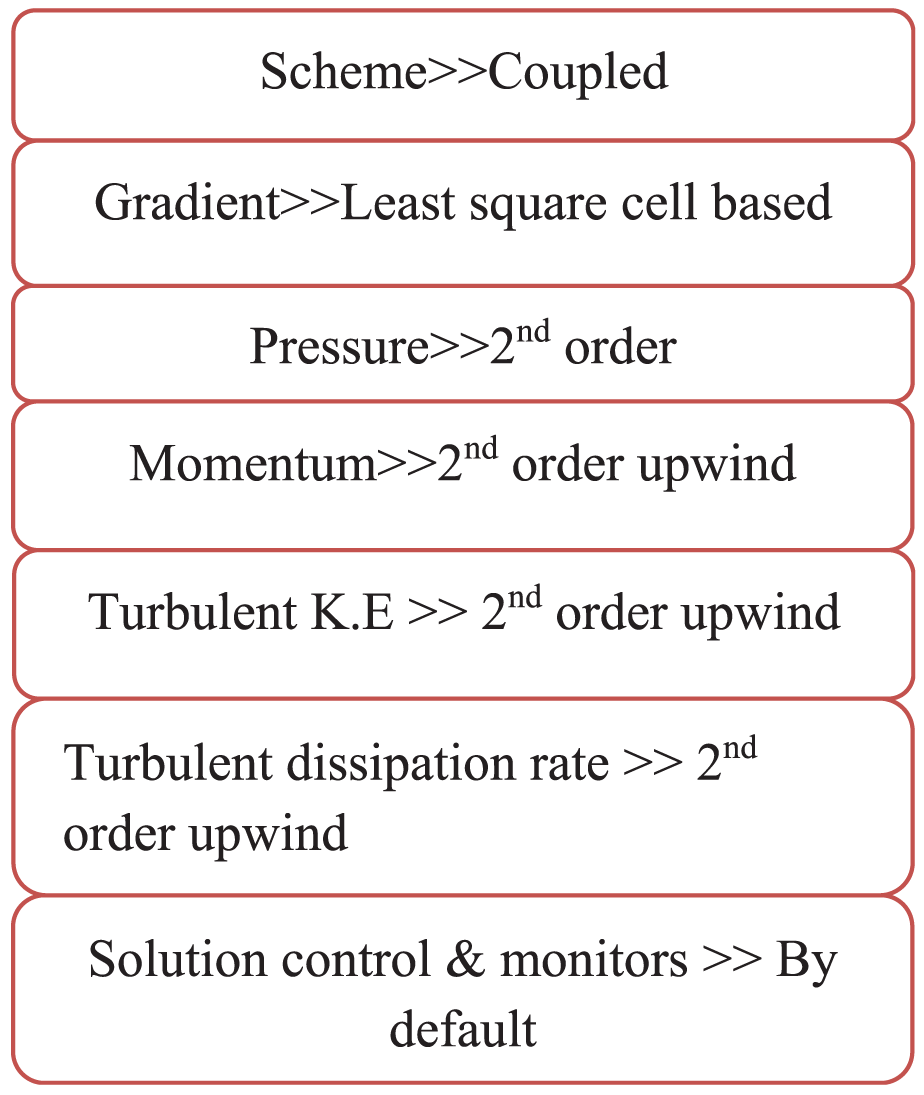
Solution
After meshing, it is important step to acquire solution of model with suitable conditions (Figures 14 and 15).
Solution boundary.

Solution initialization.
Results and discussion
Meshing of models 1 and 2
The mapped meshing is developed on entire domain. It is smooth and fine in some regions away from the duct using ANSYS Workbench 16.0. Triangular type medium size elements are developed for better accuracy of results. Meshing of models 1 and 2 are shown in Figures 16 and 17, respectively.
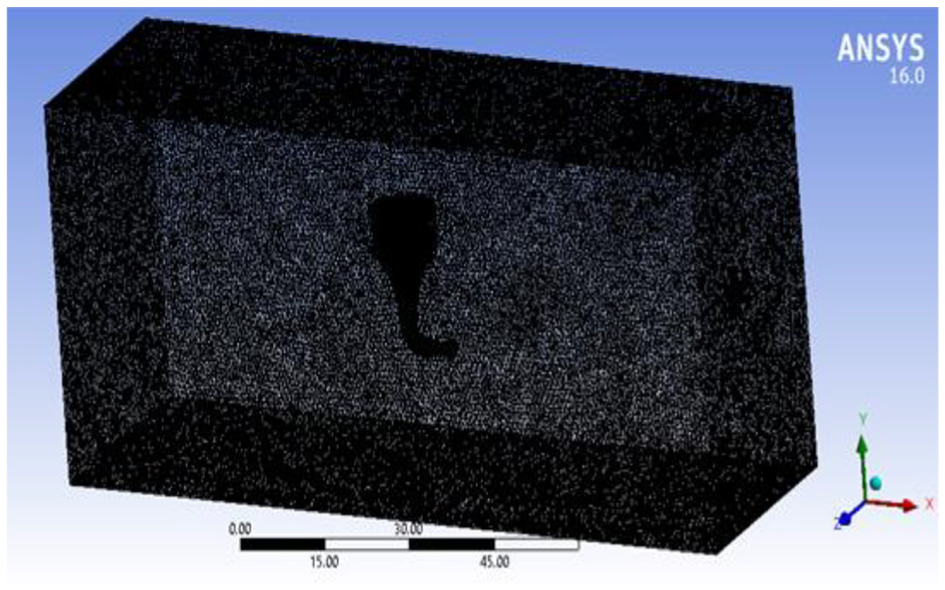
Meshing of model 1.

Meshing of model 2.
Velocity distribution
The velocity profile of model 1 is obtained by inlet free stream velocity of wind. The velocity contour plot at intake and venturi section of INVELOX shows 6 and 10.42 m/s, respectively, as shown in Figure 18.

Velocity profile of model 1.
Velocity of wind is analyzed for both models with same cut-in speed of 6 m/s. VAWT and propeller fan are installed in model 2 instead of hopper (Figure 19). Free and forced stream flow of wind are visualized almost 6.6 m/s at point 2 of model 2. By increasing the length of venturi section of model 2, it shows the increase velocity of wind at throat section. Velocity contour indicates velocity profile of wind throughout INVELOX section (Figure 20). Velocity contour indicates velocity profile of wind throughout INVELOX section (Figure 19). Wind speed is obtained 45.5 m/s at throat section of venturi in model 2.

Velocity profile of model 2.

Comparison of INVELOX.
Velocity comparison
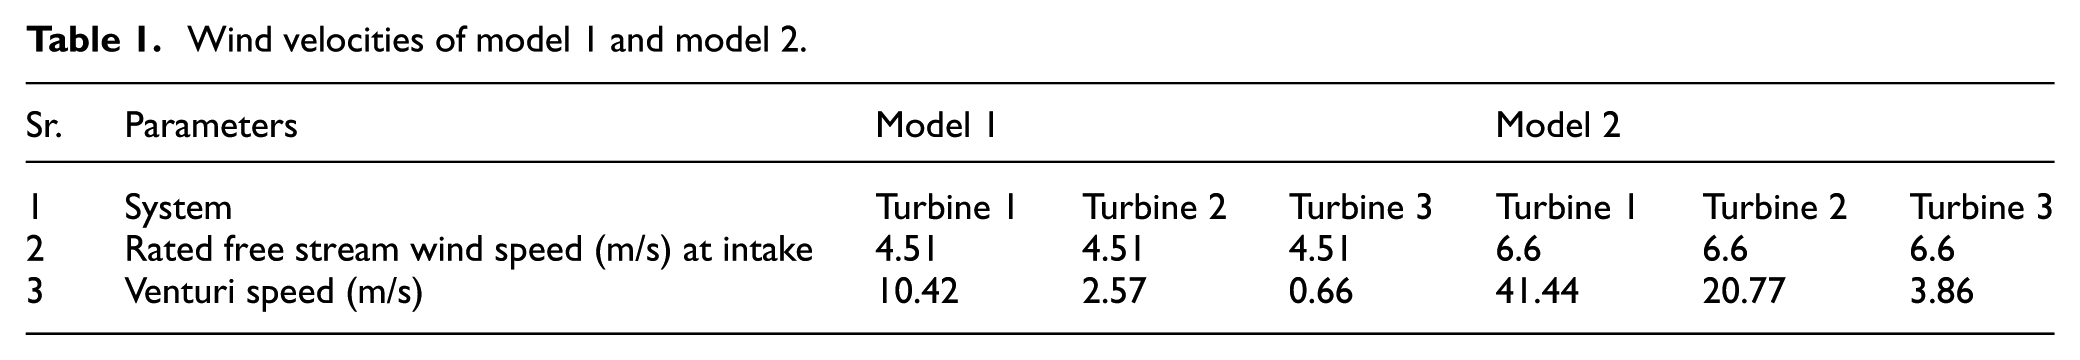
Simulation results of INVELOX indicate wind speed of 10.42 m/s for model 1 and 45.5 m/s for model 2 at throat section of venturi. It is proposed to install the number of horizontal axis wind turbine (HAWT) for both model and calculate wind speed using mathematical relation at different positions of INVELOX for operating turbine, as shown in Table 1, which gives comparative data of both model but model 2 gives better results. In model 2, the velocity of wind increased up to 41.44 m/s on the first HAWT installed in a throat. Similarly, on second HAWT, it is increased up to 20.77 m/s and on third HAWT, it increased up to 3.86 m/s.
Wind velocities of model 1 and model 2.
Pressure distribution
Pressure distribution of model 1
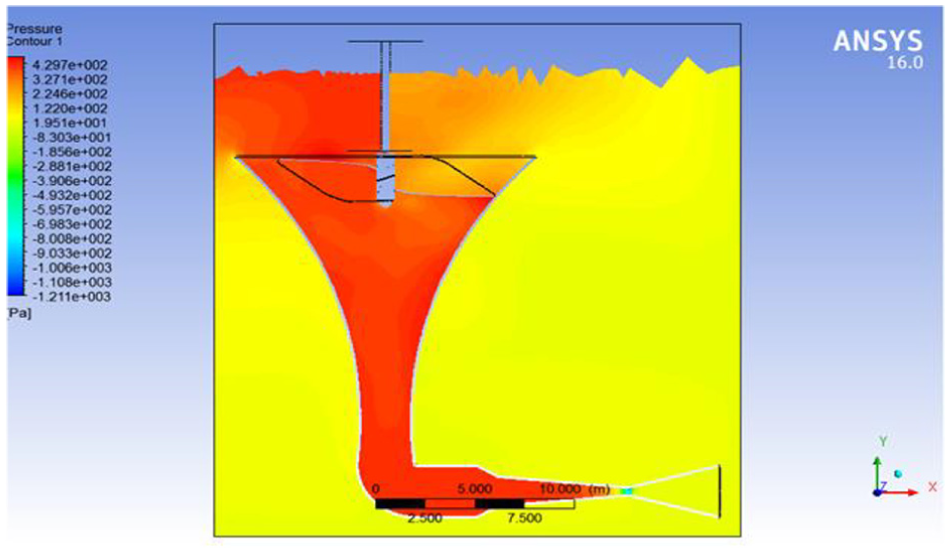
An INVELOX has converging and diverging section but throat occurs in between both sections. Throat is used to optimize and regulate speed of air, as a result pressure drops occur. The convergent part of nozzle starts larger area and end at smaller cross-sectional area. As a fluid enters, the smaller cross-sectional area is to accelerate wind speed, which obey conservation of mass. To maintain a constant amount of fluid moving through the restricted portion of the nozzle, the fluid must move faster. The energy occurs due to random motion (kinetic energy) of molecules when fluid speed enhances through venturi section as result to decrease pressure. The energy in this random motion is converted into faster forward motion, known as stream flows which lead to the pressure drop. The pressure profile indicates static pressure of complete model of INVELOX as power generation system. Pressure drops occur at throat of venturi of model 1 as shown in Figure 21. It is observed that pressure drops occur in model 1, which is

Pressure distribution of model 1.
Pressure distribution of model 2
At the inlet of model 2, wind speed increased due to installation of VAWT as compared to model 1. Second modification was to increase the length of throat, as result to increase pressure drop at throat in model 2, which gives better performance. Pressure drops occur in model 2, which is
Pressure distribution of model 2.
Theoretical framework for model 2
General form of Bernoulli’s equation is written as follows:

Equation of continuity at points 2 and 3 is as follows


Equation of continuity is as follows

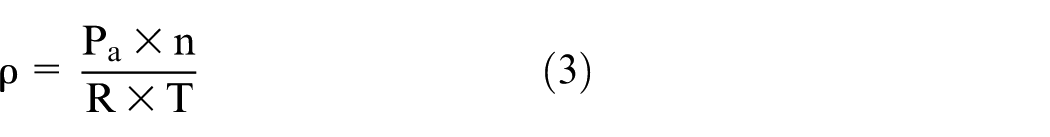
Density is as follows

Wind power calculated at point 2 of system is as follows


1. Proposed first turbine
Wind power calculated at venturi section point 3 (first turbine) is as follows

2. Proposed second turbine after point 4
Diameter of duct at point 4 (D4), It is considered that velocity decreases 1/3 after hitting the first turbine

where V4 is downstream velocity.
Area of second turbine (A4) is as follows
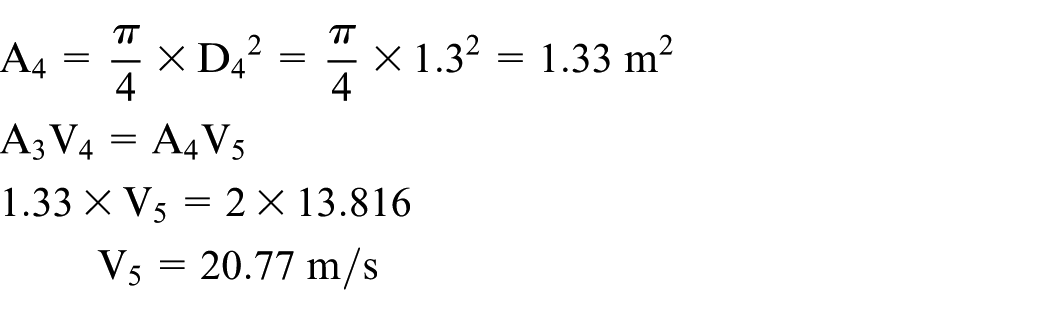
where V5 is upstream velocity of second turbine.
Wind power at proposed second turbine after point 4 is as follows

3. Proposed third turbine at point 5
Diameter of duct at point 5 (D5), It is considered that velocity decreases 1/3 after hitting the first turbine

Area of third turbine A5 is as follows

Wind power at proposed third turbine at point 5 is as follows

Therefore, the total theoretical power at venturi is

Actual Power: The ducted turbine has an estimated Cp of 0.41

Velocity and power output comparison
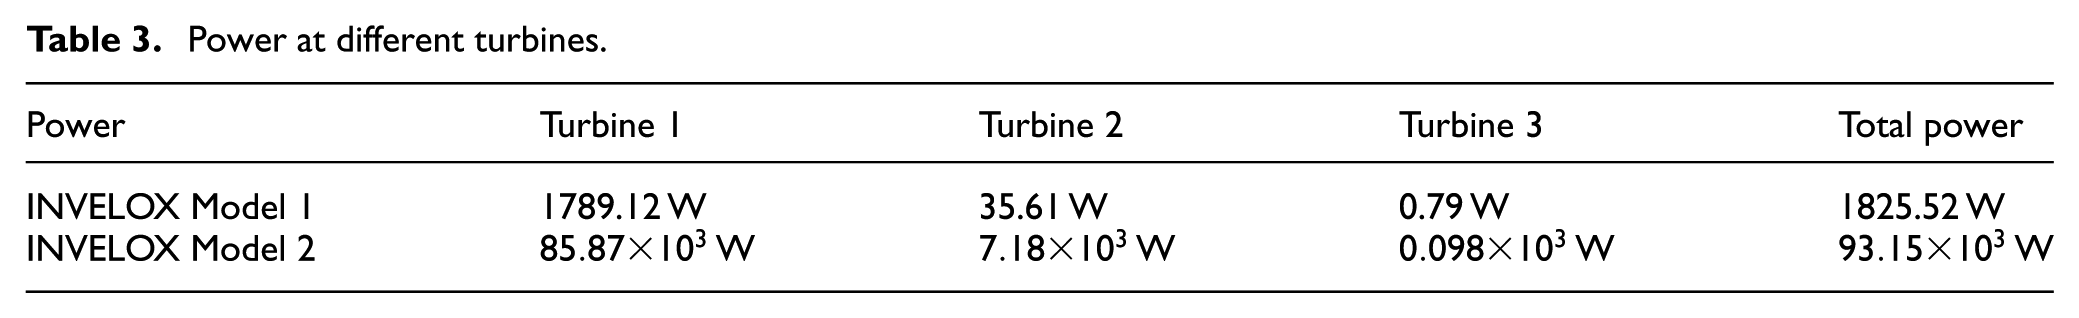
Upstream velocity of turbines is shown in Figure 23 and Table 2 and power at different turbines is shown in Table 3.

Upstream velocity of turbines.
Upstream velocity of turbines.

Power at different turbines.
Summary and conclusion
It is observed that power generated from INVELOX system can be enhanced by model 2. For maximum power generation, there are two principles to optimize the power generation in the wind turbine, which are as follows: (1) increase the mass flow rate of air and (2) increase the pressure drop across the turbine. After analysis, it is concluded that
Diameter of venturi at throat decreases from 72 in in model 1 to 48 in in model 2.
Wind velocity increases from 10.42 to 45.5 m/s at venturi section that can be visualized through simulation results.
Upstream velocities are calculated using mathematical relation for operating turbines.
Pressure drops occur in model 1 and model 2 which decrease from
The significant increase in total power of model 2 as compared to model 1 occurs. Total power output is calculated using mathematical relations, which are 1825.52 W for model 1 and
Footnotes
Acknowledgements
The authors are very grateful to Department of Mechanical Engineering, COMSATS University Islamabad, Sahiwal campus and Energy Research Centre, COMSATS University Islamabad, Lahore Campus for providing us opportunity to carry out this work.
Handling Editor: Pietro Scandura
Declaration of conflicting interests
The author(s) declared no potential conflicts of interest with respect to the research, authorship, and/or publication of this article.
Funding
The author(s) received no financial support for the research, authorship, and/or publication of this article.