
Abstract
Old town fringe area refers to a surrounding zone of an old town. The fringe undertakes the important function of evacuating traffic volume between suburb districts and central city. Traffic flow and travel behavior of the old town fringe are complex and different from other areas. Thus, recognition of fringe area is of importance for researchers to better understand the unique travel features and propose proper policies for fringe renewal. This study took the city of Nanjing as an example and fused the residents’ travel survey data and the point-of-interest data for fringe recognition. The study estimated the travel intensity of each travel analysis zone per day. The mutation point of travel intensity was decided to divide the fringe. The point-of-interest data was used for validating the boundaries of the fringe. The fusion of the two data sets jointly decided the core old town fringe area. The travel behavior characteristics of the fringe area, including the fringe internal trips, crossing fringe trips, and those with only origin or destination in the fringe, were then evaluated and policy suggestions were provided. The findings of the study will benefit the urban space planning and coordinated transportation system development in the fringe area of old towns.
Introduction
Old town fringe area performs a role of connection and transition between an old town and suburban districts. It undertakes the important function of transfering traffic flow between the two districts.1,2 Traffic flow on the edge of the old town is more complex than that in the old town, which can be seen in road networks, origin–destination (OD) demand features, personal travel behavior, travel distribution, and external factors. It plays a vital role in many aspects including the exploration of travel patterns, OD demand analysis, traffic flow modeling, and analysis. 3
Traffic features within the old town fringe are very different from other areas. 3 For example, the OD demand within the old town fringe is very diverse—in addition to those with the origin and destination within the fringe, there are huge crossing traffic demand from/to old town and suburban areas, causing considerable traffic jams.4,5. In addition, road infrastructures within old town fringe are not updated in a fast way, resulting in a relatively low road density and connectivity. 6 The passage between three areas—(1) old town, (2) old town fringe area, and (3) new town—is hard to satisfy the traffic demand of long-distance transit traffic, which might contribute to a series of traffic jams. As a result, travel distance, purpose, and travel mode within fringe are very different from others. A study particularly focusing on the modeling and analysis of travel characteristics of old town fringe is very important for better travel-related policy makings and infrastructure-related renewals.
To analyze the complex travel features of old town fringe, the first and most critical step is to recognize such area. The most commonly used previous method is based on researchers’ experiences and judgments. For example, some early researchers used 50 km as the radius to divide the fringe edge, which clearly contains many issues—no universal standard can be used to judge such edge for different cities. There is no uniform standard in quantitative identification of marginal areas. In addition, the measured index varies in different researches. Some Indian scholars selected the aggregation index and the suburbanization index to define the marginal area. Later, some Canadian scholars screened the proportion of non-farm people to determine the boundaries of marginal areas by a census. Chinese scholars conducted research in various aspects including economic statistics of social GDP,7,8 the population data, 9 land usage data which is extracted from the Color TM composited image map,10–12 and so on. Such indexes only reflect the physical or economic features of the city areas, but ignore the characteristics of travel behaviors, habits, and their relations with the urban land uses. Thus, such methods have clear limitations for old town fringe recognition.
In our study, we used the household travel survey data for the recognition of old town fringe which has not been done before. Some scholars in the United States have studied the relationship between urban environment and traveling behavior based on travel data, which confirm that the spatial structure in urban has a great influence on commuter traffic.13,14 Later, by block analysis, some scholars tried to establish the relationship between urban space and travel characteristics in small urban units. For example, Bagley and Mokhtarian 15 selected five blocks and built a model in order to find the relationship between block type, travel behavior, and residents’ lifestyle. Schwanen and Mokhtarian16,17 further explored a more complex relationship between community types, travel choices, and commuter patterns. Using travel survey data for fringe area recognition can reflect the inner impacts of urban spatial features on travel behaviors. In the meantime, considering the survey data may be limited by the sample size; to improve the fringe recognition accuracy, we introduced another data set, which is the point-of-interest (POI) data extracted from the Baidu Map. There are several advantages related to the POI data: (1) data sample size is very large; (2) data can be obtained freely from Internet; (3) data contains rich interest information such as living, commercial, entertainment, transportation, and culture; and (4) location of POI contains accurate longitude and latitude information. It is believed that the POI features within the old town fringe are different from others. However, none of previous studies have applied the POI data for old town fringe recognition.
The primary objective of the study is to propose a multi-source data fusion framework for the identification of old town fringe areas. Household survey data, and POI data in Nanjing, China, are obtained for fusion and analysis. After identifying the fringe area, travel behavior characteristics within or crossing the fringe area are explored. Policy suggestions for old town fringe planning and renewal are discussed.
Data
Household survey
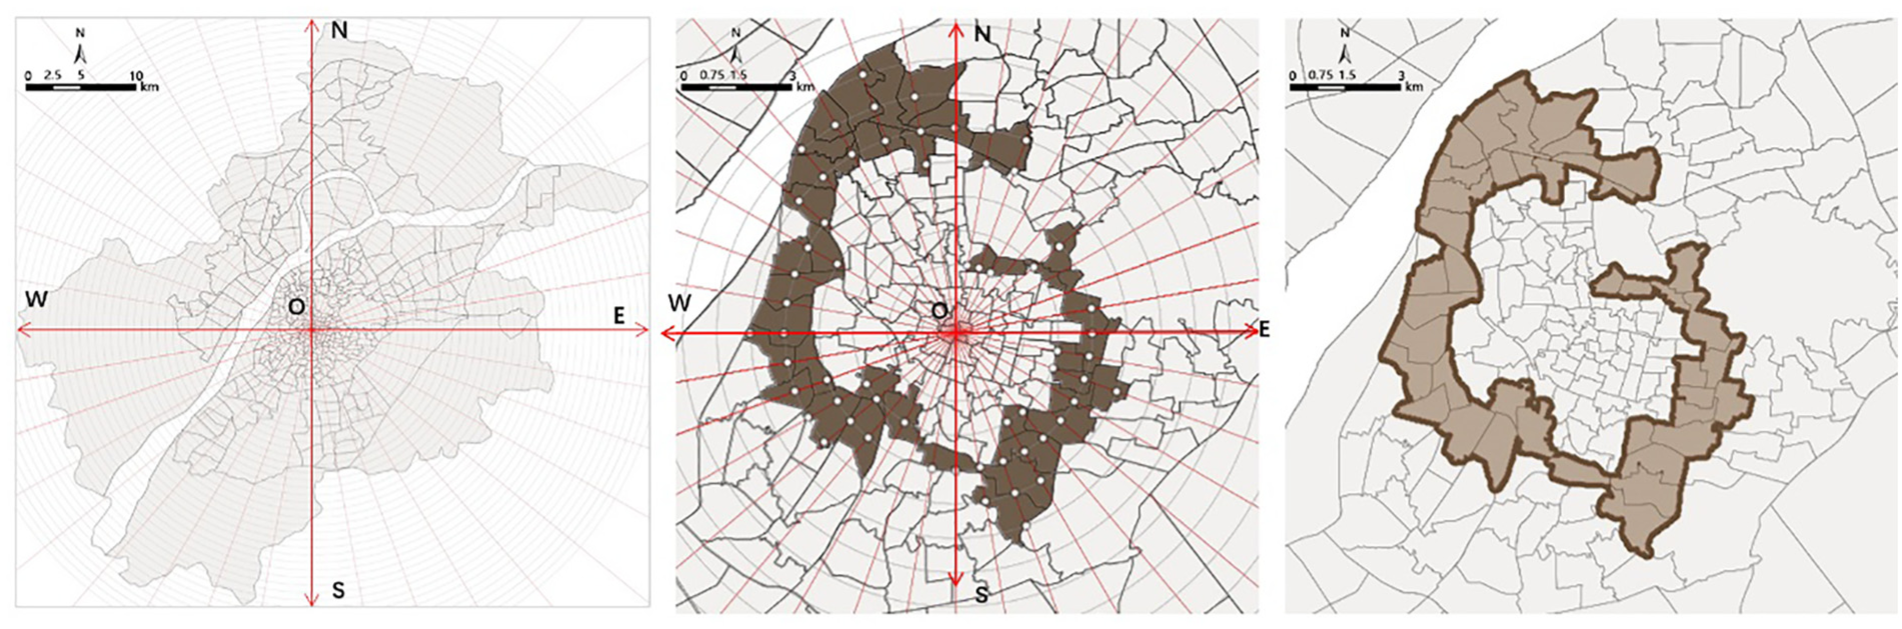
This study employs data obtained from the household survey in the city of Nanjing, China. Nanjing is the capital of Jiangsu Province, consisting of 11 districts, located in the east of China. The scope of this study is in the main urban area of Nanjing (see Figure 1), including three districts in the central urban area (i.e. Xuanwu District, Gulou District, and Qinhuai District), two districts near the fringe of the central urban area (i.e. Yuhua District and Jianye District), and three suburb districts (i.e. Jiangning District, Pukou District, and Xianlin District) outside of the urban area. The area covered by this study is about 2964.24 km2. The study area contains 182 traffic analysis zones (TAZs).

Spatial information of the study area.
The household survey was conducted by Nanjing government on a typical weekday. The survey included two parts: (1) individual and household characteristics; and (2) travel information of all travels in the whole day. A sample survey was conducted among residents in the study area. In total, 31 streets were sampled from each TAZ in the urban area and 5 streets were sampled from the suburb area. Questionnaires were randomly distributed to residents. The household survey obtained a total of 14,586 travel records while 2000 households were sampled and 5391 people were surveyed. Samples with the following issues were excluded from further analysis: (1) cases of missing key information (such as trip mode or trip purpose); (2) cases of origin and destination (OD) mismatching between the record and the TAZs in the study area; and (3) cases have data type errors, format errors, and scope errors. Totally, 12,236 samples were obtained after the data selection, with 9947 records from urban districts and 2289 records from suburb districts.
The travel records were divided in to three types based on the location of trip origin and destination related to old town fringe area, as shown in Figure 2:
Internal travel: the location of trip origin and destination both fall within the old town fringe area, and the travel route is within the fringe area.
Origin or destination travel (i.e. “O-travel or D-travel”): the location of only one end point (i.e. travel origin or destination) falls within the old town fringe area. This study has classified them in two kinds: the O-travel (i.e. the origin is in old town fringe area while the destination is outside old town fringe area) and the D-travel (i.e. the destination is in old town fringe area while the origin is outside old town fringe area).
Crossing travel: the location of travel origin and destination both fall out of the old town fringe area, and the travel route crosses the old town fringe area. This study has classified them in two sorts: the inward travel (i.e. the destination is in the old town) and the outward travel (i.e. the origin is in the old town).

Schematic diagram of travel type and travel structure.
The descriptions of the independent variables are shown in Table 1. The variables include the individual characteristics (such as gender and age) and the travel characteristics (such as travel mode and travel purpose). In the survey, travel length was not calculated, for people generally had no ideas about the length of their travels. Instead, travel time is recorded.
Description of individual characteristics and travel characteristics.

POI from Baidu Map
This study obtained the POI data of Nanjing from the Baidu Map website. POI data are discrete points with spatial coordinates and properties. The agglomeration features of various POI spatial distributions indirectly reflect the distribution features of various public service facilities in urban space. The spatial distribution difference of POI density can reflect the difference of development level in different regions. The POI data generally contain 13 different types, covering business, residents, sports and recreation, administration services, and so on.
The process of obtaining POI data is divided into following four steps: (1) to inquire the location of the administrative boundary of Nanjing, the whole Nanjing area is divided into several unit grids, labeling as the geographic location information of each grid. (2) Log in to the API of Baidu Web service; enter the location retrieval service (place API); then, select the rectangular area Retrieval tool to import the geographic location information of a single grid. (3) Python code is written for the requirement in Baidu API in order to obtain POI data within each cell grid. (4) Through geographical calibration and data aggregation, the whole of Nanjing’s POI data is integrated.
Through the coordinate system transformation and the spatial registration, a total of 228,278 POI data were successfully obtained in this study. The POI data used in this study covered eight administrative districts in the main urban area of Nanjing in terms of spatial distribution, which was the same as the scope of the household survey. The number of POI data of each category and their proportion in the total data are described in Table 2. Among them, business is in the major POI accounting for nearly half, followed by traffic facility, science, and education. Nuclear density analysis was conducted to show the clustering degree of various data points. In such manner, the distributions and spatial structures of various facilities in the main urban area can be discovered.
Description of Baidu POI data characteristics.

Methodology
Framework
The methodology framework in the study contains two components (see Figure 3): (1) old town fringe boundary recognition and (2) travel characteristic analysis. In the boundary recognition, the travel intensity of each TAZ was calculated based on travel survey data. Then, the old town fringe boundary was recognized preliminarily according to mutation point analysis. Meanwhile, Baidu POI data were utilized to conduct kernel analysis and mutation point analysis so that old town fringe boundary was identified. Finally, the old town fringe boundary based on travel survey data was compared with the boundary based on Baidu POI data and thereby the more reliable boundary was determined eventually.

The framework of the study.
In travel characteristic analysis, old town fringe–related travels were classified into cross travels, internal travels, and OD travels according to spatial distribution of origins and destinations. In addition, travels also were divided into commuting travels and non-commuting travels according to travel purposes. The number, travel time, travel distance, travel mode, and OD distribution of different types of travels were investigated. Thus, traffic development countermeasures were proposed and conclusion was drawn.
Calculating spatial distribution of travel intensity
Compared with other regions, the old town fringe has different spatial layouts and facility distributions because of lagging development. Such differences in space resources lead to differences in the layout of industrial distribution, commercial scale, road traffic, and other infrastructures, which further result in differences in number of travels, travel mode, and travel purpose. Based on the residential travel survey, the aggregated trips of each TAZ were collected. To reflect the attractiveness of each TAZ, travel intensity of each TAZ was calculated (equation (1)). The travel intensity was calculated through dividing travel attractions by TAZ area

where
Identification of fringe boundary based on mutation point
In previous researches, the method of measuring urban fringe area based on mutation point theory has been widely and successfully applied. From the three aspects—including (1) population density data, (2) socio-economic data, and (3) the selection of land use data for mutation point analysis—all experiments have been conducted successfully. Based on the previous studies, we aim at identify the scope of the space in the aspects of travel behavior. This study considered each TAZ as an influential and attractive area. Each TAZ exhibits a difference in travel intensity due to actual conditions. Theoretically, there are two mutation points from the core of the old town to its affected area: one is the mutation point within the boundary, and the other is the mutation point outside the boundary. Based on the mutation point theory, the mutation detection method was introduced into the travel intensity distribution analysis in this study. Therefore, with the distance Di from the city core increasing, the mutation of the travel intensity should be identified.
In the first step, the variation sequence of travel intensity was extracted. As shown in Figure 4, with the old town core as the center, 36 rays were uniformly scattered around the center, and variations of travel intensity in 36 directions were extracted. In each ray, sample point was selected every 500 m and travel intensity at the sample point was collected. Then, the line graph was adopted to present relationships between travel intensities and distances from the core. As shown in Figure 4, taking the east direction as an example, O-E is the ray from the core to the east, from which travel intensities at 19 sample points were collected.

Sampling in mutation point analysis.
Second, the mutation point and the mutation interval were extracted. In a certain direction, the ith travel intensity was represented as Ti, and the distance of ith sample point from the core was represented as Di. Then, the variation of travel distance was represented as Vi and was calculated as equation (2)

where ΔD was 500 m in this study. The distance interval with the largest
Finally, the old town fringe boundary was recognized. According to the mutation interval delineated in last step, the mutation region was drawn. TAZs that had coincidence relationship with the mutation region were used as the traffic region covered by the old town fringe. The inner and outer boundaries were outlined along the contours to obtain the extent of fringe.
Examination based on POI data
In this study, we utilized Baidu Map API Service. And then, we wrote code through Python to apply for Baidu in order to get detailed Nanjing POI geographic information. After data cleaning, data were imported into ArcGIS to conduct the weighted kernel density analysis so that the contour of the density decay of POI was obtained. Since the kernel density method analyzes the concentration intensity of space based on the spatial relationship between adjacent facilities, it can symbolize the difference in spatial position and the attenuation of center intensity with distance through a series of attenuation bandwidths. The weighted kernel density analysis is based on the kernel density analysis, which adds different spatial weights to different types of point features, and can accurately reflect the spatial influence domain of multi-type point feature superposition effects. Similar mutation point analysis process was conducted with density decay of POI and thereby mutation intervals based on POI were obtained. Then, the old town fringe boundary based on POI data was identified. Finally, the old town fringe area based on POI data was compared with the area identified by the travel survey data. If the two areas overlap or partially overlap, that is, the identified areas are valid, all valid areas are reserved and merged. If the two are separated, the identified areas are invalid and are rejected (see Figure 5).

Examination of the old town fringe area.
Situation 1 and situation 2 both indicated that there existed POI-based mutation point in the preliminary old town fringe area, which suggested that the results were consistent and valid. Situation 3 showed that the POI-based mutation points all were out of the preliminary old town fringe area, which indicated an estimation error. In such case, the results should be eliminated.
Results and discussion
Recognizing fringe boundary with travel data
The trip intensity of each TAZ is calculated and visualized on the ArcGIS platform (see Figure 6). The deeper the color, the greater the travel intensity. The lighter the color, the lower the travel intensity. Overall, a decreasing tendency of density is illustrated from the center to the periphery, while there are some areas with high traveling intensity on the periphery of the old town.

Travel intensity distribution map based on residents’ trip survey.
Xinjiekou was the central business district of Nanjing, which was considered as the study site in this research. Specifically, the intersection of Zhongshan Road and Hanzhong Road was considered as the center of study site, and the whole circular district with the intersection as center was split into 36 parts according to angle (i.e. every sector was 10°). Then, in every sector, the traffic analyzed zones which are x km (x is integer) far from the center were recorded and the change of their travel intensity in every section was illustrated as smooth curves. Four graphs in different directions including oriented-east (O-E), oriented-west (O-W), oriented-south (O-S), and oriented-north (O-N) are illustrated in Figure 7. In the four example directions, the interval in which the rate of change of the travel intensity was the largest in these four directions was obtained by calculation, which was the travel intensity mutation interval in four directions. They were, respectively, 3.0–6.0 km, 5.0–6.5 km, 4.0–6.0 km, and 3.0–4.0 km. According to this, the straight-line distance between the inner and outer borders of the old town fringe area and the center of the old city in these four directions could be obtained. According to this method, the results in 36 directions are obtained (Figure 8).
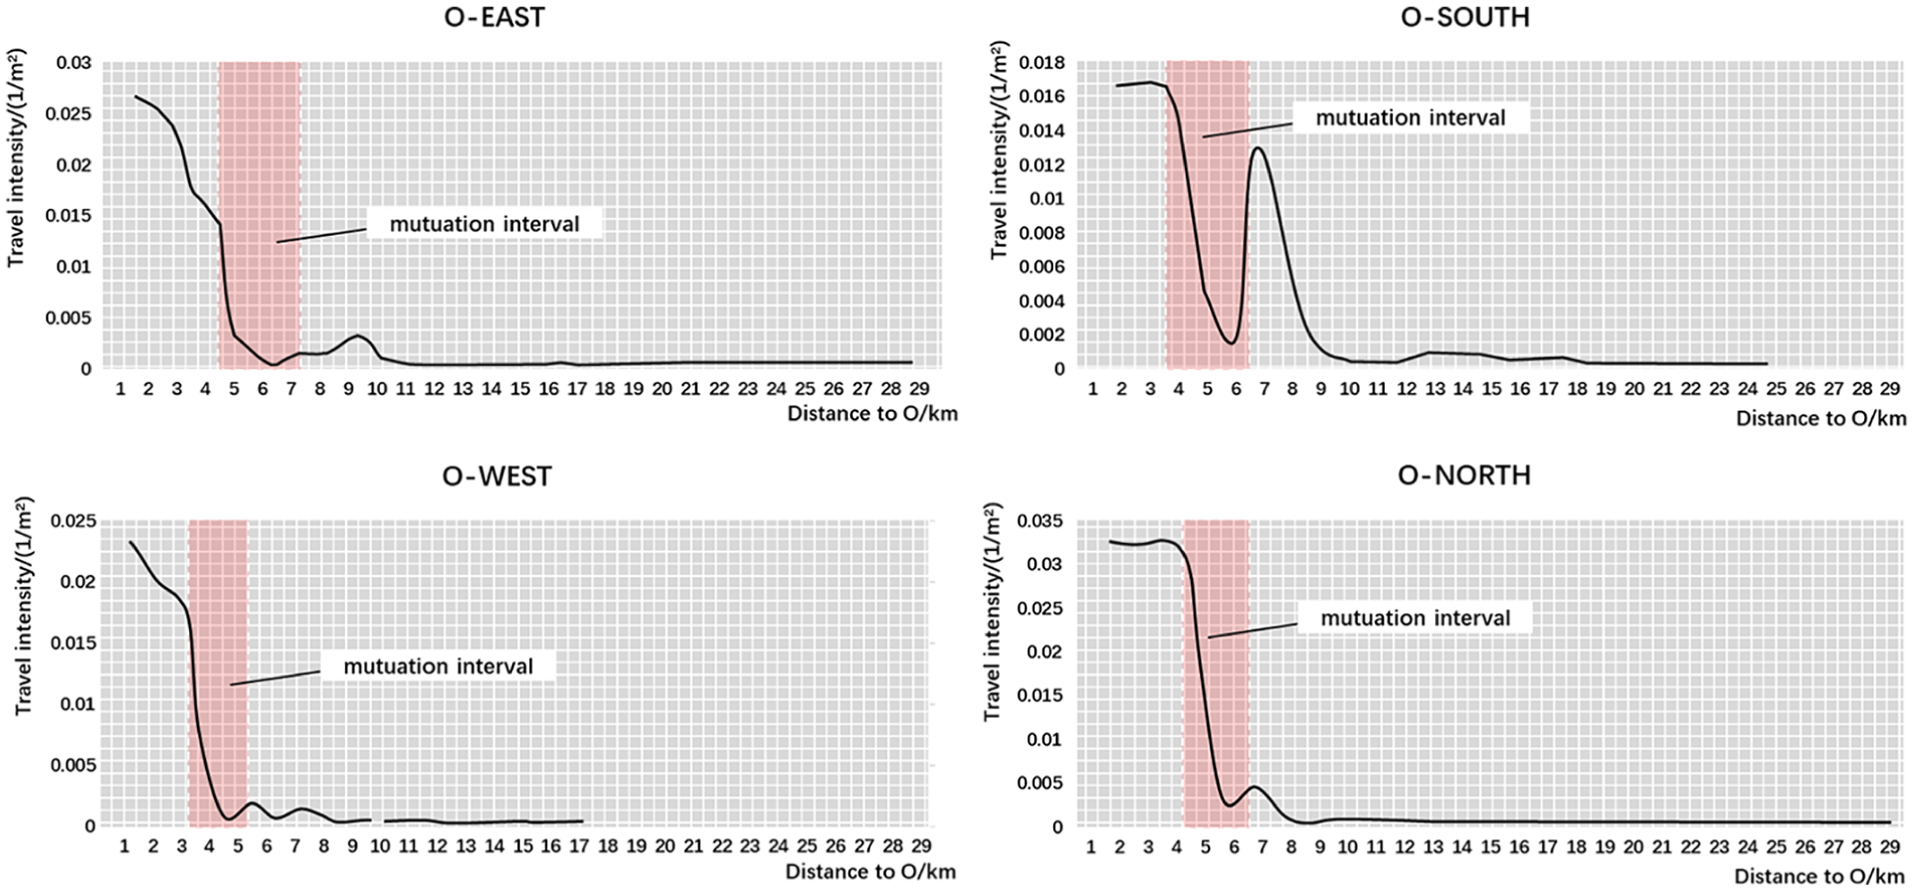
Change of travel intensity and mutation interval in four directions.
Determination of the old town fringe by mutation.
Verify fringe boundary with POI data
In order to improve the reliability and accuracy of the results, the weighted kernel density analysis based on the POI data is applied. As shown in Figure 9, the redder the color is, the denser the service facilities are in this region. For validating the effectiveness of these regions, 36 sections were selected evenly and calculated as stated before. As shown in this figure, statistics shows the kernel density mutation intervals in 36 directions, and overlay analyzes it with the mutation interval of travel intensity. In terms of the 36 directions of evenly divergence, there are 13 directions for partial inclusion, 21 directions for complete inclusion, and no overlap in 2 directions. The statistical results of the two data show a 61% area fit and a 75% interval fit. The directions in which the mutation interval does not overlap or less overlap are mainly in the direction of mountains. It is speculated that it may be that natural environmental factors limit the spatial behavior and result in this mismatch. Taking the four directions of O-E, O-S, O-W, and O-N as an example, the comparison results are shown in Figure 10. The POI kernel density mutation intervals in these four directions are 3–4 km, 6–7.5 km, 4.5–7.5 km, and 2–3.5 km, which are consistent with the mutation interval of travel intensity and in checking all directions. After determining the scope of the old town fringe area according to the principle of “No overlap is eliminated,” we ultimately got the following fringe area ranges. This result of cross-validation indicates that the method of the old town fringe defined by the mutation of travel intensity is effective.

The results of POI nuclear density.

Curvature map of POI contours in four main directions.
Determination of old town fringe area
The identified fringe area jointly by multi-source data is distributed in the periphery of the old town center of Nanjing. It is mainly distributed within the range of 2–6.5 km from the center of the old town, covering the 46.98 km2 periphery of the old town (see Figure 11). Considering the shape and space, the features of the border area of Nanjing old town are presented as follows:
The inner contour of the old town fringe shows a distinct historical shape. The inner contour of the marginal area resembles the “concave” character of the Nanjing Ming city wall. Then, the preservation status of the old city’s historical form has a great influence on the shape of the edge area.
The region is featured with irregularity. Influenced by the natural landscape pattern of the city, the development of the northern area is limited to Xuanwu Lake and Zijin Mountain, and there is a fracture in the marginal area. As the result of the uneven development of urban space, the scale of the fringe area changes unevenly and irregularly.

The boundary area of old city of Nanjing determined by this study.
Travel characteristics analysis in old town fringe
A total of 2919 travel information related to the fringe area was selected, which was divided into five categories as shown in Figure 2. The first one is the internal travel, the second one is the O-travel, the third one is in the D-travel, and the fourth one is the crossing travel which includes inward trips and outward trips. Table 3 reports the number of travel records and the percentage of each travel type. The crossing travel (including inward trips and the outward trips) is currently the most common type of travel, which accounts for 58.41% in all trips (including 34.3% and 24.1% for inward and outward travel, respectively). The proportion of internal trips is extremely small (0.9%), while the O-travel and D-travel are accounted for 16.99% and 23.7%, respectively.
Description of travel types.

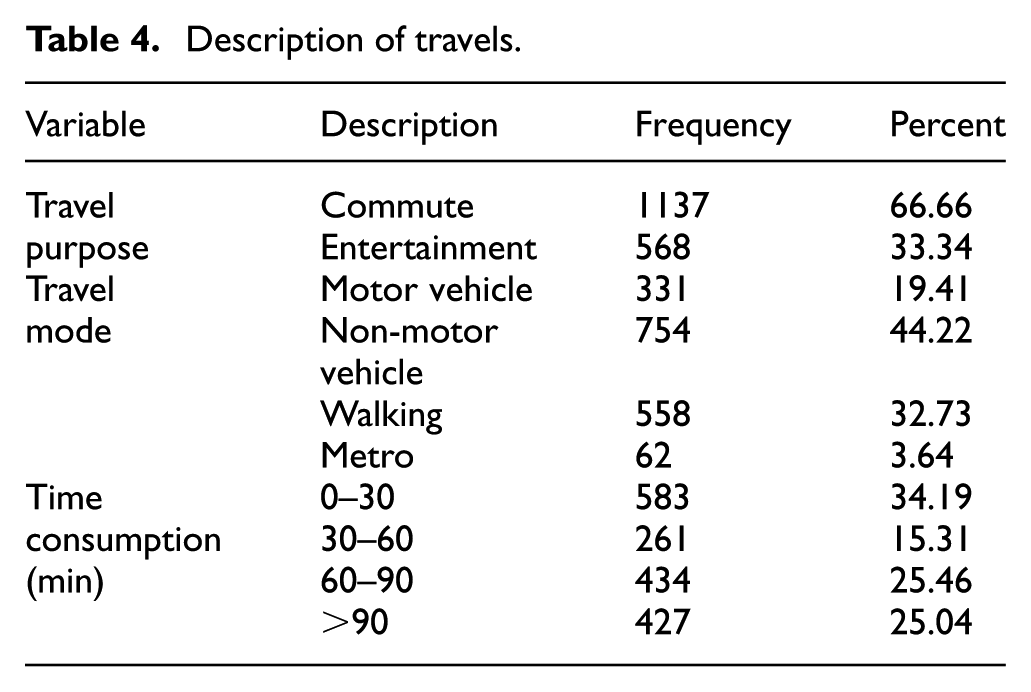
Crossing travel features
Crossing travels account for the highest proportion of all types of travel. And, the number of inbound travels is bigger than that of outward travels. Table 4 describes the records and the proportions in different traveling purposes, the way of traveling, and total travel time. The main purpose of transit trips is commuting trips. The amount of travel for commuting is about twice the travel for entertainment purposes, and the average time spent on travel is 66.3 min. Under the consideration of the proportion of various transportation ways, the average travel distance is about 28.8 km.
Description of travels.
O-travel features
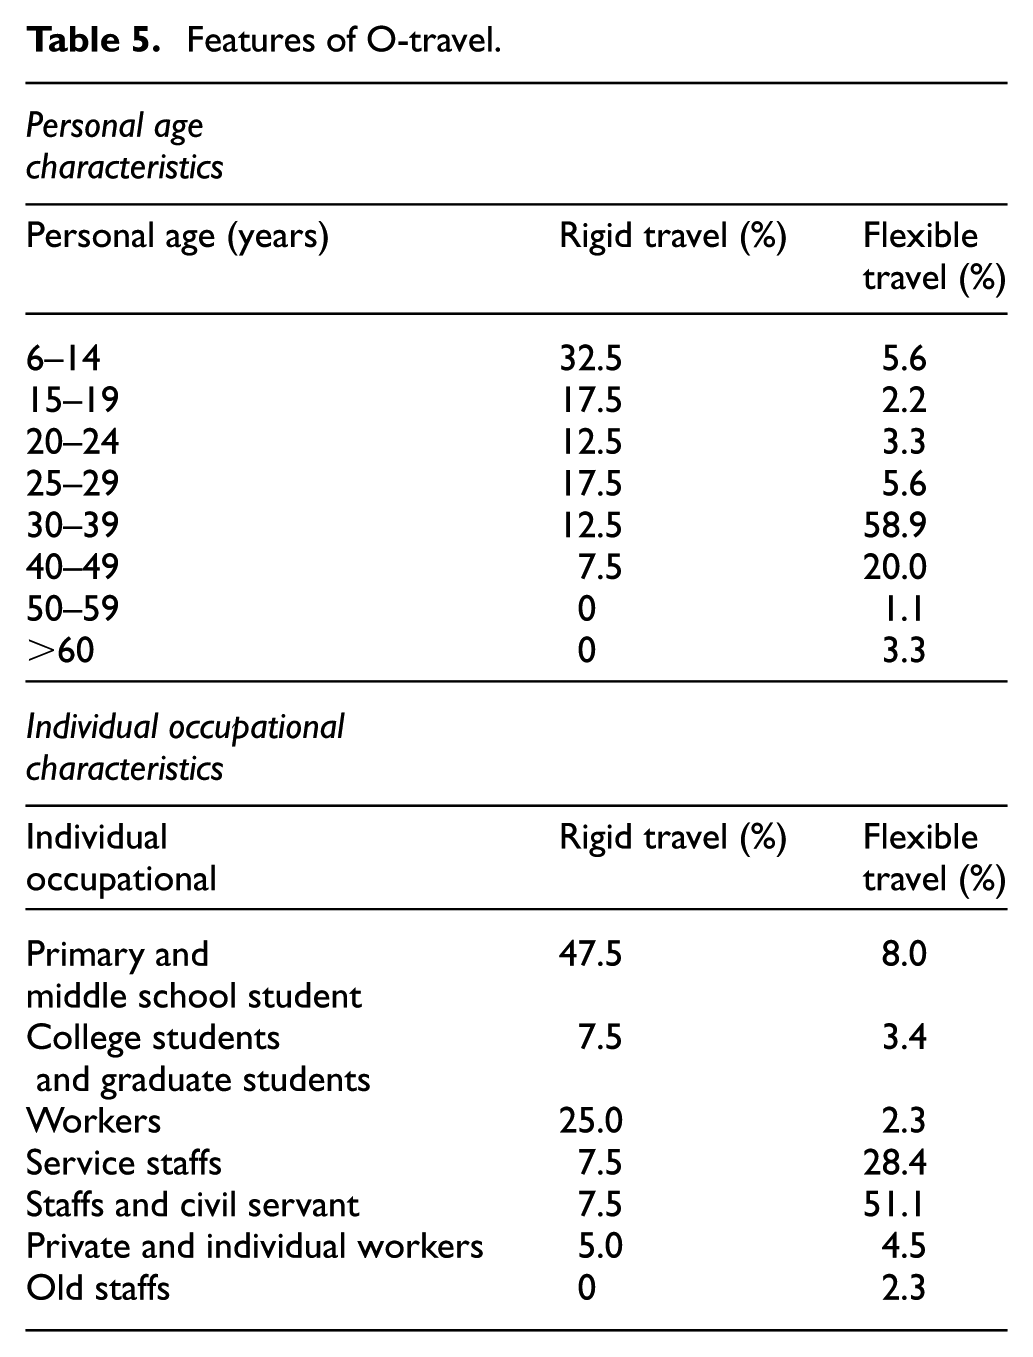
As shown in Figure 12, for commuting purposes, most of the travels are evenly distributed in the old town. The reason is that plenty of schools and employment posts are distributed in this area. The proportion of primary and secondary school students aged 6–19 years is the highest while workers aged 20–29 years also account for a large proportion. Non-commuting purposes are also concentrated and evenly distributed in the old town, but its travel destinations are more concentrated in the Yuhuatai area, Jianye area, and the southern part of the Purple Mountain (see Figure 12). Most of the people in those trips are 30–49 years old (78.9%), and their jobs usually are waiter or civil servant. The origin is mainly located in the southwest and southeastern parts of the old town fringe, which is probably due to the large number of residents in these areas (Table 5).

Travel space distribution of O-travel in old town fringe.
Features of O-travel.
D-travel features
In commuting trips, most of the origins in the D-travels are relatively concentrated in the northern part of Zijin Mountain, the west of Sanpailou area, and the eastern part of Yuhuatai. The age of commuters is concentrated between 30 and 59 years. The most popular occupations are workers, civil servants, staff, and retired employees. The non-commuting travels are concentrated in several strong attraction points, such as Imperial Palace area and western area of Yuhuatai. This is because those areas contain plenty of parks. The travel group is mainly concentrated with 30–49 year olds (accounting for 57.0%), and the most popular occupations are service personnel, civil servants, and retired employees (Figure 13 and Table 6).

Travel space distribution of D-travel in old town fringe.
Features of D-travel.

Internal travel features
The purpose of the internal travels is mainly entertainment. Most of the travels are made by walking and biking (36% and 40%, respectively). The average travel time is 43.84 min. Compared with the other two types of travels, the internal one has the feature of short distance, less time, and low-carbon, which is environmentally friendly. However, the internal travel accounts for a very small proportion. Perhaps, it is caused by the incomplete development of land use in the fringe of the old town. It also indicates that within the fringe, there is a clear separation of occupation and residence.
Suggestions and conclusion
The study provides a data-fusion-based method for old town fringe area recognition. The mutation point method was first applied to divide the old town fringe based on the travel intensity using the travel survey data. Then, the mutation point of kernel density in the Baidu POI data was performed to validate the old town fringe. The travel behaviors within the recognized fringe area were analyzed. For the crossing traffic, the trip purpose is mainly commuting with a long travel distance by driving a car. The destination of most travels is distributed evenly within the old town area, while the origin within the old town only appears at several separated points. For trips within the fringe area, its percentage is very small and most residents choose walk or bike for their travels.
Based on the findings from the study, we proposed several suggestions to improve the transportation system of the old town fringe area. First, in terms of cross-boundary travel, the total number of private car and private non-motorized travel accounts for more than 60%, about twice the total amount of the remaining modes of transport. The government should provide P + R (Park and Ride) transfer counters in the marginal area of the old town in order to provide a comfortable and convenient environment for parking and transition. In addition, residents are encouraged to take public transport to city center to reducing vehicles which enter the city center or pass across the old town fringe.
Second, in terms of starting a trip, main problems are the total amount of travel to the old town and uneven distribution of travel. As the characteristics of the main road to the old town for the place of departure, land in the old town fringe area should be mixed and residential service facilities and office space should be increased moderately, so that residents of the area can go to school, work, entertain, and so on, and in addition, we recommend to reduce the ratio of residents to the old city center and guarantee the balance of the total number of residents traveling in the area. As to the problem of uneven distribution of trips, the concept of job-housing balance should be adopted, which can make the distribution of residents’ trips relatively balanced and relieve the situation of the amount of travel that is extremely concentrated and unevenly distributed.
Third, in terms of the commencement and termination of travel, the total traffic flow and the uneven distribution of travel become main problems. In terms of the travel, whose starting point travel is the old town, the usage of land in the old town fringe area should be mixed, and the residents’ service facilities and office space should be increased moderately for studying, working, recreation, or other activities. In addition, we recommend reducing the proportion of residents to the old town center to ensure the balance of the total traveling. For the problem of uneven distribution of the commencement and termination, we should adopt the occupational balance method, which can balance the distribution of the commencement and termination travel relatively, and alleviate the situation of large concentration and uneven distribution of travel volume.18,19
In terms of internal travel, according to the characteristics of walking and non-motorized travel, the government should properly classify the road system and establish a comfortable walking system, as well as provide special non-motorized lanes and walkways. These things can facilitate the travel of residents and improve convenience and vitality of this area. At the same time, we should perfect the land structure of the old town fringe, then some of the commencement and termination travel can be converted into internal travel. Thus, the reduction of average travel distance and the improvement of traffic operation are achieved.
The main contribution of the study is to provide a new way of the recognition of old town fringe area based on the fusion of travel survey and POI data. The study establishes a good foundation for analyzing traffic features and issues within the old town fringe area and developing proper policies. This article also has some limitations. For example, the TAZ should be divided more finely, which can improve the fringe edge recognition accuracy. Moreover, more data from broader sources could be used to better estimate and validate the fringe areas. New technologies such as autonomous vehicle and shared mobility could be applied for the specific traffic situations in the fringe area to improve the traffic operations.20,21 Furthermore, old town fringe area is updated continuously with the boundaries growing or shrinking. Thus, a dynamic view on the evolution process of the old town fringe could help better understand the renewal mechanism of such area, which could lead to more interesting findings. Authors recommend that future studies could focus on such issues.
Footnotes
Handling Editor: Hai Xiang Lin
Declaration of conflicting interests
The author(s) declared no potential conflicts of interest with respect to the research, authorship, and/or publication of this article.
Funding
The author(s) disclosed receipt of the following financial support for the research, authorship, and/or publication of this article: The research was jointly supported by the National Natural Science Foundation of China (51678132, 51778277, 51678130, and 71871057) and the National Key Research and Development Program of China: Key Projects of International Scientific and Technological Innovation Cooperation between Governments (2016YFE0108000).