
Abstract
Net positive suction head peak is a well-known cavitation instability phenomenon in high-specific-speed pumps. Both non-cavitating performance and cavitating performance of a high-specific-speed pump were investigated by experiments and numerical simulations. According to the cavitating performance results, net positive suction head peak is found at 80% of nominal flow. The head curves of non-cavitating performance also have saddle-type instabilities near 70%–80% of nominal flow. Water vapor volume fraction distributions show that cavitation region at net positive suction head peak flow only covers 3% of the blade length when head drops 6%. It proves that net positive suction head peak is not caused by huge amounts of cavitation bubbles, which indicates that net positive suction head peak does not represent excessive cavitation. The velocity vector and pressure distribution plots reveal that net positive suction head peak is related to recirculation near the trailing edge. With inlet pressure decreasing, the flow pattern is sensitive to the cavitation bubbles, and recirculation region from the pressure side to the suction side becomes larger and larger.
Keywords
Introduction
Many of the pump cavitation investigations report that cavitation instability exists in some of the centrifugal and mixed-flow pumps. 1 Net positive suction head (NPSH) peak at part load is one of the instability phenomena, the peak value indicates an enlarged danger of cavitation attack, and it requires high inlet pressure to prevent the cavitation in the pump engineering world.
The NPSH peak investigation started from the mid-19th century and mainly used the experimental techniques. Minami et al. found a peak value at part load in cavitation inception curve by NPSH experiment with a visual pump model. The unstable flow phenomenon was observed on the blade at NPSH inception peak flow rate. 2 A series of NPSH experiments of a mixed-flow pump was done by Schiavello, where the pump performance instability was found at 71% of best efficiency point (BEP) flow. In his paper, Schiavello described that instability was linked to the suction recirculation, and both net positive suction head at 1% head drop (NPSH1%) and net positive suction head at 3% head drop (NPSH3%) peaks happened near the performance instability flow rate. 3 Since the end of the 20th century, numerical simulations were started being used. Both Okamura and Miyashiro as well as Ginter and Staubli used computational fluid dynamics (CFD) techniques to investigate part-load instability phenomenon. The results indicated that the part-load performance instability was caused by recirculation. But they did not report any of the NPSH peak on their models.4,5 When coming to the 21th century, Friedrichs and Kosyna did lots of part-load cavitation instability research work for different specific-speed (nq) impellers. One of the performance instability investigation was based on an nq 61 pump. Two different test procedures generated two different performance and NPSH curves. One was stable without peak and another was unstable with peak. Now this article states that the stable curve was “false” because head drop curve is senseless to bubbles by using one of the test approaches. 6 In another investigation by Skara et al., three different nq impellers were tested. For the medium and high nq impellers, NPSH inception peak was found at part-load condition. They described that NPSH inception is in a good relationship with the onset of suction recirculation. 7
Suction recirculation is the key parameter to cause NPSH peak instability according to the above research work. But there are still two remaining questions in this research area. One is how does suction recirculation cause the cavitation and another is how severe the cavitation is at NPSH peak flow. This investigation states some new perspectives for NPSH peak instability based on experiments and numerical simulations.
Experimental model and test rig setup
To study the NPSH peak of the high-specific-speed pump, an nq 99 pump was used as the experimental pump model. The pump is of the inline type, which means the pump suction and discharge flanges are at the same height (Figure 1). The nominal flow rate is 1380 m3/h, and the nominal head is 19 m. The rotating speed is 1450 r/min. The key component impeller was casted by three-dimensional (3D) print core technology. The impeller dimension details (units: mm) are shown in Figure 2.

Pump model.

Impeller geometry.
Figure 3 displays the closed test rig diagram which was used for performance and NPSH experiments. The entire setup was based on the International Organization for Standardization (ISO) 9906 standard. Pressure measuring sections were located at a distance of two diameters from the pump flanges, and pressure tapping were perpendicular to the plane of pipes. A thermal sensor was used to measure the temperature to capture the influence of density change. Water in the tank was degassed before NPSH experiments.

Closed test rig diagram.
Numerical simulation setup
The commercial software GridPro 4.5 was used to generate structured meshes. Different impeller mesh configurations had been investigated in the simple cavitation simulation to analyze mesh independence in this case. The comparison shows 80 nodes in the impeller stream-wise direction, 48 nodes in the impeller span-wise direction, and 34 nodes in blade-to-blade direction are good enough to have stable CFD results, as shown in Figure 4. Following the impeller mesh independence analysis results, 1.1 million mesh elements were settled in the complete pump model (Figure 5). All the pump components are included in the numerical model. This means that both impeller plate friction losses and front cavity leakage losses were considered in the numerical simulation.

Impeller mesh independence analysis.

Complete pump meshes.
Two main model setups in the cavitation numerical simulation are applicable. One is impeller channel model alone8,9 and another is complete pump model.10,11 In this study, NPSH peak flow rate is related to leakage flow in the front cavity, so the complete pump model was used in cavitation numerical simulation.
Both performance and cavitation simulations were conducted within the framework of ANSYS CFX17.0. In performance simulation, high resolution was selected for the advection, and high-resolution transient scheme was chosen for turbulence numeric. Transient rotor–stator interfaces were applied between rotating domain and stationary domain to catch the unsteady rotor–stator interaction. 12 The initial number of time-steps was 120 with 10 revolutions which meant 30° per time-step. In the final 10 revolutions, 6° per time-step was used to get the stable and accurate unsteady numerical results. Convergence criteria were maximum residual with 10-4 target. Therefore, totally there were 20 revolutions with time of 0.8275 s.
Physically cavitation is a fast-phase transition process, and it is difficult to capture the right thermal effects in the numerical simulation. Therefore, homogeneous model and Rayleigh–Plesset model were applied to the numerical model. A mixture model was chosen for inter-phase transfer to share the flow-field velocity for different fluid phases.
Results and discussions
Non-cavitating performance analysis
The pump was tested with 4 bar system pressure to make sure there is no cavitation happening during the performance experiment.
Figure 6 shows the experimental and CFD head curves, and Figure 7 shows the experimental and CFD efficiency curves. Both experimental and CFD head curves have saddle-type instabilities. The instability of experimental head curve appears at 80% of nominal flow, but the instability of CFD head curve appears at 70% of nominal flow rate. Therefore, there is a 10% flow gap regarding the occurrence of saddle. From 80% to 130% of nominal flow, all the comparison curves have a good alignment with each other, no matter what the head curve, power, and efficiency were. From 20% to 40% of nominal flow, both CFD head curve and power have an offset compared with the experimental results. But the efficiency is still spot on. From this point of view, the unsteady numerical model is capable of predicting the pump performance and can capture the part-load instability.

Head comparison.

Efficiency comparison.
Cavitating performance analysis
Experimental head curve in Figure 6 was used as the reference curve in NPSH experiment. A total of 15 flow rate points were performed from large flow rate to low flow rate. Both experimental and CFD NPSH peak appear at 79% of nominal flow as shown in Figure 8, which are aligned with saddle-type instability in Figure 6. The only difference between the experiment and the CFD is that the NPSH value at peak point. NPSH3% in CFD is 7.3 m higher than the one in the experiment.

NPSH3% comparison.
Figure 9 shows the experimental and CFD head drop curves at different flow rates. Head drop curves at 3% and 6% means the head drops 3% and 6% compared with head curves in Figure 6 at specified flow rate. The specified flow rates are 55% (Q55), 70% (Q70), 80% (Q80), and 100% (Q100) of nominal flow in Figure 9. Both experimental and CFD results demonstrate that head drop curves of Q70 and Q80 start to drop much earlier than Q55 and Q100 when comparing the available net positive suction head (NPSHa) in the axial scale, but the curves of Q70 and Q80 are becoming flatter after 3% head drop. The difference of the curve steepness initiates a conjecture that head drop at Q70 and Q80 is not caused by the huge amount of cavitation bubbles. Because lots of bubbles normally lead to quick head drops like the curves of Q55 and Q100; therefore, in the following sections, cavitation bubbles at different NPSHa will be investigated.

Experimental and CFD head drop curves: (a) head drop curves in experiment and (b) head drop curves in CFD.
Through these comparisons, it proves that complete pump cavitation simulation can catch the NPSH peak phenomenon and especially repeat the head drop trend at Q70 and Q80. It means the current cavitation simulation model which is described in section “Numerical simulation setup” is a suitable setup for further cavitation instability investigations.
Cavitation region and flow-field analysis
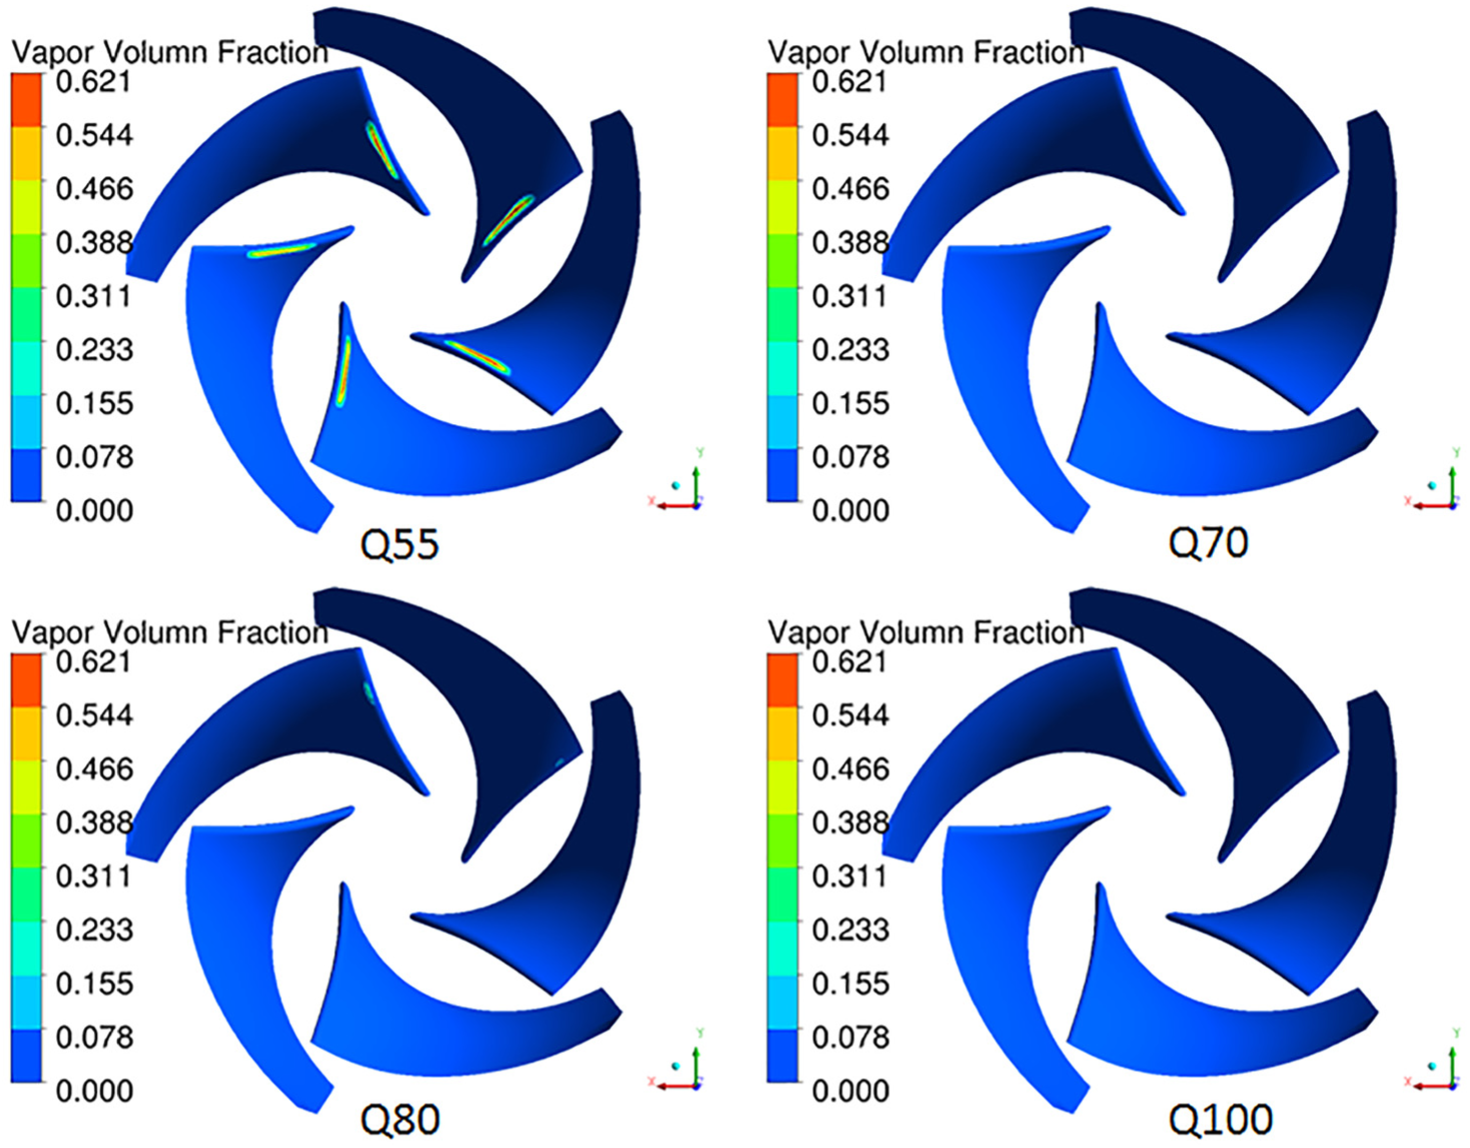
The cavitation region at 0%, 3%, and 6% head drops are shown in Figures 10–12. At 0% head drop condition, most of the plots do not show any cavitation bubbles except Q55. Q55 cavitation region is mainly located on the suction side near the leading edge (LE), and the area is quite small. At 3% head drop condition, Q55 and Q100 cavitation regions are becoming larger. But cavitation regions of Q70 and Q80 are much smaller than other flow rates. During 6% head drops, Q55 and Q100 cavitation regions are even larger than the regions in Figure 11, but Q80 bubble region does not grow too much. It explains why Q55 and Q100 curves are steep and Q80 curve is flat.
Cavitation region at 0% head drop.

Cavitation region at 3% head drop.

Cavitation region at 6% head drop.
Vapor volume fraction and static pressure were extracted based on the above plots in order to quantize the cavitation region (Figure 13). The length where vapor volume fraction is more than 0 is defined as cavitation length. An interesting observation is that the flat part of the Q55 suction-side static pressure curve matches the area where Q55 vapor volume fraction is more than 0. Following the head drop from 3% to 6%, cavitation length of Q100 increases from 18% to 37% and that of Q55 increases from 35% to 55%. But cavitation length of Q80 is still around 3%. All the above results prove the conjecture in section “Cavitating performance analysis” that head drop at NPSH peak point is not caused by huge amounts of cavitation bubbles, but some other parameters.

Vapor volume fraction and static pressure at impeller mid-span location.
To obtain the other parameters which influence head drop at NPSH peak point, the flow field at Q55, Q80, and Q100 were investigated. According to previous research work, suction recirculation in the impeller is the main reason for performance instability of high-specific-speed pumps. 13 The first step is to analyze impeller meridional velocity and pressure distribution.
Q55 meridional velocity vector and total pressure distributions with different head drop conditions are shown in Figures 14 and 15. There is a low total pressure area in the pressure distribution, which is observed as recirculation in the velocity vector plot. At 0% head drop condition, the recirculation region is in front of the LE and the region horizontal length is quite long, which can be recognized as suction recirculation. It moves from LE to trailing edge (TE) along the shroud, when NPSHa decreases.

Q55 meridional velocity vector.

Q55 meridional total pressure distribution.
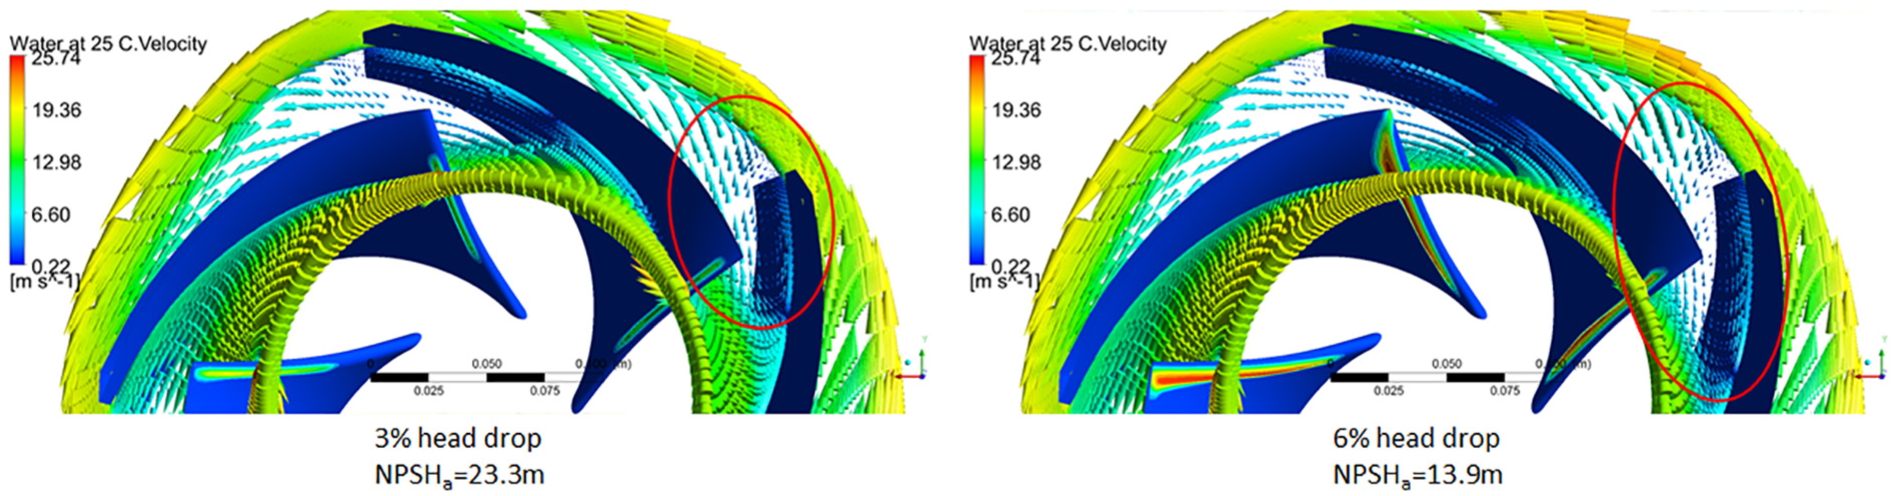
Q80 meridional velocity vector and total pressure distributions with different head drop conditions are shown in Figures 16 and 17. Q80 is where NPSH peak occurs. There is no suction recirculation in front of the LE, but instead, a small recirculation region is observed near the shroud TE. When NPSHa decreases, the length of recirculation region becomes longer, and it covers the whole shroud at 6% head drop condition.

Q80 meridional velocity vector.

Q80 meridional total pressure distribution.
Q100 meridional velocity vector and total pressure distributions with different head drop conditions are shown in Figures 18 and 19. The velocity vector plot demonstrates a uniform flow along the shroud at 0% head drop condition, and only a small low-total-pressure region appears on the shroud TE. When NPSHa decreases, the low-total-pressure region expands to a certain level, but it does not influence the velocity vector from Figure 18.

Q100 meridional velocity vector.

Q100 meridional total pressure distribution.
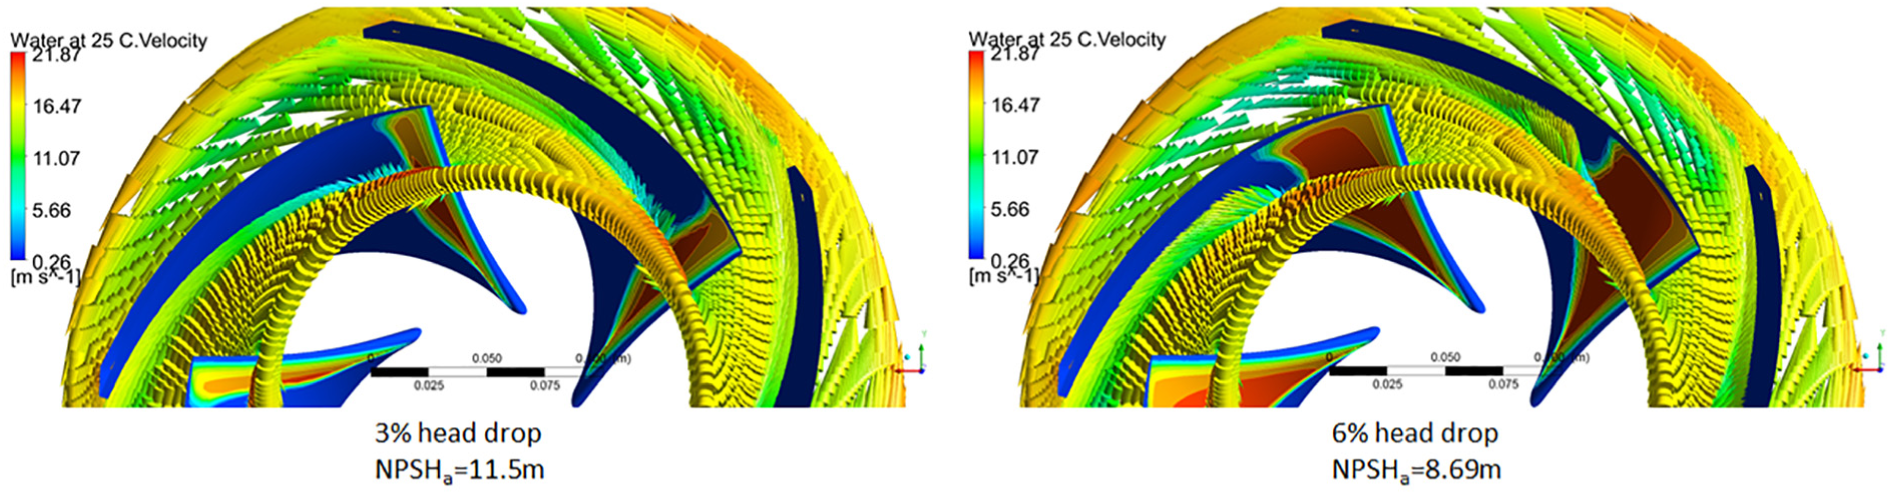
Figures 20–22 show Q55, Q80, and Q100 velocity vectors at 70% span-wise section from the hub to the shroud. Both Q55 velocity vector plots demonstrate a big recirculation region between pressure side and suction side, and sizes of these two regions are similar. However, at Q80, the recirculation region of 6% head drop is much larger than the one with 3% head drop, even though the cavitation length stays at 2%–3% level. It proves that the flow is quite sensitive to the cavitation bubbles at Q80. At Q100, we cannot see any recirculation regions at span-wise sections.

Q55 velocity vector at 70% span-wise section.
Q80 relative velocity at 70% span-wise section.
Q100 relative velocity at 70% span-wise section.
Conclusion
NPSH peak is found at 80% nominal flow. CFD NPSH peak value is 23.3 m, which is two times higher than the value at Q100 (Table 1). The head curves of non-cavitating performance have saddle-type instabilities near 70%–80% of nominal flow rate. It indicates that there is a relation between NPSH peak and saddle-type instability.
Cavitation region at NPSH peak flow only cover 3% of the blade length when the head drops 6% (Table 1). It proves the conjecture that head drop at NPSH peak point is not caused by huge amounts of cavitation bubbles. In another word, NPSH peak does not represent excessive cavitation.
According to the flow-field analysis, it demonstrates that NPSH peak at 80% of nominal flow is related to recirculation, but not suction recirculation. With the pressure decreasing, the flow pattern is sensitive to the cavitation bubbles, and recirculation region from pressure side to suction side becomes larger and larger.
This article gave an insight into part-load NPSH peak using numerical calculation. It is a good basis for further research on which parameters address the recirculation and how to eliminate NPSH peak at part-load operation. The link between recirculation and noise/vibration is another research direction in the future.
CFD cavitation length and NPSHa summary.

Footnotes
Appendix 1
Handling Editor: Chin-Lung Chen
Declaration of conflicting interests
The author(s) declared no potential conflicts of interest with respect to the research, authorship, and/or publication of this article.
Funding
The author(s) disclosed receipt of the following financial support for the research, authorship, and/or publication of this article: This work was supported by the National Natural Science Foundation of China (51679109) and Grundfos Holding A/S.