
Abstract
In thermal state diagnosis of substation equipment, problems such as low precision and slow speed usually exist. Aiming at the problems, an improved diagnostic scheme is proposed in this article. First, an infrared weak target extraction method based on local variance mapping and genetic algorithm threshold calculation is used to segment the region with abnormal thermal state in the equipment. Then the relationship between image gray parameters and temperature parameters of equipment region is established, and the improved relative temperature difference method is implemented to complete the classification and diagnosis of the thermal state of the equipment, and the abnormal area of the thermal state is captured and positioned at the same time. The experiment results show that the extraction accuracy and efficiency of the abnormal thermal area are improved based on the proposed scheme, which improves the fault tolerance of the thermal state diagnosis of the equipment and further ensures the operational stability of the substation and the entire power system.
Keywords
Introduction
Substation is an important link to ensure safe and reliable operation of power grid. In recent years, with continuous development of smart grid construction, the intelligentization of operation state monitoring and diagnosis of substation equipment have entered a new stage. 1 Infrared technology has been widely used as a special detection method for power equipment. In recent years, detection and diagnosis techniques based on infrared images have been being developed and applied. 2 If a weak local hot spot cannot be detected in time, the abnormal state will deteriorate continually and lead to serious system fault eventually. Therefore, new demands for infrared detection are confronted. 3 Traditional methods of infrared target extraction are usually based on the difference in grayscale and texture.4–7 However, when there are too much noise or weak targets in image, these methods will fail for the accurate extraction of targets. In view of this deficiency, many researches about infrared weak target extraction are made from domestic and foreign scholars. Two-dimensional (2D) orthogonal search method, 8 a sequential morphological filter, 9 and an infrared weak target extraction method based on mathematical morphology and regional growth, 5 or based on nuclear density estimation 10 and statistical features of block images, 11 are put forward, respectively. However, the process is generally complicated and the speed is low.
Nowadays infrared diagnosis on power equipment is a comprehensive technology that combines different types of information between infrared image and temperature distribution of the equipment. Li et al. 12 proposed a database comparison method based on spatial vector similarity, but amounts of data are required. Kang 13 put forward a device thermal defect diagnosis based on temperature distribution function promotion which is only applicable to spherical or cylindrical devices. Jing et al. 14 proposed a device fault diagnosis method based on image recognition which did not refine and analyze the fault category. Cui Kebin 15 proposed an infrared image–enhancement method based on nonlinear NSCT (nonsubsampled contourlet transform) transformation where fault region labeling was implemented by topological matrix modification. However, the calculation is complicated. Sun et al. 16 use data samples to fit the function mapping relationship between gray level and temperature in which plenty of temperature data are required and large data storage space is needed.
As shown in Figure 1, there are several ways to detect faults in power systems. However, these methods are based on the judgment of temperature, and such parameters are subject to environmental conditions and interference, and the detection effect is limited to the performance of hardware devices, so there are still many shortcomings in this type of technology.

Common diagnostic ways of in substation: (a) infrared temperature measurement and (b) inspection robot.
Figure 2 shows the infrared diagnostic diagram of the key equipment in substation. Through this means, defects of the equipment can be detected early in daily inspection, and the timely maintenance work can be facilitated, which can reduce accident rate effectively and improve the operational stability of the power system.

Infrared diagnostic result of equipment in substation: (a) isolating switch and (b) transformer.
In view of the above-mentioned deficiencies, an infrared weak target extraction method centering on local variance mapping and genetic algorithm threshold calculation is proposed to segment an area with abnormal thermal state from the equipment. Then the directional mapping relation from temperature parameters to image gray parameters is established to minimize the information fusion burden in diagnostic process. Finally, thermal state classification and diagnosis are carried out on the basis of the improved relative temperature difference method, and abnormal area of thermal state is captured and positioned at the same time.
The process of diagnostic scheme
A method of thermal state diagnosis based on infrared weak target extraction is proposed in this article. The criteria is constructed by establishing the relation between image gray level and equipment temperature. The diagnostic scheme is shown in Figure 3.

Scheme of regional thermal state diagnosis.
The core of hardware shown in Figure 4 is data compression and transmission control unit. First, A/D conversion of the image is implemented. The main work of this part is to achieve the acquisition of static infrared image within the specified time interval. The acquired image data are compressed and transmitted to the unit of image processing and analysis of the background server by wireless network. The functional modules inside the unit are shown in Figure 5.

Simulated experimental hardware platform.

Internal module of image compression and transmission.
Extraction of abnormal areas in thermal state
Thermal state diagnosis is to detect abnormal areas of the equipment and then classify them with valid criteria. The significant step is to extract the abnormal areas.
Regional image preprocessing
As shown in Figures 6 and 7, the preprocessing of the image is intended to enhance the contrast and highlight of thermal abnormal region. However, under normal conditions, infrared targets are usually composed of individual pixels. There are no obvious structural shape features and grayscale characteristics. In addition, the resolution of infrared image is low and the boundary of fault area is blurred, so the contrast of the feature is needed to be enhanced.

A transformer insulation casing.

Area with abnormal thermal state.
The signal-to-noise ratio (SNR) refers to the ratio of the intensity of the target to the noise, defined as in equation (1)

where μT is the average gray value of target and μB and σB denote mean and standard deviation of background gray, respectively.
Top-hat transformation is a method to solve the problem of non-uniform brightness distribution in target area. 17 As shown in equation (2), top-hat transformation of image f is defined as the difference between f and its open operation

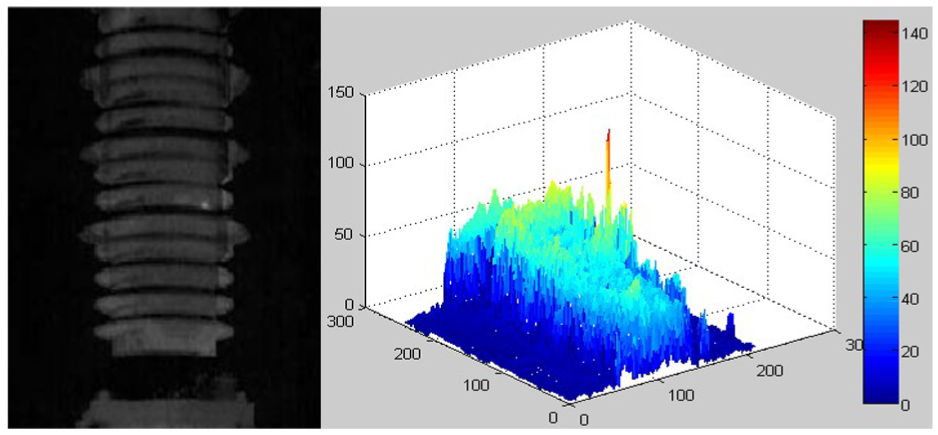
Different size of structural elements can be used to extract area features, and then highlight some of them, so that the contrast enhancement of the local area can be obtained, and non-uniform brightness distribution of the target can be solved. The transformation of the insulating sleeve image according to the structural elements of different sizes and their gray scale three-dimensional (3D) distribution is shown in Figures 8 and 9. Disk N in the figure represents the structural element of a disk-shaped structure with a radius of N, and N is a non-negative integer.

Effect of top-hat (disk = 5) and its 3D representation.

Effect of top-hat (disk = 15) and its 3D representation.
The gray level and gray mean value of each area of the whole image increase as the size of the structure element increases, which is shown in Table 1.
Comparison of morphological enhancement data: gray level and gray mean value.

SNR: signal-to-noise ratio.
On the contrary, the variance between the whole image and the target also increases, which indicates the drop between the global and local gray scale is more obvious, and the value of SNR gradually increases with the increment of structure element size. In order to further demonstrate the role of top-hat transformation, large-scale structural elements are still used for testing, and the results are shown in Figure 10.
Effect of top-hat (disk = 25) and its 3D representation.
Peak signal-to-noise ratio (PSNR) and mean square error (MSE) 18 are the common evaluation criteria of infrared image. Comparison of PSNR and MSE is shown in Table 2.
Comparison of morphological enhancement data: PSNR and MSE.
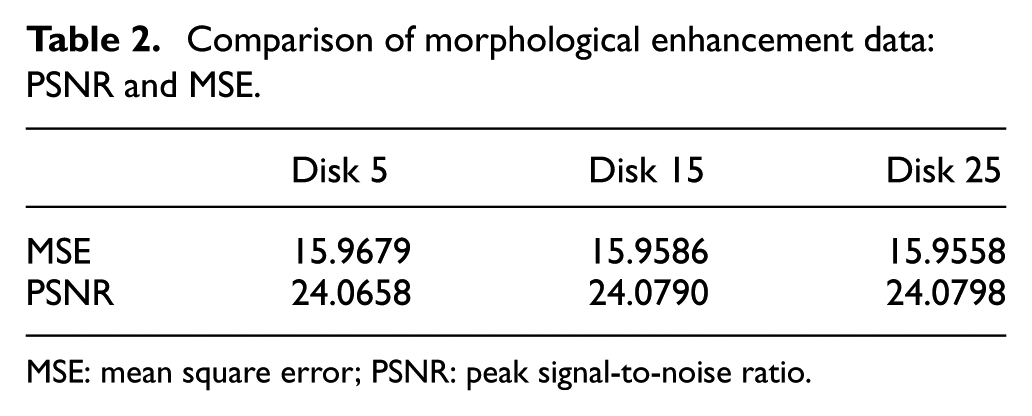
MSE: mean square error; PSNR: peak signal-to-noise ratio.
It can be seen from Figure 10 when disk = 25, the overall brightness is further increased, grayscale variation is intensified, and structure similarity is gradually increased. In Table 2, as structure element radius increases, interference is gradually eliminated. When disk = 25, MSE between the enhanced image and original image is smallest and PSNR is largest, which indicates the background interference reaches lowest. Experiments are shown in Figure 11.
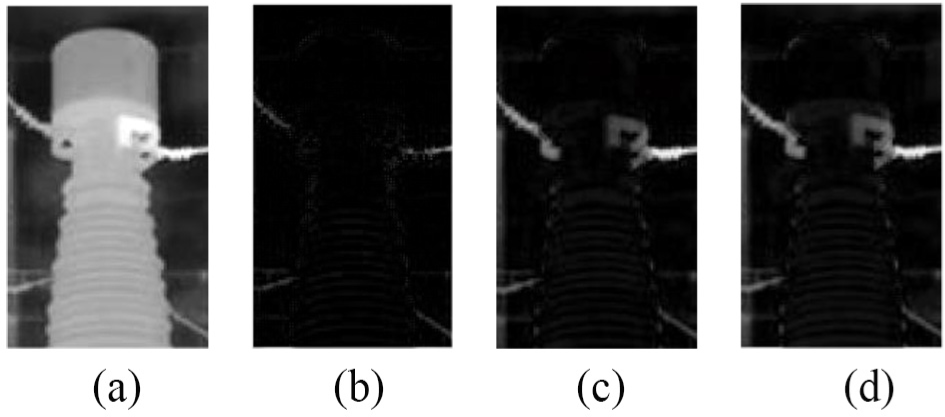
Original image of transformer and its transformation: (a) original image, (b) disk = 5, (c) disk = 15, and (d) disk = 25.
It can be seen when the disk is increased to 15, the effect is best, but if the structure element size continues to increase, the effect will decline. In summary, the size of structure element is matched with target size. Generally, a circular structure element which is slightly larger than the size of the object to be processed can be selected to segment the target. For common infrared weak targets, the structure element size is selected from 3 to 25. For some of the slightly larger target, the size can be increased to 30.
Segmentation of areas with abnormal thermal states
In a neighborhood of (m + n) × (m + n), the mean gray value and the local variance are represented by μ(i, j) and σ 2 (i, j), respectively

where f(x, y) is gray value, and f(i, j) is the pixel of the center point of the neighborhood. Usually, the range of the neighborhood is small; therefore, a densely meshed image and the variance of each mesh can be obtained by translation.
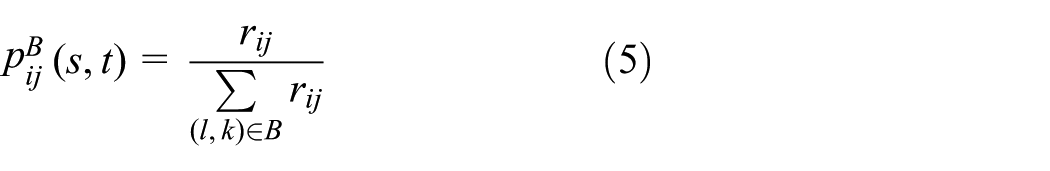
After local variance mapping, the positions of the local variance points of target A and background B do not affect each other, so the probability of two type points which is each value to local variance is defined as in formulae (4) and (5)

The image has L gray levels, and i, j = 0, 1, 2, …, L − 1. The average value of the neighborhood of any point (x, y) in the image can be expressed as in equation (6)

The value of any pixel (x, y) in original image can be converted into a 2D coordinate point formed by gray value f(x, y) and the average gray value g(x, y). (i, j) is used to represent the image, where i is the gray value of a certain point and j is the average gray value of the area. Then if the frequency of (i, j) is z(i, j) for
where p(i, j) is a 2D histogram about point grayscale and area gray mean value. A local variogram of insulation casing is shown in Figure 12. Its 2D histogram and the corresponding plan view are shown in Figures 13 and 14, respectively.

Local variogram of insulation casing.

The 2D histogram of local variogram.

The plan of a 2D histogram of a local variogram.
In order to ensure the target and background information maximal, 2D maximum entropy method is used to calculate the segmentation threshold. The histogram is divided into target and background by threshold vector (s, t). The limit value selected by 2D maximum entropy method is to make the posterior entropy of two parts have the maximal threshold vectors (s*, t*). The local variogram of the circuit breaker and transformer region after being enhanced are shown in Figures 15 and 16.
Local variogram of circuit breaker area.
Local variogram of transformer area.
Information entropy is the average amount of information H after masking out unwanted information. H is defined as in formula (8)

where pi denotes the probability of each gray level appearing in image after statistics. Two types of entropy are defined as in formulae (9) and (10), respectively

The threshold vector is expressed as in formula (11)

In the implementation process of genetic algorithm, individuals which are solutions to the problem are optimized from generation to generation and gradually approach the optimal one. 19 Therefore, this method can be used to optimize the calculation of threshold and improve the accuracy and efficiency of image segmentation.
The flow of genetic algorithm is shown as follows:
16-bit binary code is adopted for each chromosome, and each 8-bit code represents a threshold from the front to the back and dual threshold coding is applied.
The size of the population is 40 and the number of search generation is 100.
The binary chromosome array is decoded into two numbers between 0 and 255, which are used as two thresholds.
The fitness function is defined as Min{HA, HB}.
Threshold segmentation is performed in the same dimension.
Two points cross, and the two cross points are located in the first 8 bit and the last 8 bit, respectively. The crossing probability is 0.65.
When the algorithm was executed to the maximum number of iterations or the highest fitness value in the evolutionary has not changed for 20 generations, this is taken as steady requirement.
According to the above steps, the algorithm is optimized. The results are shown in Figures 17 and 18, respectively.

Operation result.

Fitness value obtained by optimization.
It can be seen from Figure 17 that the fitness function is obtained after 65 generations of operation. The optimal fitness value and the average one are presented real time in Figure 18. Simulation results are shown in Figures 19–21 and Table 3.

Traditional OTSU segmentation.

Traditional local feature segmentation.

Modified local feature segmentation.
Comparison of segmentation results.
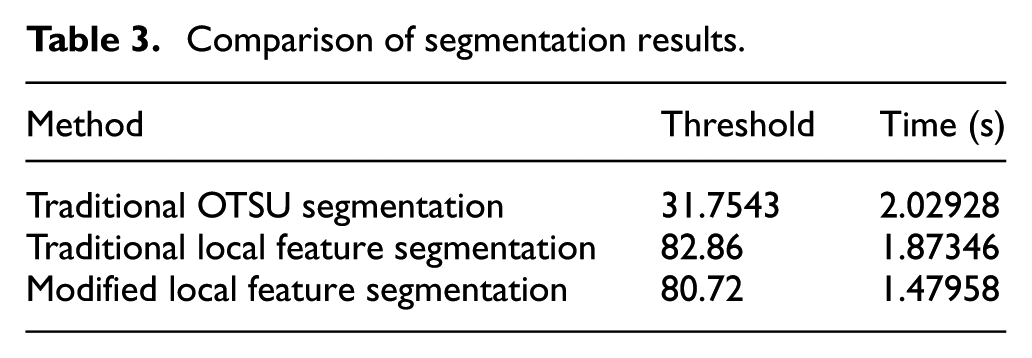
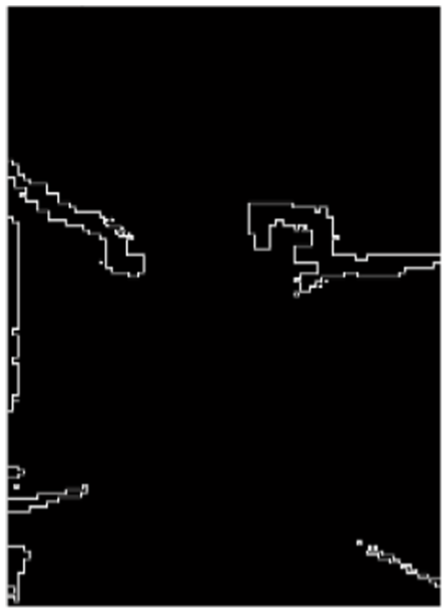
It is shown in Figure 19 that the target is not fully segmented, while weak small targets can be extracted accurately by local feature–based segmentation in Figure 21. It is shown in Table 3 that the modified method is better than traditional ones in the aspect of threshold calculation and segmentation speed.
It is also shown that segmentation speed is closely related to the size of target. Compared with general target extraction, the proposed method has higher speed, and it will become better as target becomes smaller. The reason is that if search space is larger, the role of genetic algorithms is more prominent. Transformer is also performed in Figures 22 and 23.

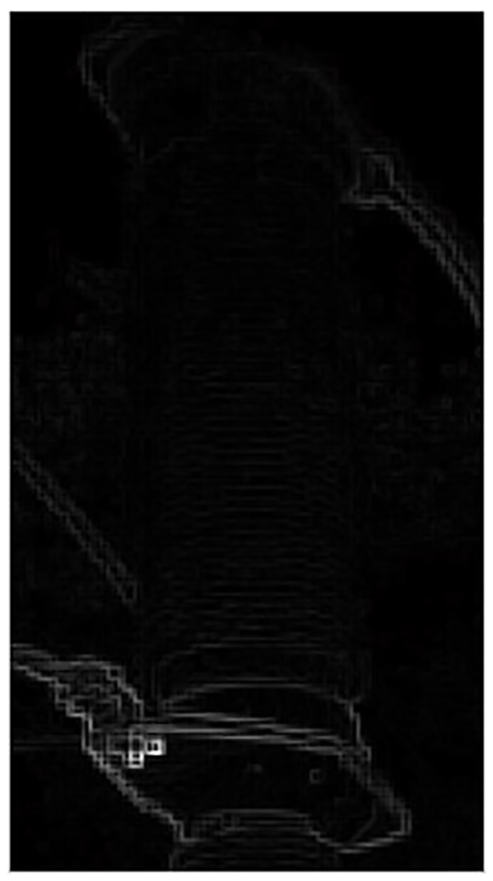
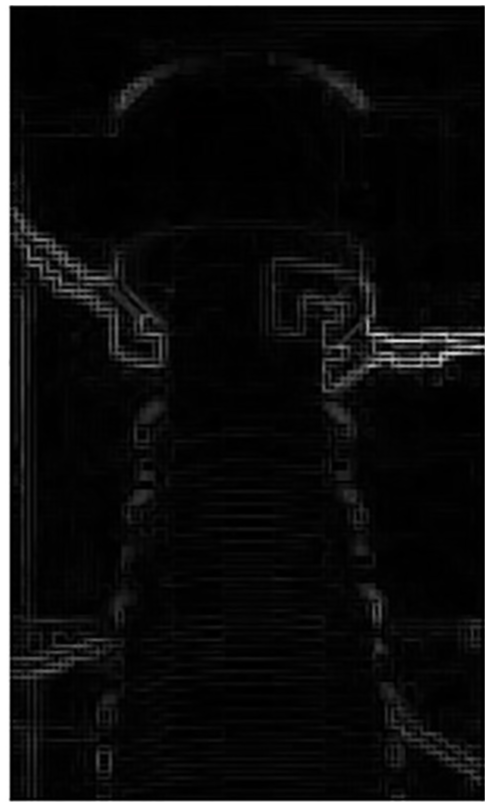
Traditional local feature segmentation.

Modified local feature segmentation.
It can be seen from above figures that lots of regional objects appeared after segmentation, because local variance mapping is implemented based on the difference in neighborhood gray scales. However, this feature can be adopted to improve fault tolerance of equipment monitoring. The comprehensiveness of thermal state monitoring can be ensured.
First of all, the boundary is extracted as shown in Figure 24. The grayscale analysis is made one by one for each region corresponding to each closed region, and average gray values shown in Table 4 are obtained and compared. The region with the largest gray mean value is determined as the final thermal state anomaly region. In order to improve fault tolerance of monitoring while avoiding the existence of many interferences, the first two regions with higher regional mean gray values are selected as suspected abnormal ones here. This criterion can be moderately broadened in some special cases.
Boundary tracking of segmented areas.
Mean gray values of closed areas.

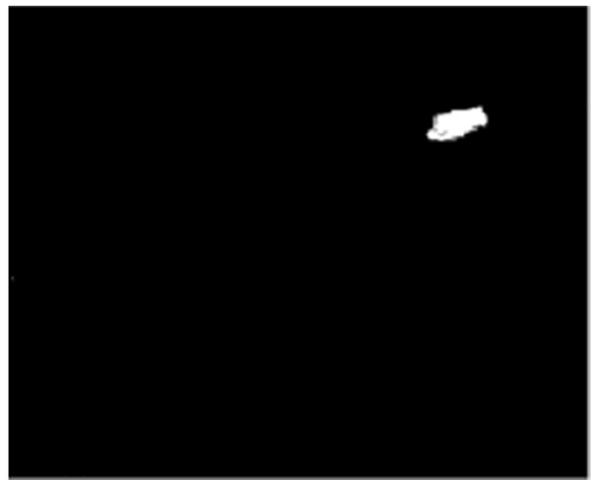
According to the value, the interference is removed, and the final suspected abnormal region is shown in Figure 25. The mean gray values of the left and right region are 210.871 and 183.395, respectively. According to the segmentation process, not only detailed variation of target is highlighted, but also target is extracted based on global gray analysis. At the same time, higher fault tolerance is obtained. Results after top-hat transformation and local variance mapping are shown in Figure 26. Thermal state anomaly area extracted is shown in Figure 27.

Final exaction of thermal abnormal area: (a) the first suspected area and (b) the second suspected area.

Local variance mapping on reactor.

Extraction of abnormal thermal state of reactor.
Identification and diagnosis of regional thermal state
Thermal defects analysis of equipment
The causes which lead to thermal defects in substation equipment are various. Based on the principle of infrared temperature measurement, all of thermal defects can be divided into external defects and internal ones. Among them, the former can be found directly by infrared temperature measurement. In normal circumstances, most of thermal defects are external. This category can be divided into general, severe, and critical according to the risk level, while internal defects are classified into serious and critical levels. 20
Infrared diagnosis method of equipment
The most widely used infrared diagnostic method in power systems is relative temperature difference method. Its merit is that the impact of normal operation on the equipment and ambient temperature is considered, and interferences such as air humidity and other objective factors are eliminated. In addition, accuracy of small temperature difference detection is improved. Its expression is shown in equation (12)

where
According to industry guidelines, the biggest difference between voltage-heat-generating equipment and current-heat-generating equipment is the temperature rise at hot spot. The temperature rise from the former is usually less than 10 K, while the latter is larger than 10 K or even 15 K. Therefore, based on the above features and combined with practical applications, a scheme of thermal state discrimination is proposed and shown in Figure 28.

Discrimination scheme of thermal state.
It should be noted that state type 1 in Figure 24 represents an external fault of current-heat-generating equipment, and state type 2 represents an internal fault of current-heat-generating equipment or an internal and external fault of the voltage-heat-generating equipment. In this scheme, as the discriminating criterion of current-induced external faults, temperature rise of monitored points is not less than 10 K. And severity degree of such faults is determined according to the range of relative temperature difference values. A more sensitive and comprehensive method is required for type 2, and therefore it is provisionally determined as “pending state” for further discrimination.
For the absence of specific temperature information in equipment area, a function mapping relation between gray information and temperature information can be used to calculate the actual temperature value T1 of the specific pixel. The formula is as in equation (13)

where R1 is the gray value of a certain pixel, and Tmax and Tmin denote the upper and lower limits of temperature in the measured infrared image temperature field.
The calculation of T2 and T0 in formula (12) is the same as in formula (13). In view of the fact that the gray parameter selection and numerical calculation must satisfy the actual meaning of the temperature parameter, the workload of image data acquisition, analysis, and processing is minimized under the premise of satisfying the working principle. The following provisions are made for calculating T2 and T0.
The gray value with the highest proportion of space in normal state is assigned to R2, and the lowest gray value in normal region is assigned to R0. In this way, T2 denotes the temperature value of normal area, and ambient temperature is avoided to be used directly for T0 and at the same time ambient temperature can be reflected in maximal extent. The highest gray value of the extracted region is selected as R1. According to the known infrared image temperature field range and grayscale statistics, the relative temperature difference of specific areas from various equipment can be calculated. The data of some monitored equipment are shown in Table 5.
Example data of some monitored equipment.

In Table 5, the temperature field range of original image, the gray value of the corresponding image, the final temperature rise, and relative temperature difference calculation results of monitored points are shown.
Thermal state identification and diagnosis
According to the determination scheme shown in Figure 28, first, temperature rise of monitored points is calculated to determine the category of thermal state of equipment. Then, according to the relative temperature difference criteria as shown in Table 6, the state of equipment in state category 1 is further judged. Those who belong to state category 2 will be marked as “pending state” and turn to other comprehensive technical means to be judged.
Relative temperature difference criteria for some of the current-induced equipment.

According to the relative temperature difference in the above table, thermal defects are identified and evaluated. The corresponding countermeasures are as follows: general faults should be noticed and opportunistically resolved.
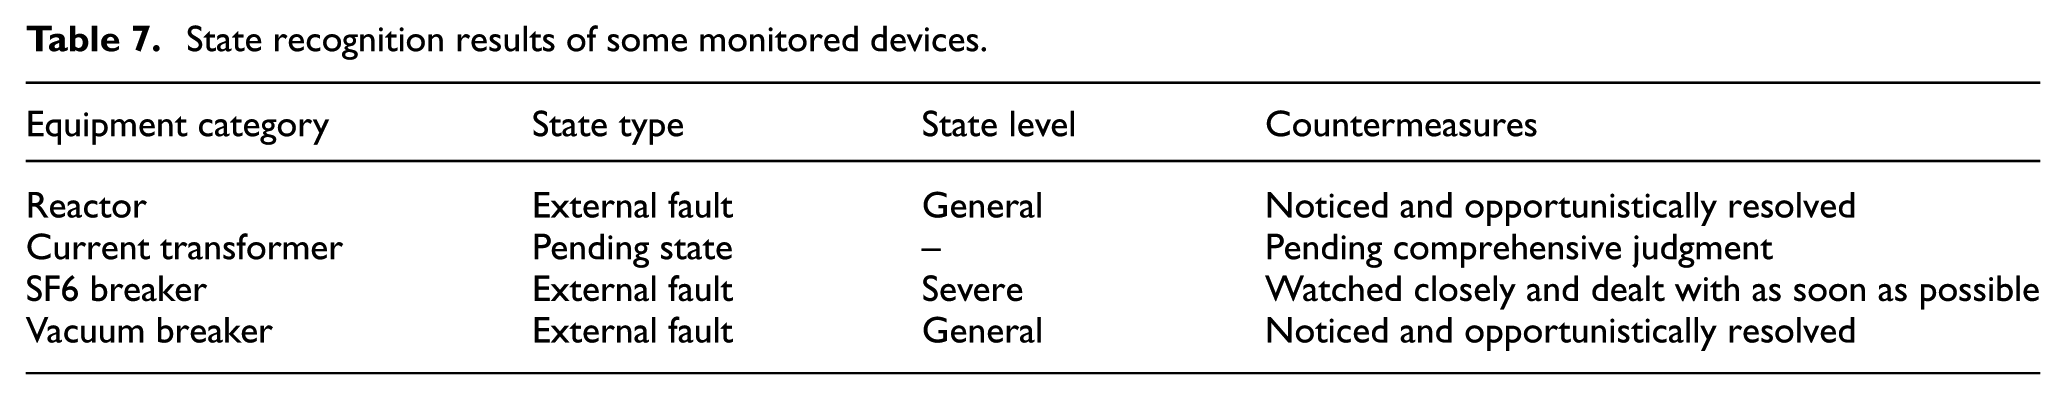
Serious defects should be closely watched and disposed as soon as possible. Critical defects should be immediately reported and blacked out. According to the above rules, the state of monitored points in Table 5 can be judged. Results are shown in Table 7. And it can be seen that the general external fault can be detected and corresponding measures will be given. In addition, for the points with low temperature rise, they can also be preliminary detected and marked as “pending state.”
State recognition results of some monitored devices.
Positioning of thermally abnormal areas
Extraction of target area
In order to restore the characteristics of original area to the maximal extent, the best way is to extract the template from the original image. Substation reactor is taken as an example; first, the segmented binary image is multiplied with gray image. This process is essentially the multiplication of corresponding points of the matrix, and the extracted target area is shown in Figure 29. And the gray value of the target area is consistent with the original image.
Extraction of reactor.
According to Figure 29, the minimum circumscribed rectangular of the extraction area in Figure 30 can be marked, and then it can be cut out as a target area for matching. The area template of the intercepted reactor is shown in Figure 31. Extraction of current transformer is shown in Figure 32.

Labeling of the minimum bounding rectangle.

Target area.

Target area of current transformer: (a) The first abnormal area and (b) the second abnormal area.
Positioning of target area based on feature point matching
In the field of target positioning based on feature matching, local invariant feature is the most widely used at present. Local invariant features are insensitive to changes in image size, rotation, angle, and illumination variation.21,22 Good match ability can be maintained. Therefore, SURF feature points are adopted as matching tools in this section. The flow of this algorithm is as follows:
Feature points of full maps and specific target areas are detected and described by SURF algorithm.
Euclidean distance is employed for rough matching based on the nearest neighbor distance ratio for feature points.
The matching pair that does not belong to target feature points is removed, and fine matching is completed.
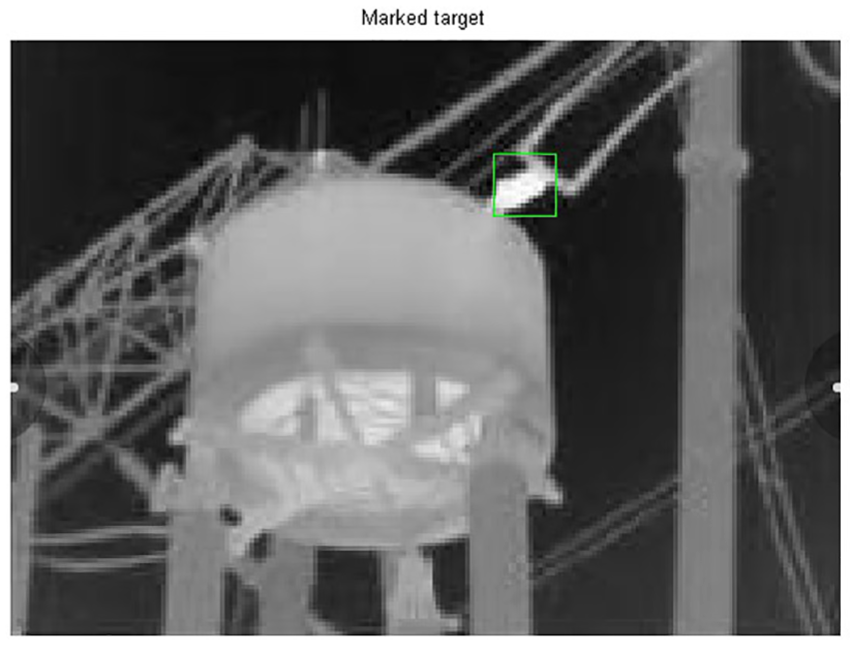
The target is extracted and labeled in the image.
Based on the above flow, the results are shown in Figure 33.

Region positioning based on SURF algorithm: (a) SURF feature points in area 1, (b) SURF feature points in equipment area, (c) rough matching, (d) fine matching, (e) location result of area 1, and (f) location result of area 2.
SURF feature points of target area and the image are detected in Figure 33(a) and (b). A rough matching in Figure 33(c) is made. In Figure 33(d), the feature point pairing group that does not belong to target is removed, and the positioning of the target in Figure 33(e) is finally completed. Area 2 positioned in the same way is shown in Figure 33(f). However, it can be seen from Figure 33(a) and (b) that this type of feature point is located at the edge of the target where gray level changes drastically. However, for central area of the equipment in Figure 34 and tiny size area in Figure 35, this method may fail due to limited amount of feature points, like in Figure 36.

Central area of equipment.

Surf points of target.

Failing match.
Area template match positioning based on correlation operation
The image template matching based on correlation operation is actually to slide the template image A on image B to be searched. Bi,j is a subimage covered by template A. i, j is the coordinates of pixel in the upper left corner of subimage. The position of target is determined according to correlation function.23–26 The expression for measuring the similarity between A and Bi,j is shown in equation (14)

where M and N are the size of images to be searched, i and j are pixel coordinates. Its expansion form is in equation (15)

The first term in equation (15) denotes the energy of the image covered by template, and the last term which is a constant is the energy of the template, regardless of the location of template. The middle part is the cross-correlation item between the covered image and the template which is related to the position of template. Only if template A is matched with Bi,j, the maximum value can be obtained. So, similarity measurement of the correlation function is as follows
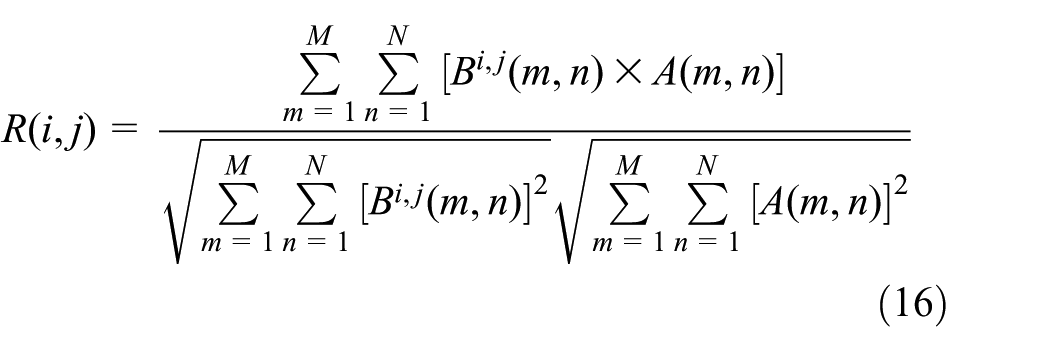
According to the theory, the template shown in Figure 28 is positioned, and the matching is shown in Figure 37.

Matching effect based on the original template.
From Figure 37, it can be seen that there is a large deviation in the positioning of left region, because the direction of the gray feature of this region is not obvious and the complete edge information is lacked. In order to ensure that feature information of the template is maximized and matching accuracy is improved, the original minimum bounding rectangle is employed as a template and shown in Figure 38. The positioning is shown in Figure 39. It can be seen that the matching accuracy is improved effectively.

Improved regional template of current transformer: (a) first abnormal area and (b) second abnormal area.

Area positioning of current transformer template matching.
Compared with feature point matching, the proposed method has higher positioning accuracy on central area and weak small target. The positioning in Figures 34 and 35 is shown in Figures 40 and 41.

Positioning of central area in current transformer.
Positioning of target area of reactor.
Conclusion
In this article, regional thermal state diagnosis of substation equipment is carried out with data analysis and calculation based on infrared image. First, an infrared weak target extraction method based on local variance mapping and genetic algorithm is used to segment the region with abnormal thermal state. Then, the relationship between gray parameters and temperature parameters is established. Finally, thermal state classification and diagnosis of equipment are realized by the modified relative temperature difference method. In addition, image matching method is also employed to achieve the positioning of monitored area. Throughout the whole research process, potential difficulties of each stage have been fully considered and corresponding countermeasures have been proposed. The aim is to improve the accuracy of state diagnosis and fault tolerance which also makes thermal state diagnostics more practical.
In the future, the multi-angle image acquisition picture diagnosis of the device can be enriched, and the fault tolerance rate of the fault diagnosis is further improved. In addition, the hardware transmission channel of the image data should be optimized to capture the actual thermal state of the device. The most important aspect is to upgrade the algorithm and procedures to improve the efficiency and accuracy of the diagnosis.
Footnotes
Handling Editor: Wen-Hsiang Hsieh
Declaration of conflicting interests
The author(s) declared no potential conflicts of interest with respect to the research, authorship, and/or publication of this article.
Funding
The author(s) disclosed receipt of the following financial support for the research, authorship, and/or publication of this article: This work was supported by the National Natural Science Foundation of China (Grant No. 61703329).