
Abstract
To realize the optimal deployment of online monitoring equipment at the edges of substations under the cloud-edge collaboration framework, an optimal deployment model of edges considering spatial constraints is proposed. In the model, the constraints including edge deployment point, line of sight, as well as device pose, etc. are taken into account. To achieve the one-to-many collection of the deployed equipment, a mathematical model is constructed with the objectives of minimizing the shooting distance and the number of edge equipments. And an archive based multi-objective simulated annealing algorithm based on improved trending Markov chain (IAMOSA) is proposed to solve the problem. This algorithm utilizes greedy clustering to initialize deployment points, and the improved disturbance step length with tendency is used to search the neighborhood space. Besides, polynomial fitting Pareto front is also used to select and guide the Markov chain and archive population. Finally, the feasibility and effectiveness of the proposed model and algorithm are verified through an experiment of optimal deployment of the edge equipments in a certain substation.
Keywords
Introduction
The industrial Internet of Things (IoT) has brought about an industrial technological revolution. As front-end data sensing means, cameras, sensors, and other sensing devices are the key component of IoT. 1 Under the above background, State Grid and Southern Power Grid of China incorporate the planning of building the IoT for electric power into the agenda of national intelligent development, in which the full lifecycle of electric power will be integrated into the perception management of the IoT, so as to realize the real-time, virtualization, and intelligence of the electric power network.2,3 As a component of the power Internet of Things, substations are crucial intermediate links in power transmission. It will result in operational failures of substation equipment and lead to power outages if the operating status of the substation equipment cannot be monitored in a timely manner. 4 The numerous monitoring points of substation equipment as well as the incomplete online monitoring makes the task of equipment inspection of great complexion, which further results in the failure of the timely and efficient inspection of equipment inspection points by traditional manual inspection. As a consequence, a series of problems such as low efficiency, missed inspection, and incorrect inspection could be caused. 5 Therefore, how to utilize perceptive devices to efficiently collect real-time data from substation equipment monitoring points and provide effective data support for substation monitoring is an important part of substation control.
Currently, substation equipment inspection and edge computing used in the electric power Internet of Things have been studied in a lot of researches, and these researches focus on cloud-edge collaboration framework and their specific applications, and robot based substation equipment inspection. Since the large number of equipment monitoring points and the limitations of spatial constraints and environment constraints in substations, there are still some difficulties as follows in the deployment of the substation edge equipments:
(1) There is a lack of research on edge deployment issues under the demand for large-scale monitoring point data collection in substations.
(2) The robot based substation equipment monitoring method is constrained by the environment and lacks real-time.
(3) The edge erection should not interfere with existing substation equipment, but should be placed in a blank site to facilitate the equipment maintenance and management of edge equipment.
(4) The image quality of cameras affects the edge equipments when shooting the target monitoring point. The shooting distance should meet the requirements of the image quality of cameras, the effect of whose rotation angle on the shooting target monitoring point should be considered as well, such as dead angle.
(5) In order to reduce the cost of deployment and meet the requirements of image quality, both of the deployment number of edge equipments and their distances from the target monitoring point should be small.
(6) If there is one or more obstructions at the monitored target points in the substation environment, the edge equipments should be rationally laid out for the shooting of the target points.
Aiming at solving the above problems, an effective method for solving the optimal deployment of substation edge equipments considering spatial constraints under the cloud-edge collaborative framework is developed in this paper. In the method, a mathematical model to reduce deployment costs, control deployment quantity, and shooting distance of edge equipments considering the constraints of equipment in substation field on edge equipment shooting and road network environment is established. Besides, an archive multi-objective simulated annealing algorithm based on trending Markov chain (IAMOSA) is presented to solve the problem. Furthermore, an example of a certain substation is used to verify the effectiveness of the edge online monitoring equipment deployment optimization. The main contributions of this study are as follows:
(1) Aiming at the issue of camera shooting of target monitoring points in complex spaces, a multi-objective optimization model including minimizing the shooting distances and the number of edge monitoring equipments is developed, in which the constraints including the positions of the deployment points, the camera sightline, and the PTZ angle range are taken into account. According to the above model, the optimized solution will achieve monitoring of multiple target points by one edge device.
(2) To address the above model, an IAMOSA is proposed. In IAMOSA, the greedy clustering rule is used to initialize the archive. In addition, the Markov chain based on perturbation tendency and selecting non-dominant solutions based on archive in polynomial fitting front are also designed to improve the algorithm.
Literature review
Substation equipment inspection
At present, most substations use robots to inspect substation equipments. For example, Wang et al. 6 presented an autonomous robotic system composed of a robot and a data center that can inspect substation equipments. Chen et al. 7 proposed a method of multi-mobile robots collaborative full area coverage inspection and multi-task points collaborative inspection using improved biological excitation neural network algorithm and priority heuristic algorithm, achieving-multi robots collaborative inspection. Lu et al. 8 established a path planning model with the goal of minimizing duration by analyzing the pose constraints of cameras when inspection robots measure the temperature of the target points in the network. They proposed a path optimization method based on improved ant colony algorithm as well as a method for selecting inspection stop points based on greedy clustering. To realize automatic calibration of the inspection points for the substation inspection robots, Wang et al. 9 proposed a spatial relationship based method for automatically generating inspection points for substation inspection robots to improve the intelligence of equipment inspection. Rodrigues et al. 10 proposed that in addition to optimizing edge servers, attention should also be paid to the deployment of edge servers. They proposed a server deployment strategy based on machine learning in 6G IOT environment and confirmed that optimizing edge deployment also has good improvements. In the research of Qin et al., 11 a mobile-based Intelligent Tracking Framework (MITF) using inspection robots was developed to inspect substation equipments. In the MITF, a robot is integrated with a camera and thermal infrared imager sensors that have been collectively designated as workload. Aiming at solving the problem of improving the maintenance efficiency of gas-insulated switchgear (GIS) in substation system, Yan et al. 12 proposed a basic configuration of a GIS equipment maintenance robot with smart structure, convenient control, and stable motion characteristic. Zhang et al. 13 designed and developed a robust and stable robotic system for inspecting the substation equipment without the involvement of workers.
In the above researches, although the robot inspection improves the inspection efficiency, there are still problems such as the inability to obtain equipment point data in real time, the inaccurate positioning of inspection points, and the overdue adjustment time. In addition, the analysis of visual images of equipment points mainly adopts centralized cloud computing mode. On the one hand, it increases the load of cloud computing. On the other hand, it is vulnerable to delay and packet loss caused by bandwidth, which reduces the real-time and effectiveness of data collection of monitoring points of substation equipment.
Edge computing used in the electric power Internet of Things
Edge computing, as a new mode of analysis and calculation at edges, is widely used in the electric power Internet of Things. For example, Zhou et al. 14 proposed a collaborative optimization method of cloud-edge distributed resources and distribution networks based on multi-level collaboration, combining cloud-edge collaboration and 5G technology with electric power business needs. Si et al. 15 proposed a centralized-distributed joint control model for cloud-edge collaborative data processing structure to solve the problem of large-scale data collection and their access to power grids. Ma et al. 16 built an electric power visual data collection and management framework for cloud-edge collaboration based on edge computing, and gave typical applications such as patrol inspection. Cai et al. 17 proposed a perceptual adaptive data processing method that combines local management with cluster management for replica management, reducing the average processing time of the dataset by 33.33%, proving that cloud-edge collaboration schemes can effectively improve the data processing speed. Shao et al. 18 taken the unmanned aerial vehicle (UAV) inspection business scenario in the electric power IoT based on edge computing as the representative, and proposed a two-stage business collaboration computing mechanism including resources allocation and task allocation to optimize the business delay and energy consumption of UAV by decoupling the complex correlation between resource allocation and task allocation. Aiming at solving the problem of a large amount of redundant data in the process of large-scale acquisition of Internet of Things sensors, Liu et al. 19 proposed a frequency adaptive data sensing method based on revolving gate algorithm for STM32 power safety data acquisition system.
In summary, the existing researches focus on cloud-edge collaboration framework and their specific applications, while there is a lack of research on edge deployment issues under the demand for large-scale monitoring point data collection in substations. Therefore, how to reasonably deploy edge devices has become a problem that urgently needs to be dealt with in the cloud-edge collaboration of substations.
Applications of meta-heuristics
The optimization problem studied in this research is a complex combinatorial optimization problem with multiple constraints, which has been verified to be NP-hard. To address this kind of problems, meta-heuristics are the most commonly used method. For instance, Fu et al. 20 designed a new multi-objective brain storm optimization algorithm incorporating stochastic simulation approach to minimize the makespan and the total energy consumption of distributed permutation flow shop. Matai et al. 21 proposed an improved SA to solve the multi-objective facility layout problem. Lamba et al. 22 designed mixed integer nonlinear programming methods and SA to solve dynamic layout optimization problems for small-scale and large-scale manufacturing systems, respectively. Song et al. 23 proposed an improved immune genetic algorithm (GA) to address flexible job shop scheduling problem (FJSP) with batch processing. Shao et al. 24 designed a discrete particle swarm optimization (PSO) to solve FJSP with three optimization objectives. Fu et al. 25 proposed a master-slave GA to solve the parallel machine scheduling with dynamic resource allocation under the objective of minimizing the makespan. Ma et al. 26 proposed a brain storm optimization method with particular multi-objective search mechanisms (MOBSO) to address the home health care scheduling and routing problem (HHCSRP). In addition to the above algorithms, meta-heuristic algorithms artificial bee colony (ABC), 27 grey wolf algorithm (GWO), 28 differential evolution algorithm (DE), 29 tabu search (TS) 30 have also been developed to solve different complex combinatorial optimization problems.
In summary, various meta-heuristics have been developed to solve different combinatorial optimization problem including production scheduling problem, facility layout optimization problem, routing optimization problem, etc., which provide many optional methods for conducting research on the problems in this paper. However, different algorithms perform differently in solving different problems. Therefore, it is necessary to design a suitable algorithm based on the characteristics of the problem in this paper and the existing researches.
Problem description and model establishment
Problem description
Considering the different orders of the substation patrol robot’s assignment of task points, the monitoring target cannot get information in real time. At the same time, the inaccurate positioning of the robot makes the target to be re-positioned, the angle of the picture is too low, and occlusion is easy to occur. By erecting the fixed height edge devices, multiple monitoring point targets can be photographed and identified to achieve the purpose of real-time monitoring. This paper mainly studies the deployment of the fixed edge devices, which depend on the PTZ (Pan-Tilt-Zoom) turning at the deployment point to complete the monitoring tasks of several target points around it sequentially. The strategy of this study is to deploy fewer devices and shoot the farther target at a smaller distance, that is, to achieve the requirements of good shooting effect and low deployment costs for multi-objective task monitoring by selecting deployment locations.
The problems of online monitoring equipments at the substation edges are described as follows:
Generally, the on-site environment contains multiple roads for the installation of edge equipments. Among which the road node set is
Specifically, as shown in Figure 1, if the edge device

Diagram of the edge equipment monitoring.
In order to clearly describe the edge device deployment problem studied in this paper, we make the following assumptions for the edge deployment environment:
(1) The influence of the equipment sizes on the shooting range is not considered. In order to facilitate the calculation, the geometric center of an object to be measured is taken as the monitoring point.
(2) The locations of the monitoring points are randomly distributed. Therefore, it is assumed that there are at least one or more edge devices in the range of visibility near any monitoring point for monitoring.
(3) Ensure that a single task is issued completely, and only one device is allowed for each shooting recognition target.
(4) Considering the influence of obstacles on the sightline, and simplifying the shape of obstacles. In this research, we regard the cross section of obstacles as a circle, and the obstacles are higher than the deployed equipment.
Mathematical model
Symbol description
(1) Sequence number
i: The sequence number of temperature measurement target points,
k: The sequence number of edge deployment points,
m: The sequence number of obstacles,
ki: The sequence number of temperature measurement targets of the edge deployment point
(2) Parameters
S: Edge deployment point set
Objective function
As mentioned above, the edge deployment mainly considers the data collection accuracy of the monitoring point as well as the equipment deployment costs. That is, in order to obtain a smaller equipment deployment costs, it is necessary to deploy a smaller number of edge devices in the substation environment and be as close as possible to the object captured. As a result, the edge deployment problem in this paper can be described as a multi-objective optimization problem:


The objective function (1) describes the shortest total distance of the farthest targets captured at all deployment points, and the objective function (2) indicates the minimum number of the deployment points.
Constraint conditions
(1) The decision variable constraints
The decision variables


Constraint (3) states that all monitoring points should be photographed by deployment points, that is, the total set of shots is equal to the set of monitoring points. Constraint (4) indicates that each monitoring point can only photographed by a single deployment point.
(2) The edge deployment point constraints
Since the deployment location of the edge equipments does not affect the existing environment on site, the edge equipments should be deployed on the edges of the roads of substations to avoid the difficulty of installation and maintenance. Therefore, the deployment points randomly generated within the area are corrected to the nearest specific road, and the following constraint is met:

Constraint (5) states that all deployment points should be on the undirected edges
Draw a perpendicular from the current point
Divide the road section with the road nodes A, B, and C, and determine the coordinate point D of the edge deployment.
Determine the vector
Traverse all line segments, determine the closest line segment to the deployment point, and replace this point with a perpendicular foot point to complete the correction.
(3) The sightline constraints of edges

Diagram of correcting the deployment points.
Due to the existence of the obstacles and other objects in the on-site environment of substations, it is necessary to consider whether the obstacles will block the sightline of the deployment points to the monitored target, and to analyze the possible situations of taking photos during the edge deployment process. Assuming that the obstacles are high enough, the deployment points are in the coverage of the road network, and the target points are outside the road network, the on-site deployment environment can be divided into three scenarios as shown in Figure 3.
(4) The pose constraints of the edge PTZ equipments

The position conditions of the deployment points and the monitored points. (a) The straight line MN formed by the deployment point M and the monitored point N do not intersect, that is, the monitored target N can be seen from the deployment point M. In this situation, the vertical distance from O to MN is greater than the radius of the circle R corresponding to the obstacle, which is the basis for determining whether the obstacle is situation (a) or not. (b) The straight line MN intersect, and the intersection points are on the extension line of segment MN, that is, the monitored target N can also be seen from the deployment point M. In this situation, the vertical distance from O to MN is less than the radius of R, and ∠ONM is obtuse angle, which is the basis for determining whether the obstacle is situation (b) or not. (c) The straight line MN intersect, and the intersection points are on the segment MN, that is, the monitored target N cannot be seen from the deployment point M. In this situation, the vertical distance from O to MN is less than the radius of R, and both ∠OMN and ∠ONM are acute angle, which is the basis for determining whether the obstacle is situation (c) or not.
The camera can rotate around the horizontal axis and the vertical axis with PTZ, in which the rotation range around the vertical axis is
In order to clarify it clearly, the following definitions are introduced: The coordinates of the edge deployment points
Therefore, an edge deployment point and the pitch angle of PTZ should meet the following constraints:


The constraint condition (6) shows that the shooting angle of PTZ should in its range of viewing angle, and constraint condition (7) shows that the shooting distance should be within the visual range.
Archiving multi-objective simulated annealing algorithm based on improved tendency Markov chain
Algorithm flow chart
The edge deployment optimization problem is an NP-hard problem, which considers the uncertainty of the location and number of the edge devices. SA is an evolutionary algorithm inspired by the annealing process of solid materials, which is easy to implement and has strong adaptability. In addition, compared with classical swarm intelligence optimization algorithms such as particle swarm optimization (PSO) and ant colony algorithm (ACO), SA has the ability to avoid falling into local optima and is suitable for solving the complex combinatorial optimization problems mentioned above. Therefore, based on the original archived multi-objective simulated annealing (AMOSA) algorithm,31,32 this paper proposes an archived multi-objective simulated annealing algorithm based on the tendency Markov chain (IAMOSA) drawing on the tendency of the particle swarm optimization algorithm with multiple Markov chain populations being designed to form the particle swarms, so that the algorithm has high search efficiency. It produces a certain tendency under the condition of ensuring the randomness of the solutions. Besides, there are many obstructions in the monitoring process of the substations, and the optimal point selection of multiple monitoring points for a single edge device is a multi-constrained linear problem. Therefore, the number of the edges, the coordinates of the edge deployment points as well as the shortest measurement distance from the farthest measurement position are emphatically concerned in this paper. The algorithm flow is shown in Figure 4. The main steps of the proposed algorithm are as follows:
(1) Initializing related parameters: the initial temperature
(2) Initializing population: During the initialization,
(3) Greedy clustering operation is performed on each deployment point. In this operation, the distances between each deployment point and all monitored points are calculated, and then determine the number of target monitoring points that can be observed at each deployment point based on sight-distance range and angle range of PTZ. Arrange the number of observable monitoring points at each deployment point in ascending order. Traverse the observable monitoring point set for each deployment point, if a monitoring point in the set can be observed by another deployment point with more monitoring points, then this monitoring point will be removed from the current monitoring point set, else it will be retained. Finally, the fitness of each individual is calculated based on the clustering operation and monitoring distances.
(4) Dominance evaluation: The concept of dominance is used to calculate the acceptance probability of the new solution, that is, the dominance is calculated according to the following formula:


The flow chart of IAMOSA.
In formula (8), a and b are two different solutions, M is the number of objectives,
(5) The selection probability of simulated annealing
Select the current solution randomly from the archive. The current solution undergoes a change to generate a neighborhood solution, which is a new solution. According to the dominance relationships between the new solution and the old solution, the new solution and the solutions in the archive, there may be three kind of probability selection scenarios as shown in Figure 4. The calculation methods of the values of the acceptance probability is as follows:

Where

Where

Where
Algorithm improvement
Markov chain based on perturbation tendency
In the original AMOSA, it generates a random solution around the current solution by perturbing the current solution. Due to the fact that the original simulated annealing is a self-modification of a single individual during the evolution process, the search has great uncertainty. Simultaneously, the unknown search range also makes the original algorithm possess poor search performance in the neighborhood area, with a high probability of individual mutation.
In order to improve the above defects, in the algorithm proposed in this study, new solutions are generated during the evolution of Markov chain population, and a trend chain population is formed according to the local optimal fitness. The direction close to the optimal result is recorded as the beneficial direction, while the direction far away from the optimal result is recorded as the damage direction. When calculating the fitness, determine the current trend chain for the reference of the next disturbance. In the improved algorithm, the fitness of the mutation individual generated by the disturbance of the current solution is calculated, and the distance between each position of the individual and the target solution should also be determined. If the fitness calculated after the mutation of the current position is closer to the current optimal fitness direction, the value recorded as the current position of the trend chain is +1. Otherwise, if the fitness calculated after the mutation of the current position is further from the current optimal fitness direction, the value recorded as the current position of the trend chain is −1. Specifically, when there is no trend change in the current position of the new individual, the value of the current position in the trend chain is 0. The above description is shown in Figure 5.

The forming process of the trend chain.
Guiding the step direction of the next disturbance according to the generated trend chain, for example, the current position value +1 indicates that the current step direction is the positive direction of the target solution, while the current position value −1 indicates that the step direction of the current solution is the opposite direction of the target solution. This method approaches the direction of the target solution, as shown in Figure 6.

The process of the trend chain affecting the perturbation step length.
The current solution individual undergoes a mutation within the length of the Markov chain, and each mutation undergoes a random mutation based on the probability, or a corresponding mutation in the direction of the trend chain. In this way, it not only ensures the search of individuals within a wide area, but also enhances the possibility of individuals searching for the current local optimal solution.
Selecting non-dominant solutions based on archive in polynomial fitting front
After lowering the temperature, IAMOSA randomly selects leading Markov chains and selectively determines Markov chain individuals for archiving operations for the non-dominated solution set front. This paper calculates the polynomial fitting front, and then the deviations between the non-dominated solutions and the fitting curve are calculated. In this research, Taylor expansion polynomial is used to fit the current non-dominated solution set front, and Manhattan Distance is used to measure the deviations between the fitting points and the Taylor polynomial fitting curve. After standardizing the front deviations, selecting the minimum fitting deviations, which is the non-inferior solution in the non-dominated solution set near the origin. The calculation method and standardization method of deviations are as follows:


Where
Finally, the K-means clustering analysis will be performed on the standardized fitting deviation array sets mentioned. In this operation, the number of array sets greater than
Experimental results and analysis
An experiment based on a certain substation site environment of China is performed in this Section. In the experiment, the proposed IAMOSA is used to optimize the deployment of detection devices according to the network and monitoring point information of the high voltage area, main transformer area as well as the medium and low voltage area in the substation. As shown in Figure 7, the substation covers an area of 140 m × 100 m, containing 313 monitoring points. The established road network consists of 18 road nodes and 25 road segments. The substation contains the high voltage area on the left, the middle and low voltage area on the right upper, along with main transformer area the right lower. Besides, 59 obstacles of different sizes are founded in the monitored area, which are replaced by an external minimum circle for description.

The road network of the substation site.
The known information of the road is input, and the edge deployment results under the road network planning are obtained through iterative calculation of the proposed IAMOSA. As shown in Figure 8, a total of 14 edges are deployed, which are identified as × in Figure 8. The points photoed within the same edge are displayed in the same color, whose maximum distance is 27.28 m, which meets the requirements of the camera sight distance (≤30 m).

The edge deployment situation.
The problem studied in this paper is a NP-hard multi-objective combinatorial optimization problem. In the existing researches, MOPSO and NSGA-II are two effective multi-objective swarm intelligence optimization algorithms for solving this type of problem. Therefore, in this research, MOPSO, NSGA-II, and the original algorithm AMOSA are selected for comparative experiment. In order to make the relevant algorithms more comparable, the termination condition of all algorithms in this experiment is set to 600 s. Besides, based on the structure of the algorithm developed in this paper and the results of running tests of the algorithm, the algorithm parameters are set as follows:
In the experiment, the obtained Pareto (Non-dominated solutions) front of each algorithm is shown in Figure 9. It can be seen that most of the solution obtained by the proposed IAMOSA are located in the left lower corner compared to the comparison algorithms, that is, most of the solution obtained by the proposed IAMOSA are better than that of the comparison algorithms for its dominant relationship advantage.
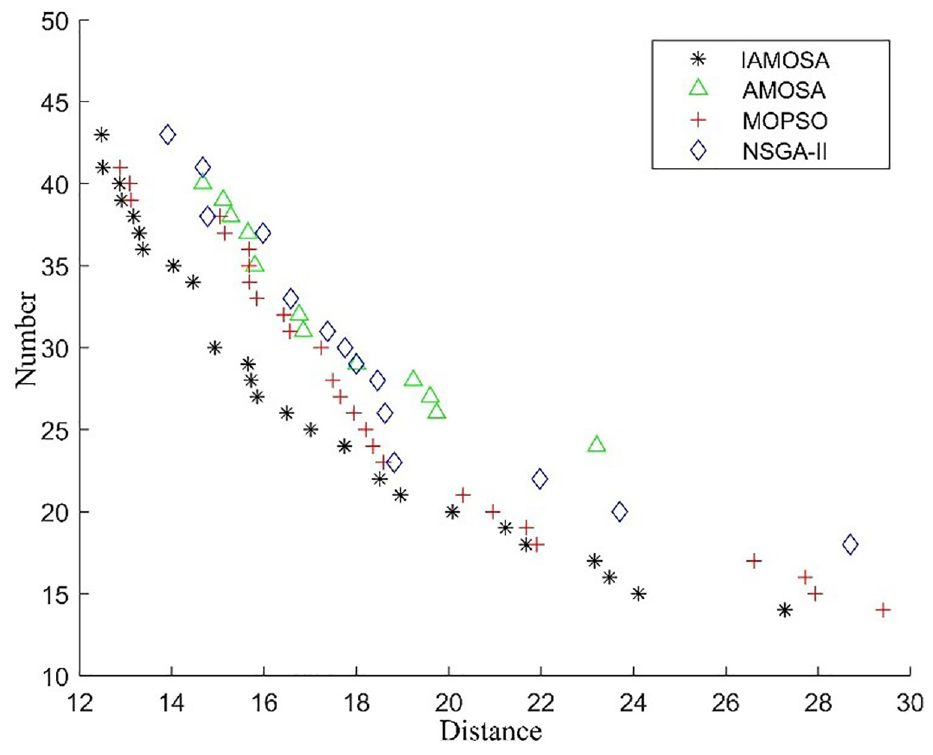
The results of comparison experiment.
In order to describe the advancement of the IAMOSA algorithm better, HyperVolume (HV) is adopted in this paper, which is a widely used comprehensive performance evaluation indicator of multi-objective algorithms. The calculation method is as follows:
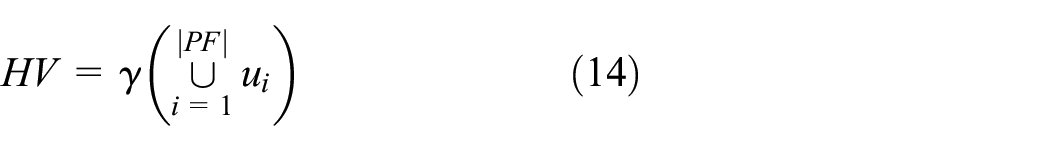
Where
Besides, the inverse generation distance (IGD) is introduced as a supplement to HV, which mainly evaluates the convergence performance and the distribution performance of a multi-objective algorithm by calculating the sum of the minimum distances between each individual in the actual Pareto front and the non-dominated solution set obtained by the algorithm. The specific calculation formula is as follows:

Where
In this paper, each algorithm runs 10 times, and the optimization results are evaluated by HV and IGD respectively to obtain the results of Table 1, along with the comparison analysis by box plot, as shown in Figure 10.
The optimized values of HV and IGD for each comparison algorithm.

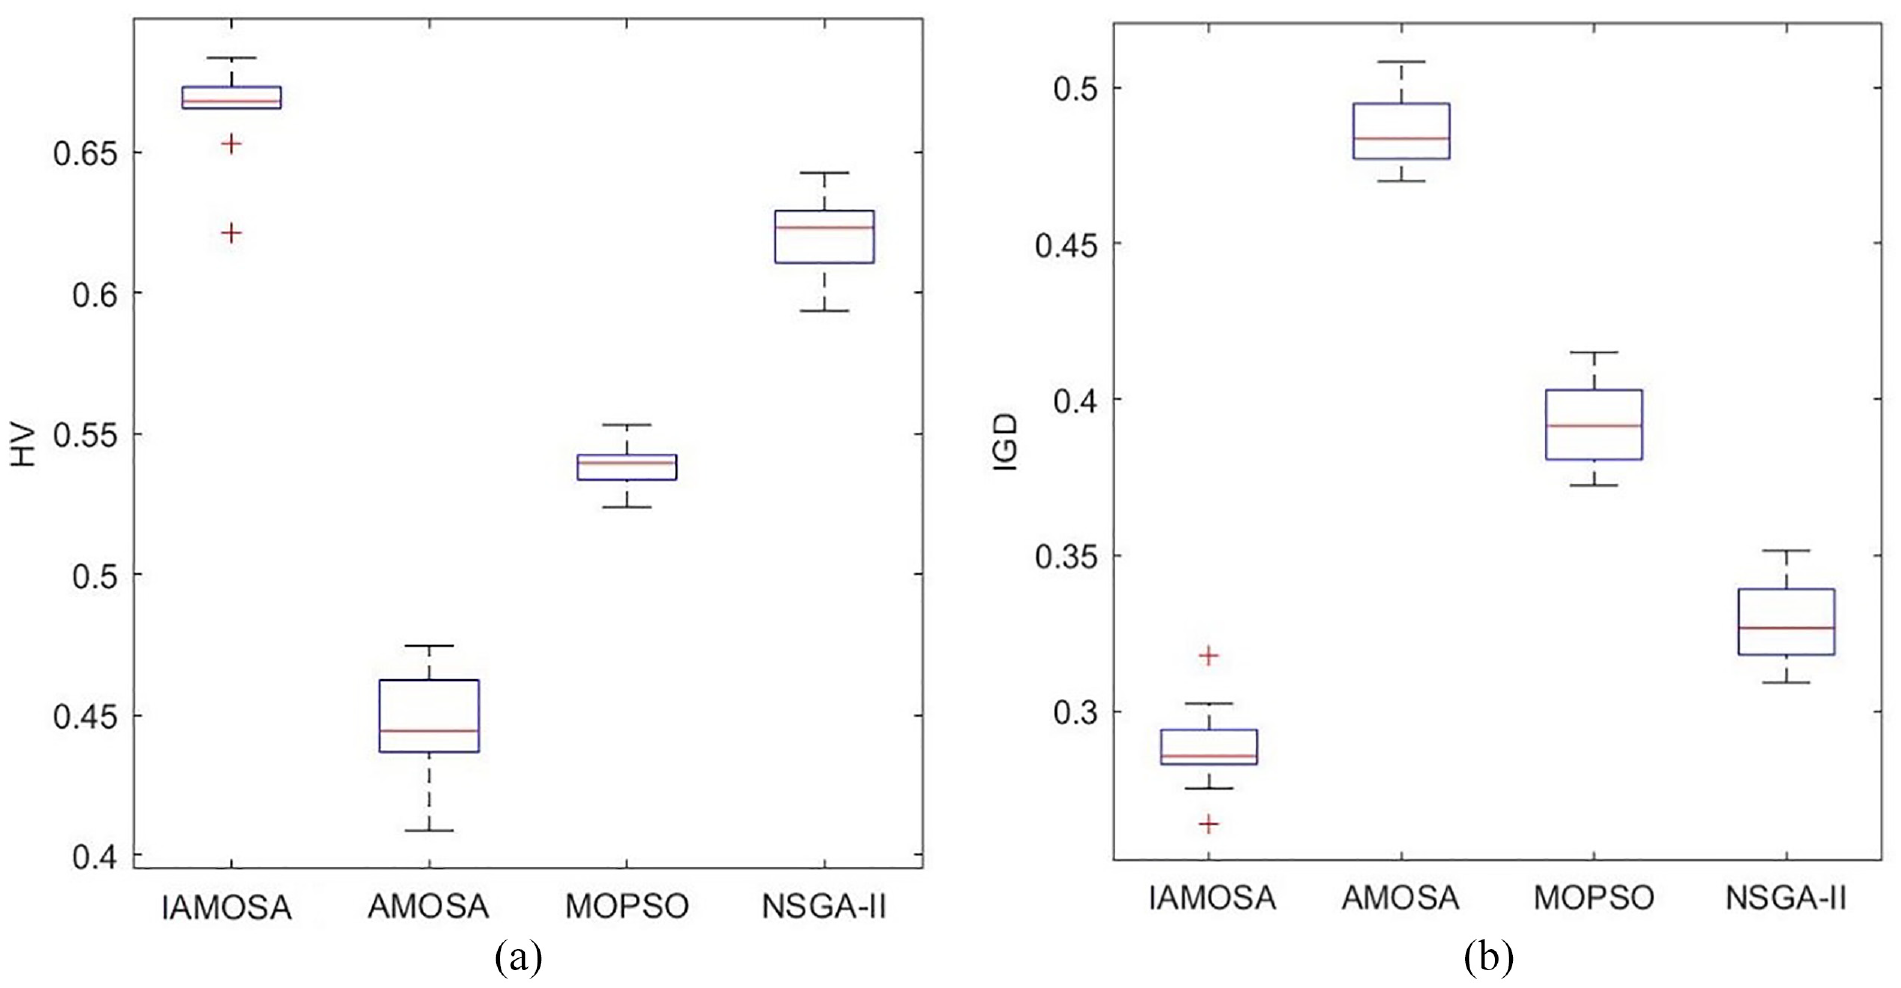
The comparison box plot of the evaluation indicators.
It can be observed from Table 1 that the average values of the HV and IGD are significantly better than that of the original AMOSA algorithm, MOPSO, and NSGA-II. It can be seen from Figure 10 that the IAMOSA algorithm proposed in this paper has a smaller deviation than that of other comparison algorithms, and some experimental results appear outside the box plot. However, the results as shown in Figure 10 still indicate that the proposed algorithm is more stable and performs better on HV and IGD than other algorithms in most cases. Therefore, the algorithm proposed in this paper is superior to other algorithms under both indicators, which verifies the effectiveness of the IAMOSA algorithm proposed in this paper.
In summary, some optimal deployment solutions of substation edge equipments can be obtained in an acceptable duration using the proposed model and algorithm, which are better than the solutions obtained by several typical algorithms. Therefore, whether in terms of time or effectiveness, the proposed model and algorithm are feasible in practical applications.
Conclusion
This paper mainly studies the optimal deployment of substation edge equipments considering spatial constraints under the cloud-edge collaborative framework. Aiming at the issue of camera shooting of target monitoring points in complex spaces, a mathematical model aiming at minimizing the shooting distances and the number of edge monitoring equipments is constructed by considering the constraints of the positions of the deployment points, the constraints of the camera sightline as well as the constraints of the PTZ angle range, so as to optimize the number of deployment equipments and deployment positions. The optimized solution will achieve monitoring of multiple target points by one edge device. To address the model, an archive based multi-objective simulated annealing algorithm based on improved trending Markov chain (IAMOSA) is proposed. In the algorithm, the greedy clustering rule is used to initialize the archive. Finally, taking the deployment of the on-line monitoring edge equipments of a certain substation as an example, the effectiveness of the proposed model together with the proposed algorithm is verified by the comparison experiments with various optimization algorithms including MOPSO, NSGA-II, and the original AMOSA. The model and algorithm researched in this paper realizes the real-time data acquisition of multiple monitoring points by a single edge equipments, improve the quality of collected data, and reduce the deployment cost of edge monitoring equipments.
In future, it will be interesting to research the following issues:
(1) The model and algorithm developed in this study have been verified to be effective for improving the quality of substation equipment monitoring and reduce the deployment cost of monitoring equipments in a certain application scenario. However, in different environments, the number of substation equipments, monitoring requirements, and factors that affect monitoring effectiveness are different, which leads to different scales and constraints of problems to be solved. Therefore, it is necessary to design optimization models with higher adaptability and algorithms with better solving performance.
(2) The operating environment of substation equipments will change over time, and the original monitoring equipment deployment solution may not meet the current equipment deployment requirements. How to optimize the original monitoring equipments deployment solution with lower deployment costs and higher deployment efficiency is another issue that needs to be studied in the future.
Footnotes
Acknowledgements
The authors would like to express their great appreciation for the valuable comments and constructive suggestions by the anonymous reviewers and the editor.
Handling Editor: Aarthy Esakkiappan
Declaration of conflicting interests
The author(s) declared no potential conflicts of interest with respect to the research, authorship, and/or publication of this article.
Funding
The author(s) disclosed receipt of the following financial support for the research, authorship, and/or publication of this article: This work was supported by the National Natural Science Foundation of China under Grant (No. 52105513), the Natural Science Foundation of Hubei Province (No. 2023AFB593), and Xiangyang of China Science and Technology Plan Project (No. 2022ABH006253).