
Abstract
This article mainly analyzes the applications of importance measures in inventory systems’ reliability. Previous importance measures are mostly developed based on Birnbaum importance; however, they are not applicable to the identification of weakness and optimization in inventory systems by considering the customer requirements for mechanical products. Based on the three-echelon inventory system structure, the corresponding reliability is analyzed under the Poisson distribution. Then three importance measures, namely, composite importance measure, mean absolute deviation, and differential importance measure, are extended to the three-echelon inventory systems. By calculating and comparing the importance values of various components, the key parameters in inventory systems can be identified to achieve the minimal cost and optimal inventory system. Finally, a numerical example is used to demonstrate the proposed method.
Introduction
The inventory optimization has always been the focus for enterprise managers. It has achieved the minimal cost and efficiency optimization. However, research mostly focuses on two-echelon inventory systems and neglects the application of importance measures in the inventory system, which represent an important tool in reliability engineering to identify the weakness and optimize the system performance. Nowadays, the study about the application of the system reliability and importance measures in an inventory system has made certain achievements.
Almaktoom 1 introduced a method of quantifying the reliability of an inventory management system. Also, a novel, reliability-based robust design optimization model has been developed to optimally allocate and schedule time while considering uncertainty associated with inventory movement. Jin et al. 2 proposed an integrated product–service model to ensure the system availability by concurrently allocating reliability, redundancy, and spare parts for a variable fleet. To reduce the additional rework cost, Lukinskiy and Lukinskiy 3 proposed evaluation of stock management strategies’ reliability at dependent demand. In this article, there is a suggested methodical approach that allows calculating the safety stock quantity at the dependent demand in view of supply chain’s reliability requirements. Manna et al. 4 focused on an imperfect production inventory model with production system reliability under two-layer supply chain management. Meyer et al. 5 analyzed the reliability of a single-stage production-storage system in meeting a constant known demand. Considering reliability as a decision variable, Sarkar 6 constructed an integrated profit function which is maximized by control theory. Selçuk and Ağral 7 jointly model the reliability and inventory problems to minimize the sum of holding and emergency shipment costs subject to a limited reliability improvement budget and a target service level. Shah and Vaghela 8 incorporated reliability as a decision variable in the model to maximize the profit function with respect to the reliability parameter.
Based on the differences in reliability evaluation,9–12 the importance measures have been used to evaluate the effect of components on the system reliability. For example, Borgonovo13,14 introduced a new sensitivity measure by relating the differential importance measure (DIM) and applied it to the economic order quantity (EOQ) inventory model. Ramirez-Marquez and Coit 15 proposed the composite importance measure (CIM) and mean absolute deviation (MAD) for multi-state systems with multi-state components. Nguyen et al. 16 presented a joint predictive maintenance and inventory strategy for systems with complex structure and multiple non-identical components. Considering the transition rates of component states, Si et al. 17 presented the definition, evaluation method, and characteristics of integrated importance measures of component states. For the semi-Markov processes and renewal function, Dui et al.18–21 discussed the influence of importance measure on system performance and its applications in aviation and other fields.
The applications of the system reliability and importance measures in the inventory models have gained some attention. However, they are used little to optimize the multiple-level inventory systems, especially the three-level inventory systems. Hence, combining the customer requirements under the Poisson distribution and three-level inventory system structure, this article extends the CIM, MAD, and DIM to applications in the three-level inventory systems.
The rest of the article is organized as follows. Section “Reliability analysis in inventory systems” analyses reliability in inventory systems. The inventory models and formulas of reliability in three-echelon inventory are briefly described in the same section. Section “Importance measures for inventory systems” derives three importance measures: CIM, MAD, and DIM, and the computational methods about various parameters of the cost function. An application is presented to illustrate the importance values and changes with parameters in section “Numerical example.” Section “Conclusion and future work” gives the conclusions of this article.
Reliability analysis in inventory systems
Inventory systems
Assume that there is a three-echelon inventory system for mechanical products, which contains m suppliers, n distribution centers, and p retailers, as shown in Figure 1.
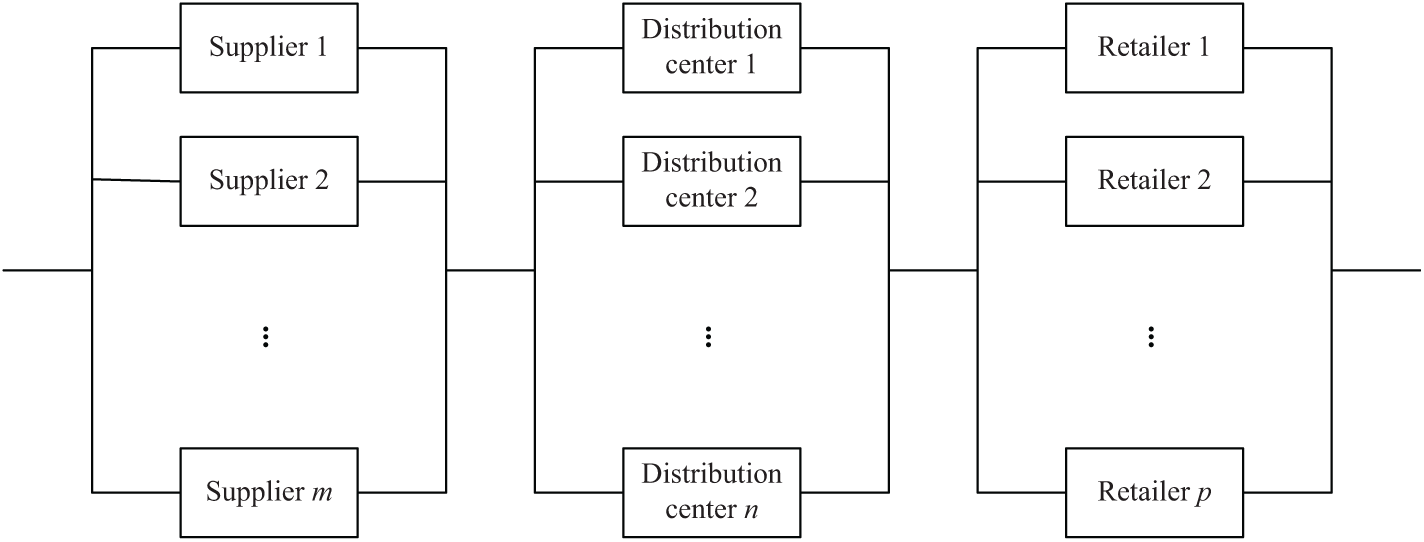
A three-level supply chain network.
In Figure 1, supplier i represents one of m suppliers. Similarly, distribution center j represents one of n suppliers and retailer q represents one of p retailers. Then we can obtain the corresponding reliability block diagram, as shown in Figure 2.

Reliability block diagram.
In Figure 2, Si represents one of m suppliers, Dj represents one of n suppliers, and Rk represents one of p retailers.
The inventory control policy of the supplier is (Q, s), in which if the stock is less than s, we will order Q quantity. The control policy of distribution center i is (Si, si), in which if the stock of distribution center i is less than si, we will order Si – si quantity. We have the following assumptions:
The customers’ demand for mechanical products meets an independent Poisson distribution. The demand intensity of the Poisson distribution of the distribution center i is
ik is a safety stock factor of the distribution center.
Holding cost per item per unit time is Ch.
Ordering cost per order is Co.
Order lead time is L.
Shortage cost due to no spare parts on stock is Cs.
Planning horizon is T.
Supplier cost
In the inventory control policy of the suppliers, using the linear regression model, we can obtain
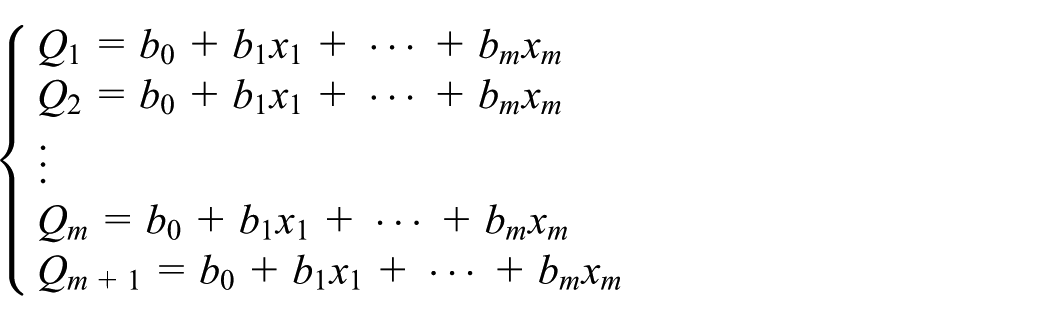
According to the existing data, we can get the value of
Distribution center cost
Ordering cost
The ordering cost of distribution centers is the product of ordering cost per order and order number given as follows:
Holding cost
The holding cost per unit time of all distribution centers is
Shortage cost
The shortage cost of distribution centers is
Thus, the cost of distribution center is

Taking the derivative of Si and Qi successively, we can get


The calculation steps are as follows:
Calculate Qi, as an estimated value,
Substituting Qi into formula (3), we can get si;
Substituting si into formula (2), we can calculate Qi;
Perform the second and third steps repeatedly to determine the value of Qi, until the two values of Qi are approximately equal.
Reliability in three-level inventory systems
In inventory management, a supply chain system is required to supply the customers’ demand. The system reliability can be understood as the probability that the inventory of the supply chain system can meet a given customers’ demand. The demand may be fixed or vary depending on the conditions in different inventory cycles.
From Figure 2, we know that the system is composed of three subsystems: m suppliers, n distribution centers, and p retailers.
If the demand is constant, then the reliability of the inventory system is given by

Assume that xi is one of the suppliers (i = 1, 2, …, m) and the demand for mechanical products follows the Poisson distribution. Thus, the reliability of xi is

Assuming that xj is one of the distribution centers (j = 1, 2, …, n), the reliability of a distribution center is

Given that xq is one of p retailers (q = 1, 2, …, p), the reliability of a retailer is

Thus, the reliability of a three-echelon supply chain system is

Importance measures for inventory systems
CIM for inventory systems
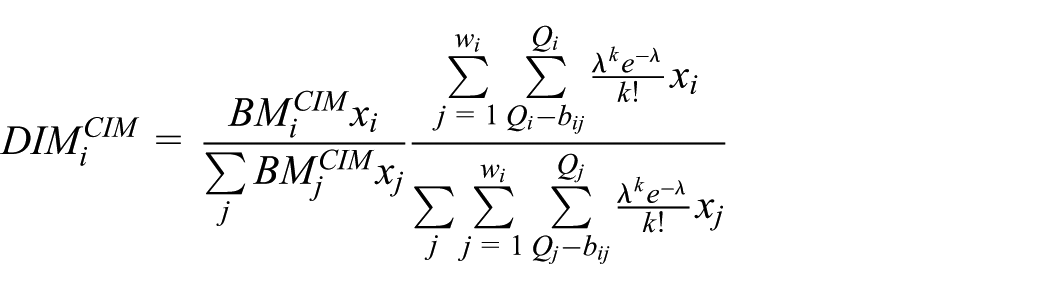
For a constant demand, the CIM generalization for Birnbaum importance measure can be expressed as
Based on the inventory systems, the CIMs of the supplier, distribution center, and retailer are

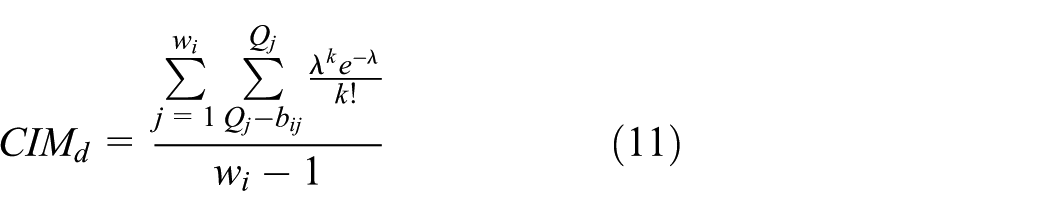

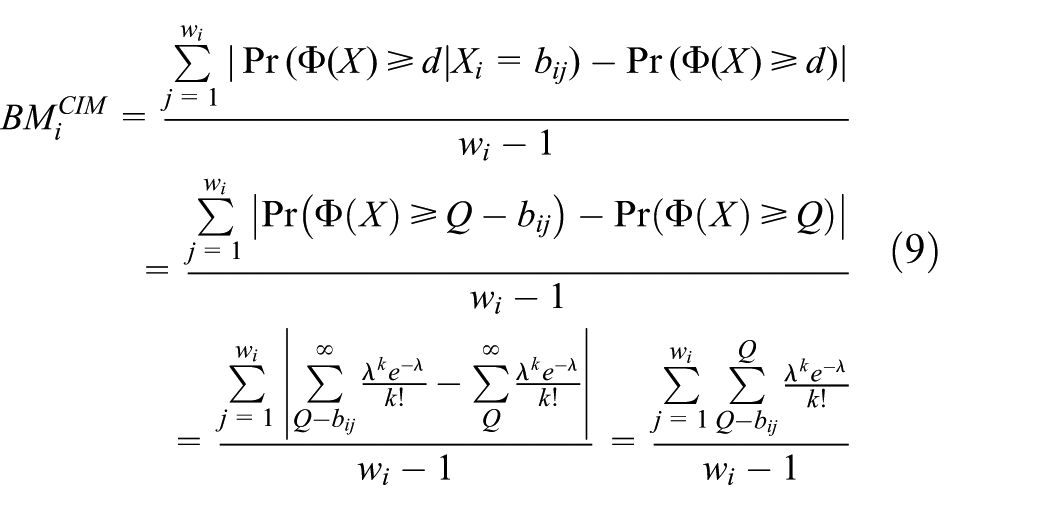
For a varying demand

where wi is the number of the states of component i, bij is the demand or capacity corresponding to state j of component i, and
Based on the inventory systems, the CIMs of the supplier, distribution center, and retailer are


MAD for inventory systems
For a constant demand, the MAD is

Based on the inventory systems, the MADs of the supplier, distribution center, and retailer are


2. For varying demand

Based on the inventory systems, the MADs of the supplier, distribution center, and retailer are

where
DIM for inventory systems
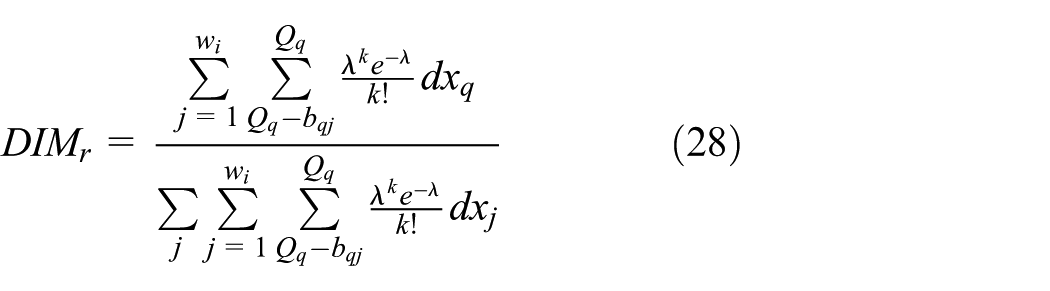
The DIM generalization can be expressed as

Then the DIM of every part is

When a small change is the same for different distribution centers xi and xj,

When the distribution centers xi and xj change by the same fraction of their nominal values,
When the metrics of distribution centers xi and xj are different, we can use
Numerical example
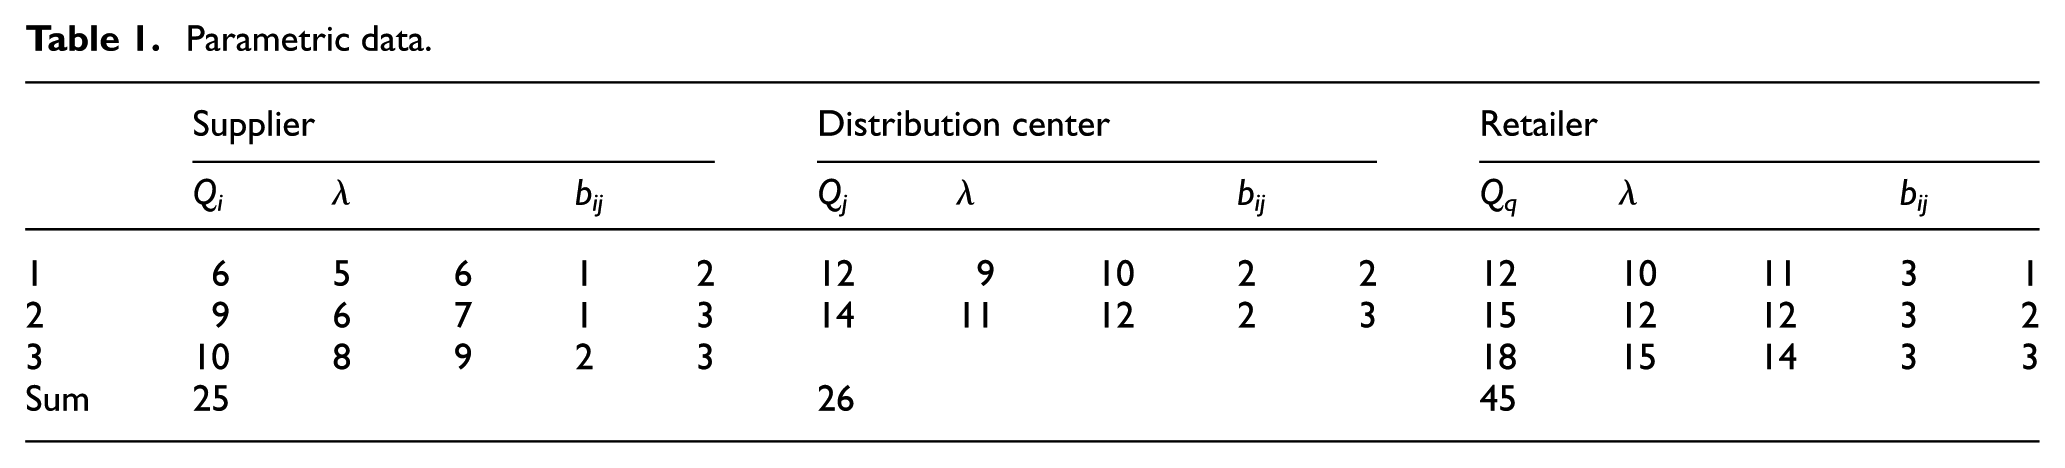
There is a three-level inventory, with three suppliers, two distribution centers, and three retailers, as shown in Figure 3. The parametric data of the supplier, distribution center, and retailer are shown in Table 1.

A three-level inventory model.
Parametric data.
Then we can calculate the values of reliability and importance, as shown in Tables 2–4.
Results of reliability.

The importance values for a constant demand.
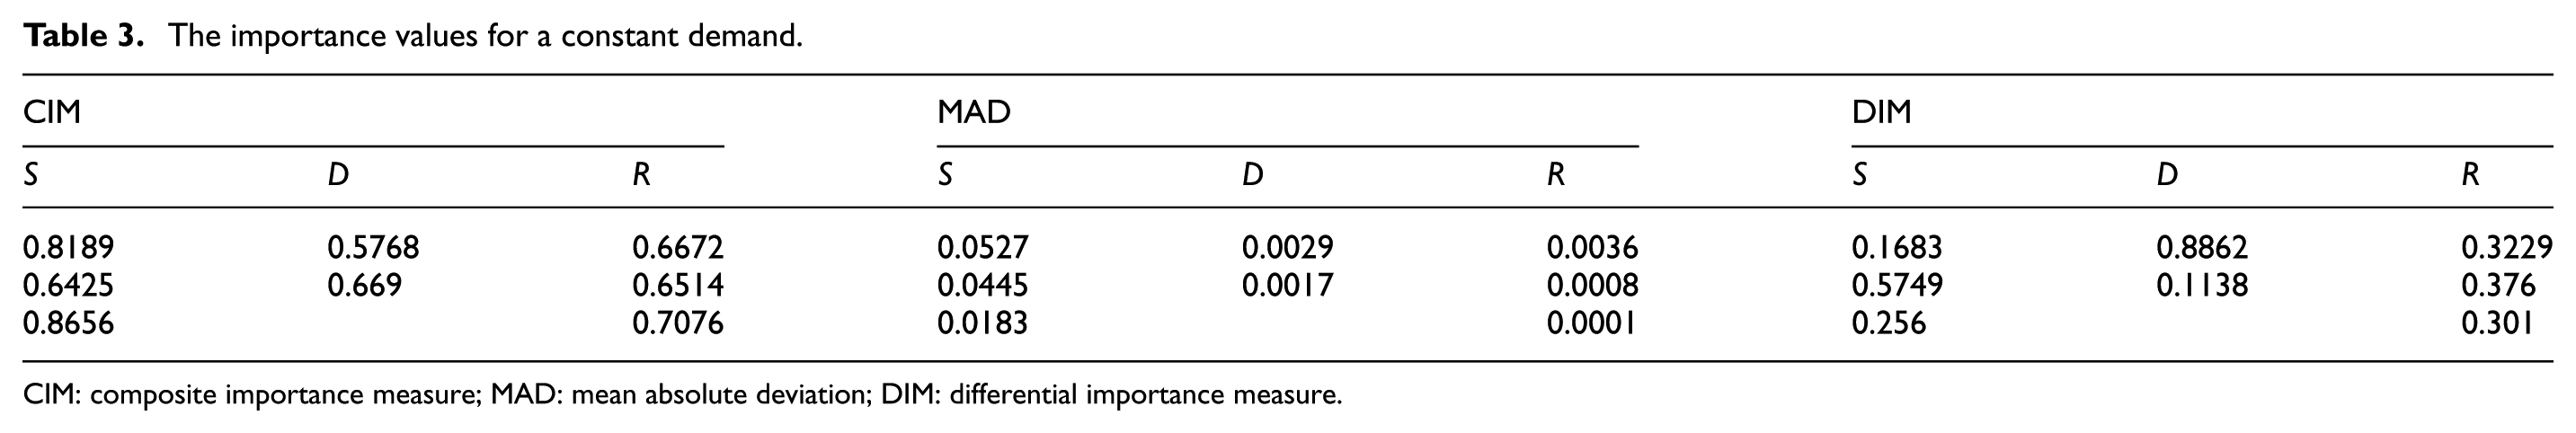
CIM: composite importance measure; MAD: mean absolute deviation; DIM: differential importance measure.
The importance values for a varying demand.

CIM: composite importance measure; MAD: mean absolute deviation; DIM: differential importance measure.
When the demand is a constant, let
For a varying demand, let
From Tables 2–4, we can apparently see whether λ is a constant or not, and the results of reliability and importance are different. For example, in Table 2, for a constant demand, the order of retailers’ reliability is
In order to better analyze the dynamic effects of various parameter changes on CIM, MAD, and DIM, we set each parameter within an interval and analyze the changes when the parameters change in their intervals, while others remain constant. Then we get the graphs in which importance changes with a certain varying parameter, as shown in Figure 4.

Importance degree changes with parameters: (a) importance degree changes with Q; (b) MAD changes with Q; (c) importance degree changes with b11; and (d) importance degree changes with λ.
From Figure 4(a), we can see that CIM and DIM show similarities in the change law, and they all increase first and then decrease as Q increases. Because the value of MAD is too small to see its fluctuation, we specially depict MAD and Q, as shown in Figure 4(b). Apparently, its change law is similar to CIM and DIM.
Meanwhile, from Figure 4(a) and (b), we also know that the order of importance in general is
In Figure 4(c), we can see that the value of importance is constantly increasing as b11 increases. Before b11 is around 9, they remain almost equal. Then the CIM grows at the fastest speed, and when b11 is more than 28, the curve change is rather slow and tends to be stable. DIM maintains a steady change rate when b11 is greater than or equal to 26. On the contrary, MAD tends to decrease after it achieves the maximum.
In Figure 4(d), when λ is increasing, the values of CIM, MAD, and DIM all climb up and then decline. The CIM and DIM reach the maximum when λ is equal to 16. MAD reaches its maximum when λ is 11, then it constantly descends and finally becomes stable.
Conclusion and future work
Based on the existing theoretical research results of importance measures and the inventory control models, the CIM, MAD, and DIM are introduced into a three-echelon inventory model. The main conclusions are as follows:
By comparing and analyzing the calculation results of importance values with the changes of various parameters, the importance grades of these parameters and the effect of each parameter on the system are identified.
An optimal inventory control and management are carried out to optimize the whole inventory system by identifying and evaluating the critical parameters in a three-level inventory control model.
This work can be extended to the analysis of integrated importance measure into inventory systems. The integrated importance measure is related to the transition rates of components. When considering the component failure rate or repair rate, we can use the measure to identify the most important component in the lifecycle for the inventory systems.
Footnotes
Appendix 1
Acknowledgements
H.D. and L.C. conceived and designed the experiments and proposed the idea of this paper; C.L. performed the experiments and analyzed the data. All authors have contributed to the editing and proofreading of this paper.
Handling Editor: Zhaojun Li
Declaration of conflicting interests
The author(s) declared no potential conflicts of interest with respect to the research, authorship, and/or publication of this article.
Funding
The author(s) disclosed receipt of the following financial support for the research, authorship, and/or publication of this article: The authors gratefully acknowledge the financial support for this research from the National Natural Science Foundation of China (Nos. 61807031, 61401403, and 71501173) and Scientific and Technological Research Project of Henan Province, China (No. 132102210560).