
Abstract
Red-light running is one of the major causes for traffic crashes at signalized intersection. In addition to traffic engineering and management measures, enforcement countermeasures are employed to encourage drivers to comply with traffic signal through the threat of penalty points and fine. However, the fine associated with red-light running is fixed no matter how many times one vehicle violates red signal during a given period. Such issue results in little deterrence effectiveness of fine for red-light running recidivism. Therefore, the objective of this study is to explore a novel model of increasing block fine structure based on the number of one vehicle committing red-light running in 1 year so as to prevent red-light running recidivism. First, using optimal partition method, the number of one vehicle committing red-light running in 1 year is categorized into a few groups that are regarded as the blocks for an increasing block fine structure. Second, the price elasticity is introduced and discussed to determine the changed number of red-light running and corresponding fine at each block. Third, an optimization model is proposed to determine the varying fine at each block and solved via the simulated annealing algorithm. After that, a case study is conducted to verify the validity of the developed model. The results indicate that this novel fine structure can effectively deter red-light running recidivism from running red signal. In addition, the fine structure established in this research not only offsets the defect of the present fine structure but also reduces red-light running to some extent.
Keywords
Introduction
Red-light running (RLR) refers to the phenomenon that a vehicle continues to proceed through the intersection after the onset of red signal. This traffic violation is the leading cause for crashes at signalized intersection. 1 RLR crashes are generally angular collisions between red-light runners and vehicles with right-of-way, which result in a great fatal and injury rate. 2 According to the Insurance Institute for Highway Safety (IIHS), 3 there were 771 people killed and an estimated 137,000 people injured in crashes in the United States during 2015 just because of RLR. Based on the statistics provided by the Ministry of Public Security, RLR led to 789 fatalities and 4227 severe injury crashes in China from January to October 2012. 1
To address RLR problem, an abundance of studies focus on conceiving countermeasures. Two main categories of them are engineering and enforcement countermeasures. The former one is used to deter unintentional red-light violators, which includes longer yellow interval, 4 improved signal visibility/conspicuity, 5 mast arm signal mounting, 6 transverse yellow decision line, 7 pavement markings, 8 advance warning systems, 9 signal countdown timer, 10 flashing green signal, 11 and in-vehicle warning system. 12 The latter one is applied to prevent intentional RLR, which consists of manual or automated enforcement. 13 Manual enforcement refers to police enforcement, while automated enforcement uses red-light camera (RLC).
Enforcement countermeasures aim at encouraging drivers to comply with traffic laws via imposing a citation, a certain penalty point, and a possible fine. 14 Since 1 January 2013, the Provisions on the Application and Use of Motorized Vehicle Driving License issued by Ministry of Public Security of China have doubled the penalty points and fine (i.e. from 3 points and a fine of 100 RMB (Renminbi) to 6 points and a fine of 200 RMB) for RLR runners. 15 The purpose of implementing this new regulation is to reduce RLR through enhancing the cost of such traffic violation.
So far, to our knowledge, only three studies have investigated the effect of an increase in penalty (e.g. demerit point and fine) on RLR. A series of experiments in Israel and San Francisco suggested that an increase in the fine sharply reduced RLR. 16 A stated preference survey in Hong Kong reported that the increased fine and demerit points prevented public light bus drivers from violating red light. 17 Based on field observation, Sze et al. 18 found that the stricter monetary and demerit point penalties significantly reduced the frequency of RLR for either short- or long term.
Despite a stricter penalty strategy decreasing RLR, its effectiveness is limited. There are two possible reasons for such problem. One reason is that the penalty points and fine are predetermined based on the committed RLR, without taking into account the negative influences of RLR. The effects may include the risk of potential collisions between a RLR vehicle and crossing traffic and the number of disturbed vehicles or traffic delay as a result of such traffic violation. Another reason is that no matter how strict the penalty strategy is, the demerit points and fine for all red-light runners are the same, regardless of their times of committing RLR. In fact, this current penalty strategy without considering the frequency of each driver committing RLR is unfair for the drivers who commit RLR only once, since they receive the same penalty as RLR recidivism who commit RLR more than once. In this way, the deterrence effectiveness of the present penalty strategy for RLR recidivism is very limited. Unfortunately, the drivers who have a history of committing RLR are more likely to violate red signal.19,20 This may cause more serious crashes at signalized intersection.
What is noteworthy is that most RLR violations are detected by RLC and punished by penalty points and fine. One issue with regard to RLC is that it hardly captures high-quality facial images of the drivers to accurately identify the actual RLR violators on account of many factors such as sun glare and windshield influence. In addition, the frontal photograph of the driver generates privacy worries that are often presented by RLC opponents. 21 The above-mentioned issue leads to license points trafficking 22 and then obviously impairs the deterrence effectiveness of penalty points. From the perspective of deterrence effectiveness, monetary fine may be better than penalty points. This probably explains the reason why till now no study is conducted to address penalty point sanction problems.
As to the first problem of fine sanction, two studies have already begun to deal with it. One study devised a new system for determining the fine on the basis of the number of impacted vehicles resulting from a traffic violation. 23 To begin with, the violation traffic is found through a violation analyzer. Then, a penalty calculator determines the total fine based on a traffic violation code number and the number of affected vehicles. Another research proposed a novel model of calculating the fine for RLR traffic violations by considering the estimated economic effect of potential RLR crashes and additional delay for crossing traffic as a result of setting all-red interval to avoid potential conflicts. 24
However, to date, to the authors’ knowledge, no studies have been conducted to address the second problem of fine sanction. Hence, this current research fills the gap through developing an increasing block fine structure for RLR traffic violation (especially for RLR recidivism) by considering the number of one vehicle committing RLR during 1-year period. The rest of this article is organized as follows. In section “Framework of an increasing block fine structure,” the framework of an increasing block fine structure is presented. Section “Model development” describes the model development, which includes classification of blocks and models of the drivers’ response to increasing block fine. Section “Case study” presents a case study using the proposed fine model. Finally, there are some discussions in section “Discussion.”
Framework of an increasing blockfine structure
An increasing block pricing structure is often utilized to determine the charge for water, 25 electricity,26,27 and gas 28 consumption. There exists an underlying theory called Ramsey pricing principles. Such rule states that the price margins should be inversely proportional to the own price elasticity of demand for the various products or services. 29 In other words, the more elastic the demand for a certain product or service, the lower the price. Ramsey pricing is used to set different prices for different customer groups based on their elasticities of demand. From this perspective, the increasing block pricing structure is used to achieve equity. 30
With respect to the fine for RLR traffic violation, there are few assumptions presented as follows: There exists a RLR traffic violation market, within which RLR runners are regarded as customers; the RLR traffic violation is deemed as a consumption goods; the number of committing RLR traffic violation is considered as the consumption quantity; and the fine for RLR traffic violation is recognized as the price for the consumption goods. In addition, each vehicle is assumed to have one driver. In such a special market, to be equitable, RLR recidivism should pay more fine than those who commit RLR just once during a certain period. Therefore, the fine for RLR is determined on the basis of the number of one vehicle committing RLR, which satisfies Ramsey pricing rule.
The increasing block pricing structure is introduced to determine the fine for RLR recidivism, which is presented in Figure 1. The increasing block fine structure comprises number of blocks, dividing points (i.e. the critical number of RLR), and corresponding fine at each block. The more RLR a driver commits within 1 year, the more fine he or she should pay.

Framework of an increasing block fine structure.
Model development
Classification of blocks
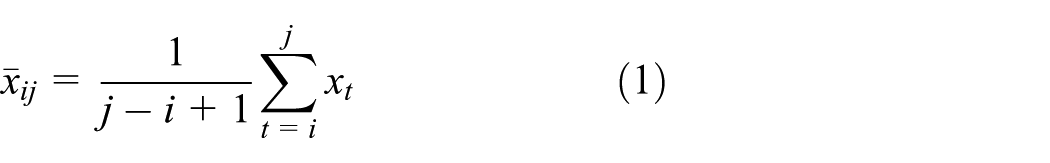
The number of one vehicle committing RLR is arranged increasingly so as to be classified into a few groups (i.e. the blocks for an increasing block fine structure). As for such sequential sample, the optimal partition method suits for clustering. Given that an ordinal sample with n observations (each observation with m attributes), there exists
Given an ordered sample
Definition of classification diameter
If one classification
The diameter

In view of the fact that many vehicles may commit the same number of RLR in 1 year, the average of such a classification

where
Hence, the diameter

Definition of loss function
Let
where the beak points
Accordingly, the loss function of such a way of partition is given by

If n and k are fixed, the smaller the
Method of optimal solution
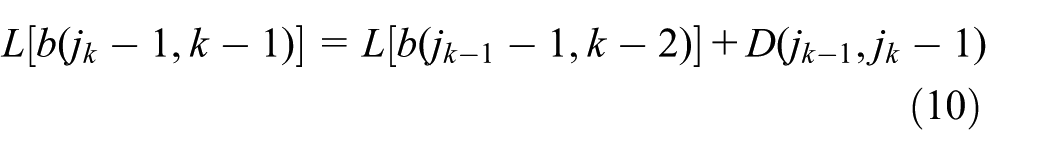
There are two recursion equations

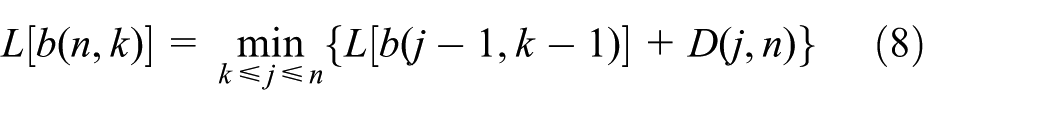
It can be seen that the optimal partition method of classifying the sample with n observations into k groups should be based on the optimal partition way of categorizing the sample with
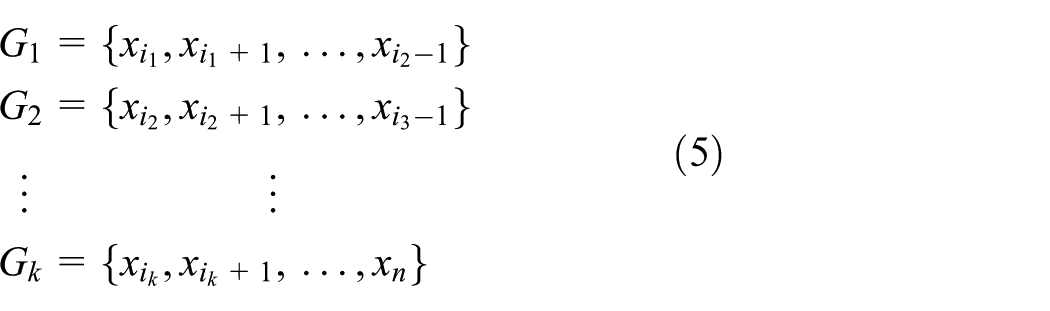
Given that the number of groups k (
First, try to find the break point

then, the kth group is
Second, find another break point
thus, the
Similarly, all groups
In this way, the number of RLR can be partitioned into k groups (i.e. the blocks for a novel fine structure).
Model of increasing block fine
Price elasticity of demand
Three previous studies have reported that an increase in both demerit points and fine penalties reduced RLR.16–18 In other words, the number of one vehicle committing RLR changes with the variation in penalty.
Therefore, the theory of price elasticity of demand is introduced to describe the relationship between fine and the number of one vehicle committing RLR. In microeconomics, price elasticity of demand measures the extent of change in the quantity demand responds to variation in the price. 32 Similarly, how much the number of one vehicle committing RLR responds to change in the fine can be measured as follows

where
Then, the number of one vehicle committing RLR responds to the change in fine is calculated as

Since the number of one vehicle committing RLR is negatively related to fine, the percentage change in number of one vehicle committing RLR will always have the opposite sign as the percentage change in fine. For this reason, the fine elasticity is sometimes expressed as a negative number.
32
However, traditionally, the absolute value of fine elasticity is usually adopted. Therefore, a greater fine elasticity suggests a larger responsiveness of the number of one vehicle committing RLR to fine.
Determination of fine elasticity based on linear expenditure system
In practice, a driver pays not only the fine for red-light violation but also other fees for living commodities, education, tourism, and so on. According to the linear expenditure system,33,34 the total utility for a driver paying for all commodities with inclusion of the fine for RLR is given by

where
It is supposed that the jth commodity is committing RLR. And thus, the equation (13) can be rewritten as follows

where
It can be easily seen that the utility maximization is subjected to a budget constrain that is the total expenditure on all goods 34

where
Hence, the utility maximization problem can be expressed as

According to economics, the fundamental condition of a consumer’s maximum utility is the equimarginal principle. In other words, the utility of a consumer is maximum when the marginal utility of the last dollar spent on any goods is the same. 35 This equilibrium condition can be written in terms of marginal utility and price of each goods as follows

where
Based on equations (16) and (17), we can obtain

where
Equation (18) can be rewritten as follows

Through the summation of i for both sides of equation (19), we have

According to equation (15), we can obtain

where
Based on the definition of fine elasticity, we have

Through equations (21) and (22), the fine elasticity is given by

Hence, the fine elasticity can be reflected by the number of RLR

Models of the drivers’ response to increasing block fine
The purpose of proposing an increasing block fine structure is to minimize the number of RLR through stepwise increase in the cost of red-light violation. One driver response to increasing block fine depends on the fine elasticity and change in fine. Under the increasing block fine structure, the drivers’ response to this novel fine structure is different, since the fine corresponding to different number of one driver violating RLR varies.
Case 1
One driver response to increasing block fine.
Under the increasing block fine structure, fine varies with the number of RLR. Moreover, one driver response to the fine structure changes with the number of RLR as well. It is hypothesized that there are k blocks in this novel fine structure.
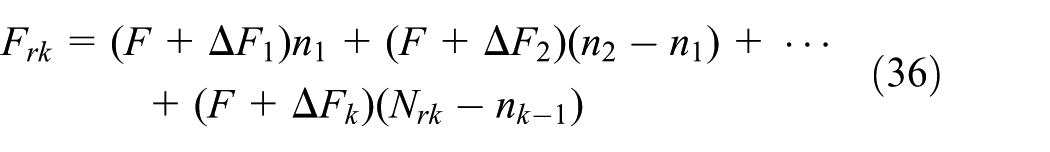
1. When the number of RLR (N) is less than the first break point

Then, the responding number of RLR is expressed as follows

Also, the corresponding fine at the first block is

When

Then, the changed number of RLR is

So, the corresponding fine at the second block is

When
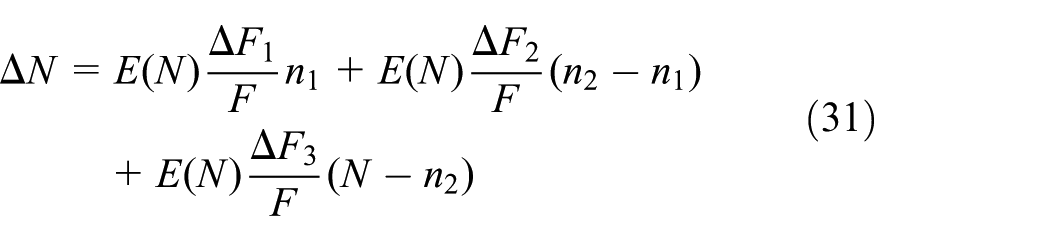
Thus, the varying number of RLR is
Hence, the corresponding fine at the third block is

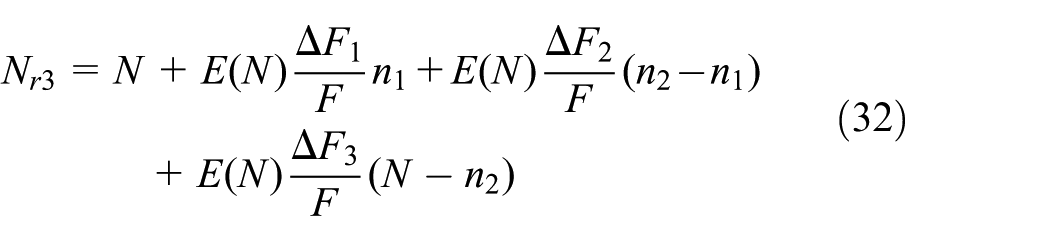
Following the above-mentioned way, when
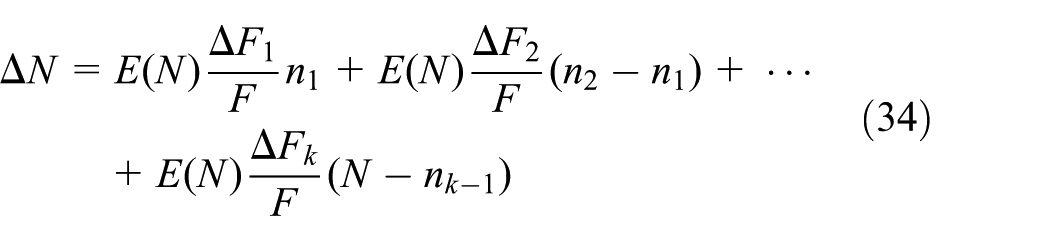
Then, the changed number of RLR is
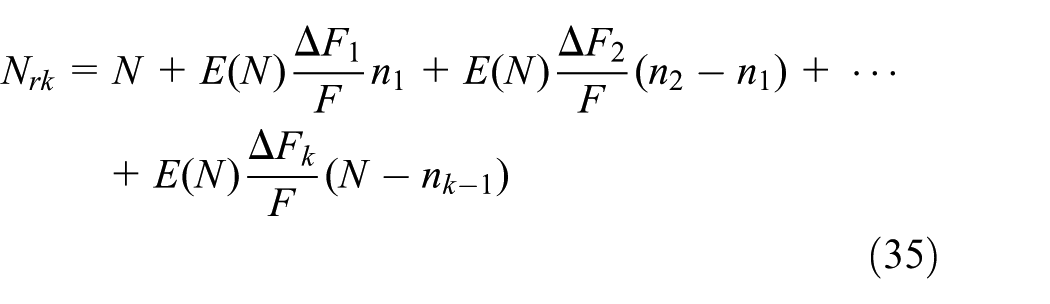
Therefore, the corresponding fine at the kth block is
It can be seen from the aforementioned novel fine structure that RLR recidivism should pay more fine. Accordingly, the novel fine structure obviously increases the cost of red-light violation.
Case 2
All drivers’ response to increasing block fine.
1. Probability density function for number of RLR
The probability density function of a discrete random variable describes the probability of this random variable taking a given value. The likelihood of a random variable within a specific range of values is calculated by the sum of the results of probability density function for all relevant values. The cumulative distribution function is the sum of probability density functions. In this article, the number of RLR is deemed as a discrete random variable. It is hypothesized that

then this function is the probability density function for the number of RLR.
As for all drivers within an area, the number of drivers with the same times of RLR is different. The likelihood of a certain number of RLR equals to the number of drivers having such frequency of RLR divided by the total number of all drivers within this area. Therefore, the probability density function
2. Models of all drivers’ response to increasing block fine
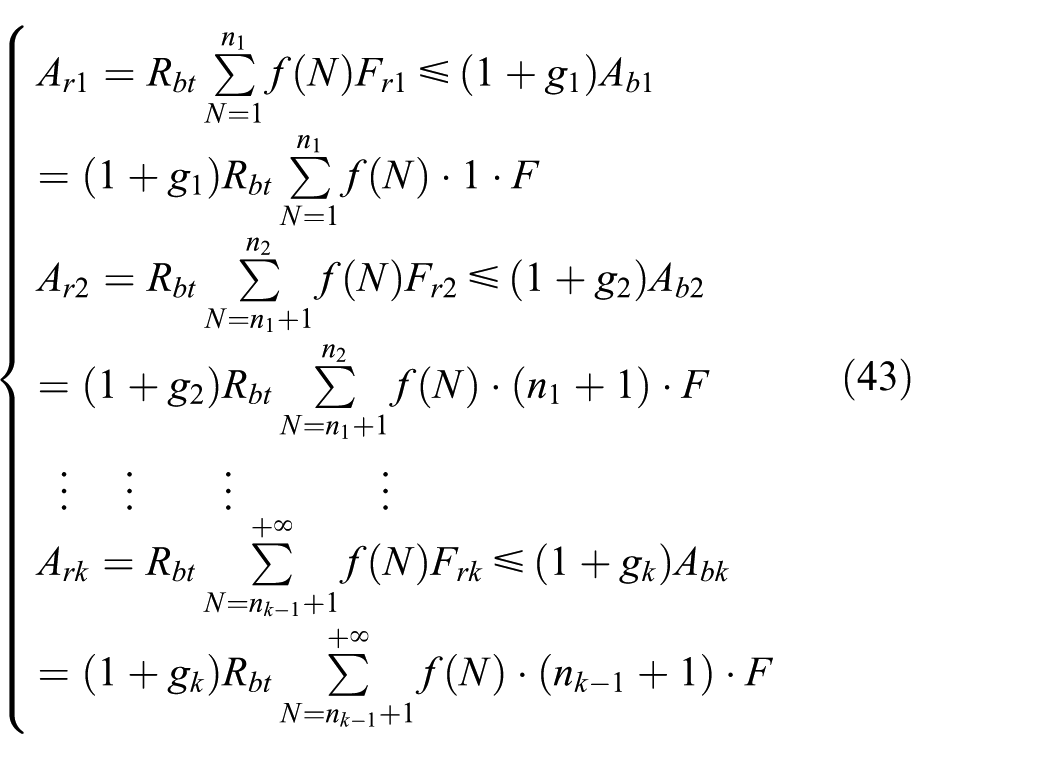
Assuming that this increasing block fine structure is implemented, both the number and fine of RLR for each driver would change. The drivers’ response to increasing block fine is different due to the varying fine elasticity. Based on equation (24), fine elasticity is only related to the number of RLR. Consequently, it is supposed that the drivers have the same number of RLR whose response to such novel fine structure is similar. Also, it is hypothesized that the probability density function for number of RLR is the same before and after the implementation of increasing block fine structure. Hence, if the new fine structure is implemented, the total number (


where
Optimal model of fine at different blocks
The purpose of an increasing block fine structure is to reduce RLR by increasing the fine for such traffic violation recidivism. Determination of fine at each block should consider the distribution of number of RLR for all drivers within an area and their financial bearing capacity. Therefore, the objective of this optimal model is to minimize the total number of RLR for all drivers. That is

After the implementation of increasing block fine structure, the total fine for all drivers is greater than that before the execution of this novel fine strategy

where
Also, the total fine for all drivers after the implementation of this novel fine structure should be less than or equal to the acceptable increased total fine

where
In addition, if such an increasing block fine structure is implemented, the new fine at each block should be less than or equal to the corresponding acceptable increased fine. Hence, there are some other constraints as follows.
There are still some problems
where
The aforementioned optimal model is discontinuous on the dependent variable, which makes conventional solving methods (e.g. gradient descent) less effective. A probabilistic technique called simulated annealing, 36 which was inspired by annealing process in metallurgy, is used to approximate the optimal solution. In the annealing process, the metal atoms jump randomly in a wide range when the “temperature” is high. As the “temperature” drops, the atoms are gradually confined to a grid structure where the minimal potential is achieved. In analogy to this process, the simulated annealing method involves the following steps. First, an initial solution is chosen based on the problem domain expertise or randomly. In the meantime, a “temperature” value is given. Second, a random neighborhood of the initial solution is explored, and then the new solution is accepted only if it improves the value of the object function or an acceptance probability, which decreases as the “temperature” drops, is satisfied. Third, the last step is repeated with a reduced “temperature” until the solution converges or the computational budget is exhausted.
Case study
In order to apply the proposed model, an increasing block fine structure will be developed based on RLR data collected by RLC in the City of Harbin, Hei Longjiang province, as a case study. The present fine in the City of Harbin is 200 RMB per RLR, irrespective of the number of one vehicle committing RLR.
There were 105,821 RLR traffic violations committed by 66,535 vehicles in Harbin in 2015. The percentage of vehicles with different times of RLR is showed in Table 1. As can be seen from Table 1, about 77% of vehicles ran red light only once in 1 year, while about 14% vehicles committed RLR twice in 1 year. What is noteworthy is that these vehicles with more than or equal to 10 times of RLR accounted for approximately 0.7%. Also, nearly 0.2% of vehicles violated red signal greater than or equal to 30 times in 1 year. Even worse is that, a few vehicles committed RLR traffic violation more than 100 times during 1 year. Such very high frequency of committing RLR in 1 year probably is attributed to traffic law drawback, such as license point trafficking. In this current case study, only those vehicles with less than 30 times of RLR are considered, since the percent of vehicles with greater than or equal to 30 times is very small. Finally, there are a total of 65,435 vehicles that have a total of 96,136 RLR traffic violations in the removed data. The frequency of RLR on the basis of the deleted data is presented in Figure 2.
Percentage of vehicles with different times of RLR.

RLR: red-light running.

Frequency of RLR based on the deleted data.
Classification of blocks
As discussed in a doctorial dissertation, till now, there is no a theoretical way to determine the number of blocks. 37 In the field of water, electricity, or gas consumption, the number of blocks is usually set as 2–6. In light of these practical experiences, the number of blocks for the novel fine structure in Harbin is assumed to be 4. It means that the number of RLR is divided into four blocks. According to optimal partition method, the best way to divide the number of one vehicle violating RLR is determined. In this way, the dividing points include the number of one vehicle committing RLR being 1, 2, and 5. In other words, the number of one vehicle committing RLR at each block is 1, 2, 3–5, and greater than 5, respectively. By combining the frequency of RLR and dividing points, the first block covers about 77% of red-light runners, the preceding two blocks cover nearly 91% of red-light violators, and the previous three blocks cover approximately 98% of them. In terms of deterrence boundary for RLR, it seems reasonable to divide the number of one vehicle committing RLR into four blocks through the above-mentioned way, since it not only considers most runners who casually commit RLR but also takes into account the minority RLR recidivists.
Distribution fitting for number of RLR
The RLR is an event of small probability. Moreover, the number of RLR in a given period fits the definition of Poisson distribution. Since the data only include vehicles with at least one RLR traffic violation, the zero-truncated Poisson distribution 38 is employed to fit the data. The fitting curve of zero-truncated Poisson distribution is presented in Figure 3. The corresponding probability density function is given by

where k is the number of RLR. The Cov reflects the goodness-of-fit of the proposed zero-truncated Poisson model. The smaller the Cov, the better the model fitting the data.
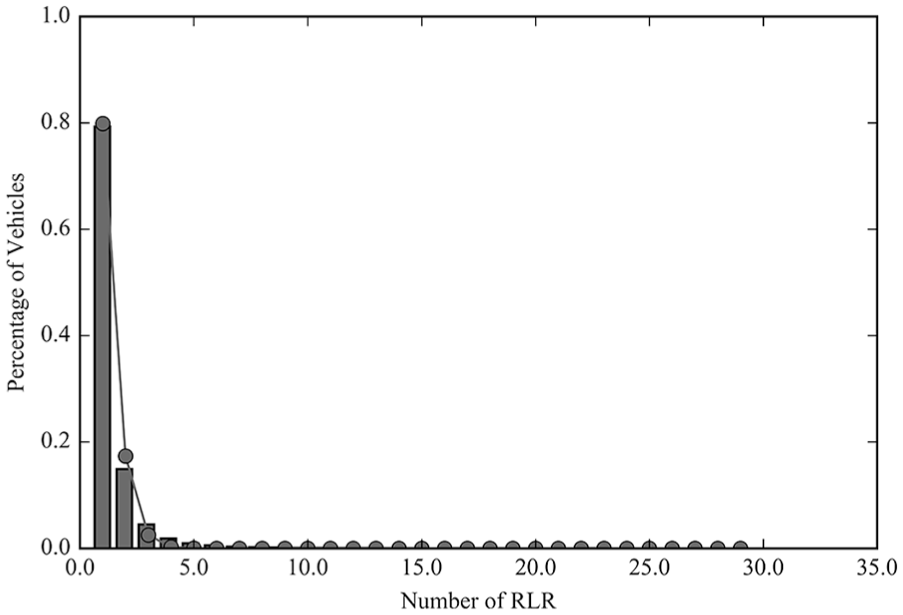
Fitting curve of the zero-truncated Poisson distribution.
Determination of fine at each block
The marginal preference of committing RLR (a) describes the extent that the variation of drivers’ income leads to the change in the number of red-light violation. In other words, a is the percentage of drivers’ income used to pay the fine of RLR commission. According to the existing literature, there is no direct link between income level and RLR occurrence. However, the drivers with high-income may be less likely to run red light due to higher education attainment. In addition, they have a smaller elasticity of RLR with respect to the fine. 16 On the contrary, the drivers having low-income may be more likely to be the RLR recidivism. And thus, they may spend greater percentage of their income on the payment of the fine of committing RLR. Therefore, a is supposed to be 0.1 in this study. In addition, since such novel fine structure largely aims at RLR recidivism, the basic number of RLR for those violators is assumed to be 1.
Hence, the fine elasticity is expressed as follows

According to the data collected from statistical bureau of Harbin, the consumer level index (CLI) of urban residents increased by 6.1% in 2015 as compared with 2014; Similarly, the consumer price index (CPI) ascended by 1.4% in 2015 as compared with 2014. The sum of growth rate for CLI and CPI is employed to be the acceptable rate (i.e.
Therefore, the objective function is expressed as follows
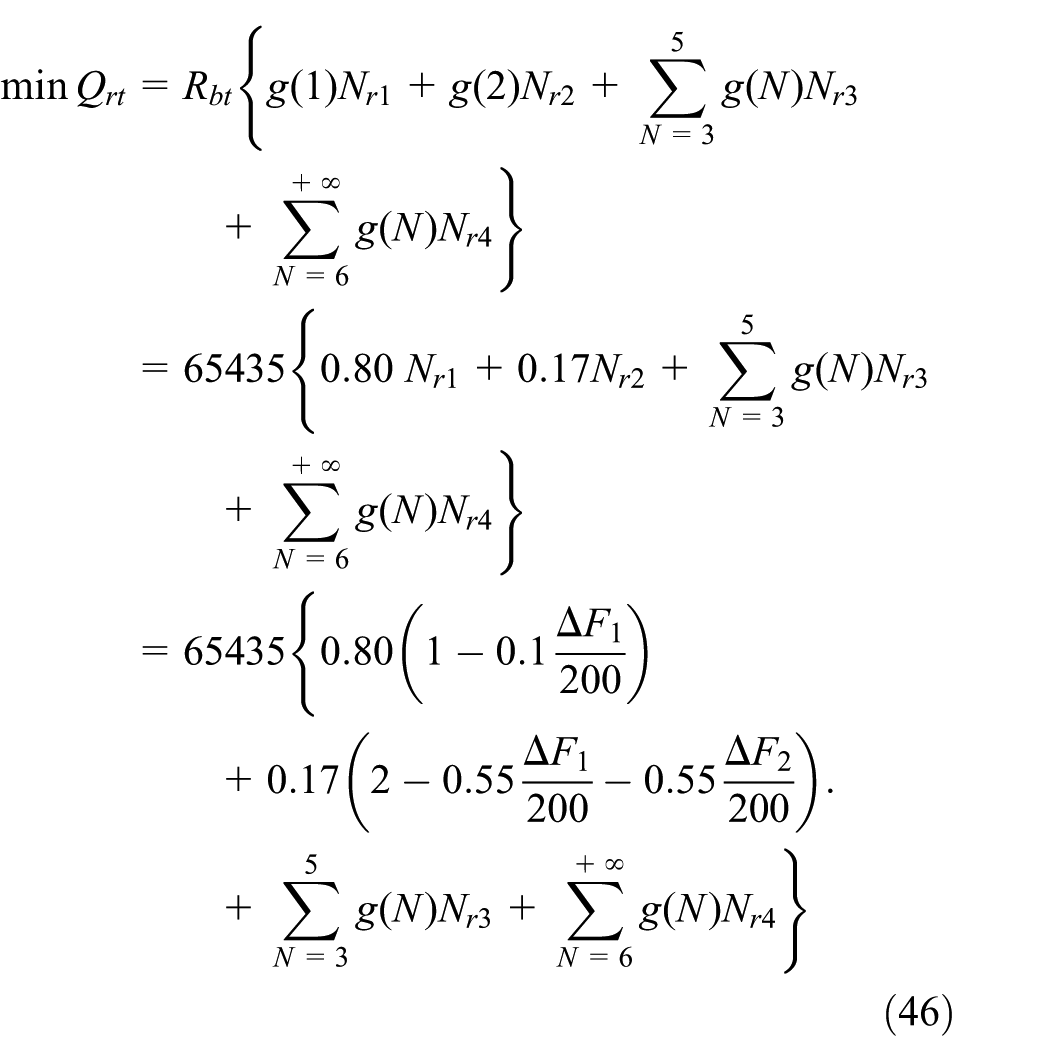
The constraint conditions are given by
Equation (46) is solved using the simulated annealing algorithm. The optimal solution is
Increasing block fine structure for RLR traffic violation in Harbin.
Expected effectiveness analysis of this novel fine structure
If this novel increasing block fine structure is implemented, the changes in fine as compared with the current fine structure are showed in Table 2. It can be seen from Table 2 that, the increment in fine at the first block is zero; however, the increment is up to 150% or even to 450% since the second block. No increase in fine at the first block is on account of the tolerance and acceptance of the majority of RLR runners. An evident increase in fine at the remaining three blocks is to enhance the cost of committing RLR traffic violation, and then to deter the minority RLR recidivism.
Changes in fine after implementation of this novel fine structure.

RLR: red-light running; RMB: Renminbi.
After the implementation of novel fine structure, the expected total RLR at each block in Harbin is obtained by the following process. First, the RLR records in the dataset are adjusted with equation (35), and then the adjusted dataset is aggregated using the blocks that are established in section “Classification of blocks.” The variation in the number of committing RLR in Harbin after the implementation of novel fine structure is presented in Table 3.
Variation in number of RLR runners after implementing this novel fine structure.
RLR: red-light running.
“+” denotes increase; “−” denotes decrease.
As seen from Table 3, the expected number of RLR runners at the second block significantly decreases after the implementation of such new fine structure, despite the increase by 24.5% at the first block. The increase in the expected number of RLR runners for block 1 can be interpreted with the effectiveness of this new fine framework. RLR runners probably prefer to commit RLR for only once instead of greater than or equal to twice due to the stricter fine. The expected number of RLR runners at the third and fourth blocks becomes zero. Such variations in the expected number of RLR runners at the four blocks indicate that this novel fine structure can effectively deter the RLR recidivism. Moreover, the expected total number of RLR runners also reduces by 1.7% after implementing the novel fine structure. This suggests that such novel fine structure has a positive influence on RLR occurrence reduction.
Sensitive analysis for marginal preference of committing RLR (a)
As the parameter for marginal preference of committing RLR, a impacts the fine elasticity, and then may affect the changes in fine and lead to the variation in number of RLR traffic violation. This may result in the variation in number of RLR runners at each block if the increasing block fine structure is implemented. The change in expected number of RLR runners gives the different values of a as presented in Table 4. It can be seen from Table 4 that the expected number of RLR runners at four blocks do not change with a when
Change in the expected number of RLR runners, given different values of a.
RLR: red-light running.
Discussion
In this study, an increasing block fine structure based on the number of one vehicle committing RLR is developed according to the economic theory. This proposed fine structure is the first relevant study in the literature. The novel fine structure presented in this current research could effectively make up for the deficiency of the present fine structure that the fine is the same no matter how many times a vehicle commits RLR traffic violation.
Such case study of Harbin, Hei Longjiang province, is employed to illustrate how to develop an increasing block fine structure for RLR traffic violation recidivism. The results show that a four-tier fine structure for RLR traffic violation recidivism is established; the number of RLR follows zero-truncated Poisson distribution; this novel fine structure would significantly reduce or even eliminate the phenomenon of committing RLR more than or equal to twice, but increase the number of RLR runners at the first block; and also, this novel fine structure would reduce the total number of RLR runners to some extent.
Expected effectiveness of the proposed fine structure as to preventing RLR recidivism is obvious, whereas regarding preventing, all RLR runners are limited. This can be explained with three reasons. The first reason is that the novel fine structure aims to deterring RLR recidivism. The second reason is that the fine at the first block is too low to effectively prevent RLR runners. The third reason is that RLR can be effectively deterred by combining the fine and non-monetary sanction (i.e. penalty points). However, penalty point sanction cannot play an important role in deterring RLR because of point trafficking.
As presented in Table 1, there were only 23% vehicles that ran red-light more than once. This means that such a new fine strategy only has deterrence effectiveness for these violators, which is manifested in Table 3. Nevertheless, although the novel fine structure cannot prevent all red-light runners, it is of great significance in improving traffic safety at signalized intersection, since RLR recidivism is more likely to increase the probability and severity of signalized intersection crashes as compared to those drivers violating red-light only once in 1 year.
Violating red light includes unintentional and intentional RLR. Unintentional RLR commission is usually due to drivers’ mistakes or neglect, and other reasons such as dilemma zone, poor visibility, and sight blocked by other objects, and largely prevented by traffic engineering countermeasures. However, the unintentional RLR remains occurring occasionally. Moreover, it is very difficult to differentiate unintentional and intentional RLR. At present, both unintentional and intentional RLR are recorded by RLC or traffic policemen, and receive the same penalty. This may be unfair for unintentional RLR violators. The novel fine strategy proposed by this study cannot address the equality between unintentional and intentional RLR due to hardly distinguishing them. Nonetheless, the unintentional RLR probably happens just once in 1 year, whereas the intentional RLR possibly takes place more than once in 1 year. From this angle, the proposed fine structure successively deals with the equity between unintentional and intentional RLR in terms of the number of RLR commission.
As for the drivers, especially for RLR recidivism, paying the fine of RLR commission is one of their expenditures. From this perspective, RLR is similar to the goods that the drivers consume. Some studies have concluded that RLR reduces in response to the increased fine.16–18 Hence, the microeconomic theories (i.e. price elasticity of demand and linear expenditure system) are suitable for modeling the changes in the number of RLR commission in response to the increase in the fine. Furthermore, this current case study shows that RLR recidivism decreases sharply under the increasing block fine structure, which is supported by the statement from Bar-Ilan and Sacerdote 16 that the drivers who on average violate the traffic law more often have a greater elasticity of violations with regard to the fine.
In short, the formulae in this current research can help scholars or policy decision-makers to establish an increasing block fine structure in terms of (1) determining the number of blocks, (2) determining the dividing points (i.e. the critical number of RLR) between adjacent blocks, and (3) determining the fine at each block.
However, there are few limitations in this study. First, it may be unreasonable to determine the fine elasticity only based on the number of one driver committing RLR. In fact, fine elasticity is affected by many factors, such as income level, educational attainment, and consumption habit. How to determine the fine elasticity merits further research. Second, the determination of number of blocks lacks theoretical foundation, and thus needs to be explored in an additional study. Finally, it is promising to compare the pros and cons of increasing block fine structure and uniform fine structure (i.e. the present fine structure) and to investigate their own applicable conditions.
Footnotes
Handling Editor: Hai Xiang Lin
Declaration of conflicting interests
The author(s) declared no potential conflicts of interest with respect to the research, authorship, and/or publication of this article.
Funding
The author(s) disclosed receipt of the following financial support for the research, authorship, and/or publication of this article: This research was supported by the National Natural Science Foundation of China (grant no. 71801182), China Postdoctoral Science Foundation (grant nos 2016M600748 and 2017T100710), Fundamental Research Funds for the Central Universities (grant no. 2682016CX052), and Science and Technology Project of Sichuan Province (grant no. 2017ZR0209).