
Abstract
In order to improve the working performance of the impeller in a multi-phase pump under different working conditions and expand the range of the high-efficiency areas of the multi-phase pump, each section of the impeller was divided into an inlet section, middle section and outlet section. The pressurization performance of different areas within the impeller was obtained by numerical calculation under different flow rates and different gas volume fractions, respectively. The results show that the pressurization performance of the different areas within the impeller can be predicted well. In the first half of the impeller, when the blades were closer to the rim, the pressurization performance was stronger, and in the second half of the impeller, when the blades were closer to the hub, the pressurization performance was stronger. With an increase in the flow rate, from the inlet section to the outlet section, the pressurization performance of each stage of the impeller gradually decreased, and the strongest pressurization performance area was always in the inlet section with no obvious movement. With the increase in the gas volume fractions, the pressurization value of each stage of the impeller dropped faster, except for the outlet section. When there was an increase in the flow rate or the gas volume fraction, the inlet section was influenced the most and the outlet section was influenced the least. The research results provide an important theoretical basis for further optimization of the impeller design for a multi-phase pump.
Introduction
The multi-phase pump in the oil exploration process is a key piece of equipment and as such operates under different working conditions which produce large energy losses that eventually lead to the pump not meeting the pressurization performance requirements.1,2 However, as the core component of the multi-phase pump, the impeller pressurization performance directly influences the working performance of the multi-phase pump. 3 Therefore, a clear understanding of the change law for the pressurization performance of different areas within the impeller under different working conditions is important in a deep study of the internal flow mechanism within the multi-phase pump and to expand the range of the high-efficiency areas in the multi-phase pump.4,5
At present, research on the pressurization performance of the impeller within a multi-phase pump has been reported on infrequently, however, there has been considerable research on the pressurization performance in other related hydraulic machines. Some research works related to pressurization performance can be found in the literature.6–11 These studies can provide references for the study of pressurization performance in an impeller within a multi-phase pump.
In recent years, with the rapid development in computational fluid dynamics (CFD), CFD has been widely used in simulating internal flow fields and predicting the performance of hydraulic machines.12–14 This development, along with the continuous improvement in the experimental equipment, has made studying the multi-phase pump more opportune. Various types of research studies have been conducted on the multi-phase pump by experts and scholars, including theoretical and experimental research and also numerical simulations. Of these, with respect to the theoretical research on multi-phase pump pressurization, Miao et al.15,16 proposed a new design method for a multi-phase pump pressurization unit on the basis of an original pump design theory, and a basic energy equation and Bernoulli equation for the axial flow pump were put forward toward a theoretical analysis method on the basis of the helical axial multi-phase pump’s head-flow characteristic curve. Yu et al.17,18 proposed a hydraulic design method for the impeller within the multi-phase pump based on the iteration of positive and negative problems. Li and Zhang et al.19,20 also studied the hydraulic design and the impeller optimization of the axial flow multi-phase pump, respectively. With respect to the numerical simulation research on multi-phase pumps, Kong et al., 21 when researching the helical axial multi-phase pump multistage compressible model and comparing the multistage pressurization performance of compressible and in-compressible models, found that when the gas volume fraction was more than 30% of the multi-phase pump inlet, the pressurization performance increases were no longer a linear law, but the relationship of a quadratic function. Zhang et al., 22 by studying the three-stage multi-phase pump compressible flow field, pointed out that with the increase in the inlet gas volume fraction, the first stage impeller pressurization value was gradually reduced and the second stage impeller and the last stage impeller pressurization value first increased and then decreased. Ma and Yu23,24 studied the influence of the change in axial clearance on the performance of the multi-phase pump and the unsteady flow of the multi-phase pump, respectively.
Apart from the theoretical research and the numerical simulations, some experimental studies on the multi-phase pump have also been conducted. Xu et al. 25 pointed out that with the flow rate reduced, the pressurization value gradually increased to a maximum, and with the flow rate further reduced, the pressurization value was also gradually reduced. Li et al. 26 pointed out that in a pure water test, the maximum efficiency of each supercharged unit had almost no change with the rotational speed, and in the mixing test, the pressurization capacity of the multi-phase pump increased with the increase in the speed. In the literature,27–30 there have been studies with visualization experiments on the gas–liquid two-phase flow field within the multi-phase pump, and the relevant laws on the internal flow change of the multi-phase pump under different gas volume fraction conditions were obtained.
Altogether, the above work has contributed to a better understanding of the internal flow within the multi-phase pump. However, less work has been carried out on the impeller pressurization performance, especially on the pressurization performance of different areas within the impeller. The flow state in different areas of the impeller within the multi-phase pump is very different, and the pressurization performance is complicated and changeable under different working conditions.
In this article, the pressurization performance of different impeller areas was examined numerically by CFD. In order to provide an important theoretical basis for further optimization of the multi-phase pump impeller design, different impeller-area pressurization performances under different flow rate conditions of pure water and different gas volume fractions in the design flow rate were studied in depth.
Model parameters and grid division
Model parameters and calculation domain determination
The multi-phase pump consists of three components, the suction chamber, the three pressurized units, and the extrusion chamber, as shown in Figure 1. The design parameters are Q = 110 m3/h, H = 85 m, n = 2950 r/min, the efficiency η = 33%, D2 = 230 mm, blade number Z1 = 4, and guide blade number Z2 = 9.

The full flow field numerical calculation model.
In order to the facilitate study of the pressurization performance in different areas of the impeller, each stage of the impeller along the axial part was divided into three sections, respectively, the impeller inlet section, the impeller middle section, and the impeller outlet section, as shown in Figure 2. Figure 3 shows different spans of the impeller blades.
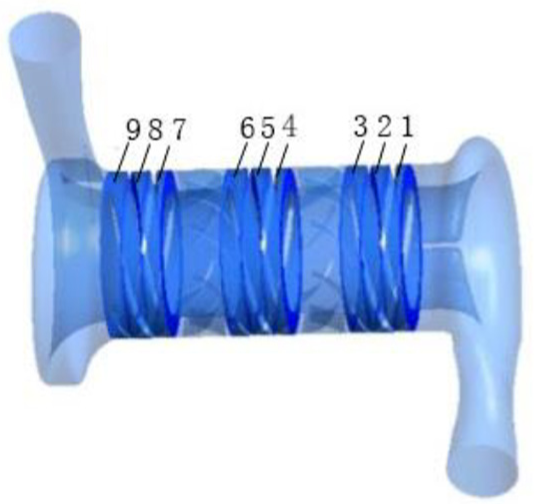
Impeller divisions.
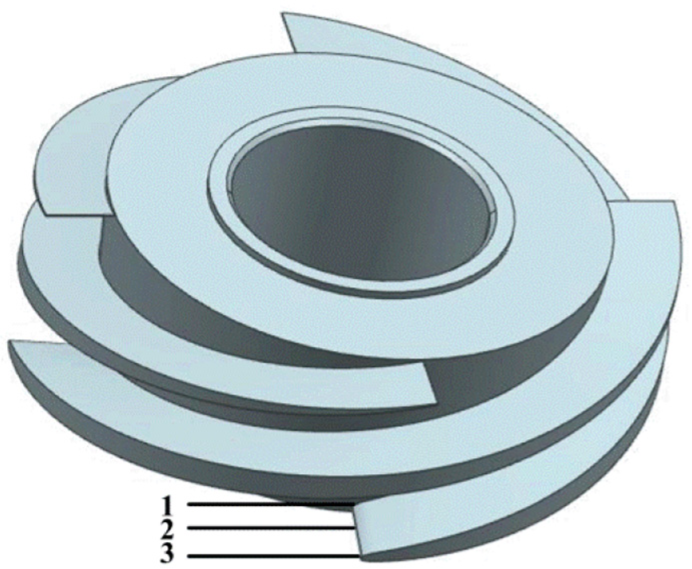
Different impeller spans.
In Figure 3, the hub takes 0.1 times the span of the blade and the rim takes 0.9 times the span of the blade. The span of the blade refers to the distance of the position from the hub.
Grid division
In order to make the calculation results more accurate, the computational meshes for the impellers and the guide vanes were created as structured meshes, while the suction chamber and the extrusion chamber were created as unstructured meshes in the ICEM-CFD tool, respectively. The high-quality meshes were generated separately and further combined by a general grid interface (GGI). Figure 4 shows the grid division of each component of the multi-phase pump. Local encryption is carried out in the important areas of the impeller and the guide vane.

Computational meshes of the flow components for CFD simulations: (a) suction chamber, (b) impeller, (c) guide vane, and (d) extrusion chamber.
Figure 5 shows the variations in the pump head and the efficiency with different mesh sizes, in the operating conditions for the design. From the figure, when the mesh size increases from 4.0 to 4.5 million, the pump head and the efficiency have only changed by 0.04% and 0.09%, respectively. Therefore, the mesh size of 4.05 million was assumed to be sufficient for obtaining a mesh-independent result for CFD simulations of the multi-phase pump, and the mesh numbers of the suction chamber, the impeller, the guide vane, and the extrusion chamber were 855463, 528220, 462531, and 692589, respectively.

Mesh-independent result (n = 2950 r/min, Q = 110 m3/h).
Control equation and boundary condition setting
Control equation
In numerical calculation, compared with the numerous turbulence models, the standard k-ε turbulence model has better stability and applicability, which has been confirmed in a large number of examples in engineering practice and scientific research. In addition, the y+ value of this article is distributed between 30 and 70, which satisfies the requirements for grid quality in the near-wall region by the k-ε turbulence model. In this article, the standard k-ε turbulence model is used as the control equation.
The turbulent kinetic energy and its dissipation rate equation are solved by the standard k-ε turbulence model. Its turbulent kinetic energy k and dissipation rate ε are as follows
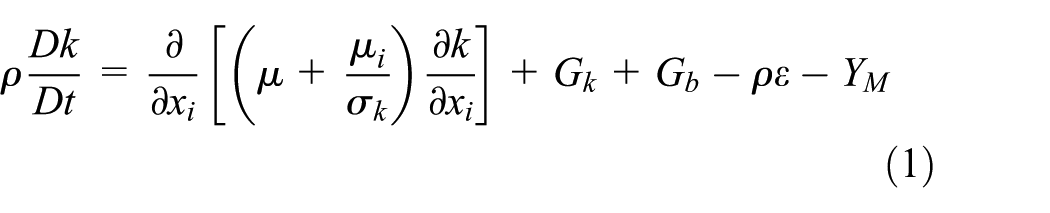
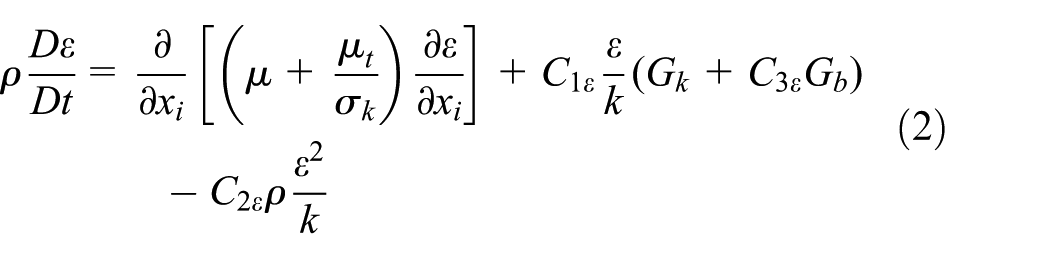
In the above equation,
The two-phase flow model uses a homogeneous flow model. The homogeneous flow model treats the gas–liquid two-phase mixture as a uniform single medium, ignoring the interphase force of the two phases. The basic assumptions are as follows:
The two-phase flow is in a thermodynamic equilibrium state;
There is no relative motion between the gas and the liquid phases;
Ignore the phase effect.
The continuity equation of the gas–liquid homogeneous flow model

The momentum equation of the gas–liquid homogeneous flow model

In the above equation, m is the average value of the mixed two phase media,
Boundary condition setting
Based on the finite volume method, the Navier–Stokes (N-S) equation is dispersed, and the total flow field of the multi-phase pump is numerically calculated by the implicit coupling algorithm. The finite volume method of the finite element method is used to disperse the control equation, and the gas volume fraction is adopted in the first-order upwind format, and the other items are in the second-order upwind format. Using the Semi Implicit Method for Pressure Linked Equations (SIMPLE) method to solve the pressure and speed, the pressure dispersion method is PRESTO!. This article uses constant calculations and uses a pressure-based full implicit algorithm. The impeller speed is set to 2950 r/min, the gas phase medium is air, and the liquid medium is water. The bubble diameters of different gas volume fractions are 0.5, 1, and 2 mm, respectively. There is no mass transfer between the two phase media. The calculation model uses the standard
Experimental study
Experimental test system for the multi-phase pump
The experiment was carried out at the Key Laboratory of the Department of Fluid and Power Machinery of Xihua University. The experimental test system for the multi-phase pump included the motor, multi-phase pump, gas–liquid mixing tank, lubrication system, cooling system, control system, water supply system, gas supply system, test system, pipeline and valves, and so on. The experimental system for the multi-phase pump is shown in Figure 6.

The multi-phase pump test bench.
In this test system, the precision of main equipment is given in Table 1.
The precision of main equipment.

Between the gas–liquid mixing tank and the multi-phase pump, a pressure gauge was installed with inlet pressure reading, and at the multi-phase pump outlet, an outlet pressure gauge was installed with outlet pressure reading. A torque meter was installed between the multi-phase pump and the motor to measure the output torque and the r/min. In this way, the required multi-phase pump head and the efficiency were obtained.
Comparison of the experimental results and numerical results
In order to verify the reliability of the numerical results, the numerical results are compared with the experimental results under the same conditions. Figure 7 shows the comparison results, and we can see that the change tendencies in the numerical results and the experimental results are consistent, and the head and the efficiency of the optimal points of relative error are 4.1% and 4.1%, respectively. The maximum relative error of the head and the efficiency is within 5%, and this shows that the results of the numerical calculation are reliable.

Comparison of experimental and numerical results.
Results analysis
Analysis of the flow characteristics of different areas within the impeller
Figure 8 shows the velocity distribution of 0.5 spans under different flow rates. It can be seen from Figure 8 that there is a large local area of higher velocity near the suction surface of the impeller inlet in each stage, and with the flow rate increases, the area gradually decreases until it disappears. There is a large area with lower velocity, and with the increase in the flow rates, it moves to the pressure surface of the guide vane. It also can be seen from the figure that the speeds of the inlet and the outlet are larger that of the middle section of the impeller at each stage.
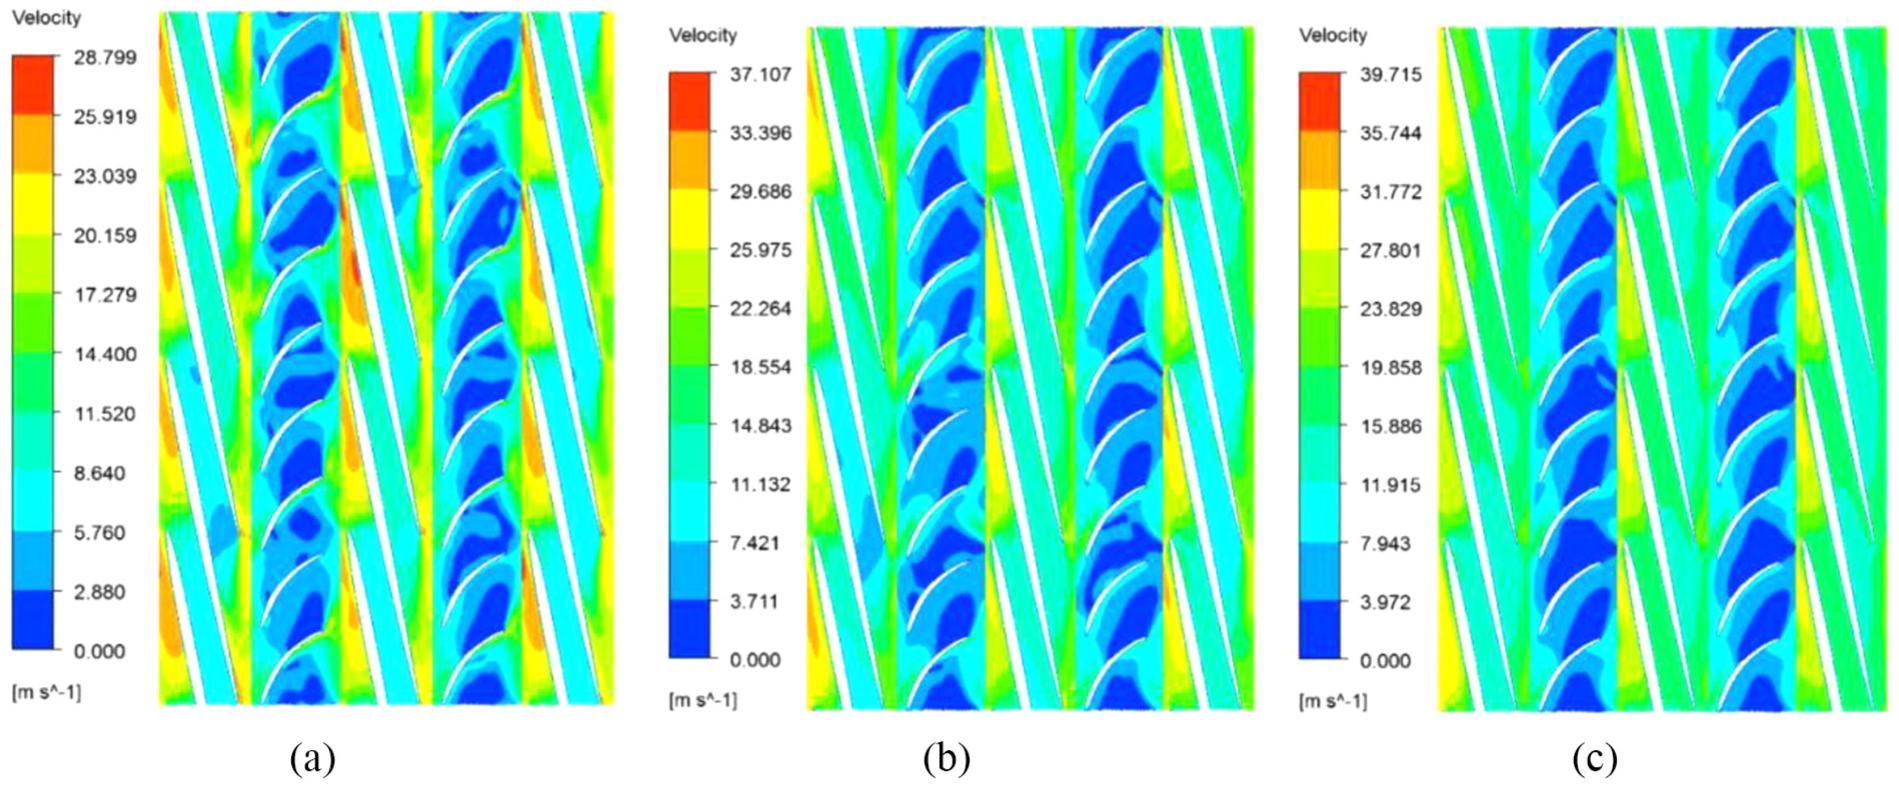
The velocity distribution of 0.5 spans under different flow rates within the impeller: (a) 70 m3/h, (b) 110 m3/h, and (c) 150 m3/h.
Figure 9 shows the velocity distribution of the 0.5 spans under different volume fractions within the impeller, and it can be seen that the influence of the gas volume fraction on the velocity distribution is less than the influence of the flow rate on the velocity distribution within the impeller when combining Figure 8. With the increases in the gas volume fraction, the areas of higher velocity become gradually higher at the inlet suction surface within the impeller. This indicates that the increases in the gas volume fraction make the flow at the impeller inlet more turbulent.

The velocity distribution of 0.5 spans under different gas volume fractions within the impeller.
Because there is a certain similarity between velocity vectors of the impeller inlet section, the middle section, and the outlet section at each stage, we selected the first stage of the impeller for analyzing the flow state, and Figure 10 shows the first stage of the impeller velocity distribution of each section’s middle plane. As can be seen from Figure 10, from the inlet to the outlet section, the impeller velocity gradient decreased first and then increased, and this means that the highest non-uniform flow was at the impeller inlet section, second was the outlet section, and the middle section was uniform. It also can be seen from Figure 10 that there is a local vortex at the inlet of the impeller, which further proves the uneven flow of the impeller inlet.
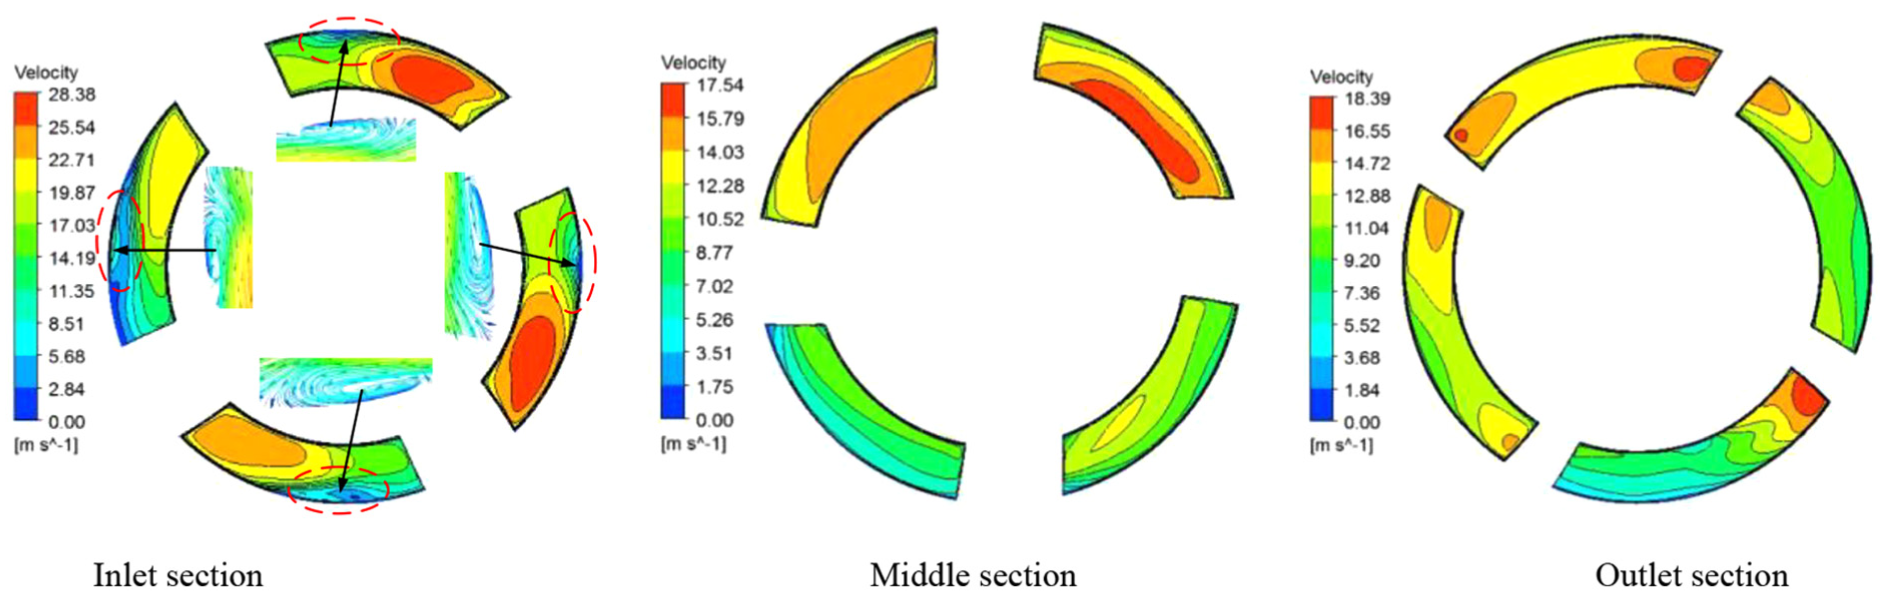
The velocity distribution of different sections’ middle plane within the impeller.
Figure 11 is the velocity vector of the meridional plane under the gas–liquid conditions, and because the meridional velocity vector has a certain similarity when the gas volume fraction increased from 10% to 40%, this work selected a gas volume fraction of 40% for analysis. As can be seen from Figure 11, from the inlet to the outlet section of the impeller, there is a larger axial counterclockwise vortex at the impeller inlet, and there is a larger axial clockwise vortex at the impeller outlet, and this shows that the flow within the impeller is uneven.

The vector illustration of the impeller meridional plane.
Figure 12 shows the variation law for the pressurization performance of the impeller blades at different spans. It can be seen from Figure 12 that in the first half of the impeller, when the blades are closer to the rim, the pressurization performance of the impeller is higher, and in the second half of the impeller, when the blades are closer to the hub, the pressurization performance of the impeller is higher. It also can be seen from Figure 12, that in the first stage of the impeller, from the inlet to the outlet sections, the difference in the pressurization values between different spans becomes bigger and bigger, and in the second stage and the last stage of the impeller, from the inlet to the outlet sections, the difference in the pressurization values between different spans decreased first and then increased.

The variation in the pressurization of the blades at different spans.
The influence of the flow rate on the pressurization performance of the impeller
Figure 13 shows the pressurization performance change law for different regions within the impeller under different flow rates. As can be seen from Figure 13(a), with the increase in the flow rate, the impeller inlet section pressurization performance at all stages increased first and then decreases. The first-stage impeller inlet section optimum pressurization performance is at the design flow, and the best pressurization performance of the second-stage impeller and the last stage impeller points to a small flow rate. The amplitude of the pressurization performance of the impeller inlet section along with the change in the flow rate is small. The amplitude of the second-stage of the impeller and the last stage of the impeller inlet section along with the change in the flow rate is big.
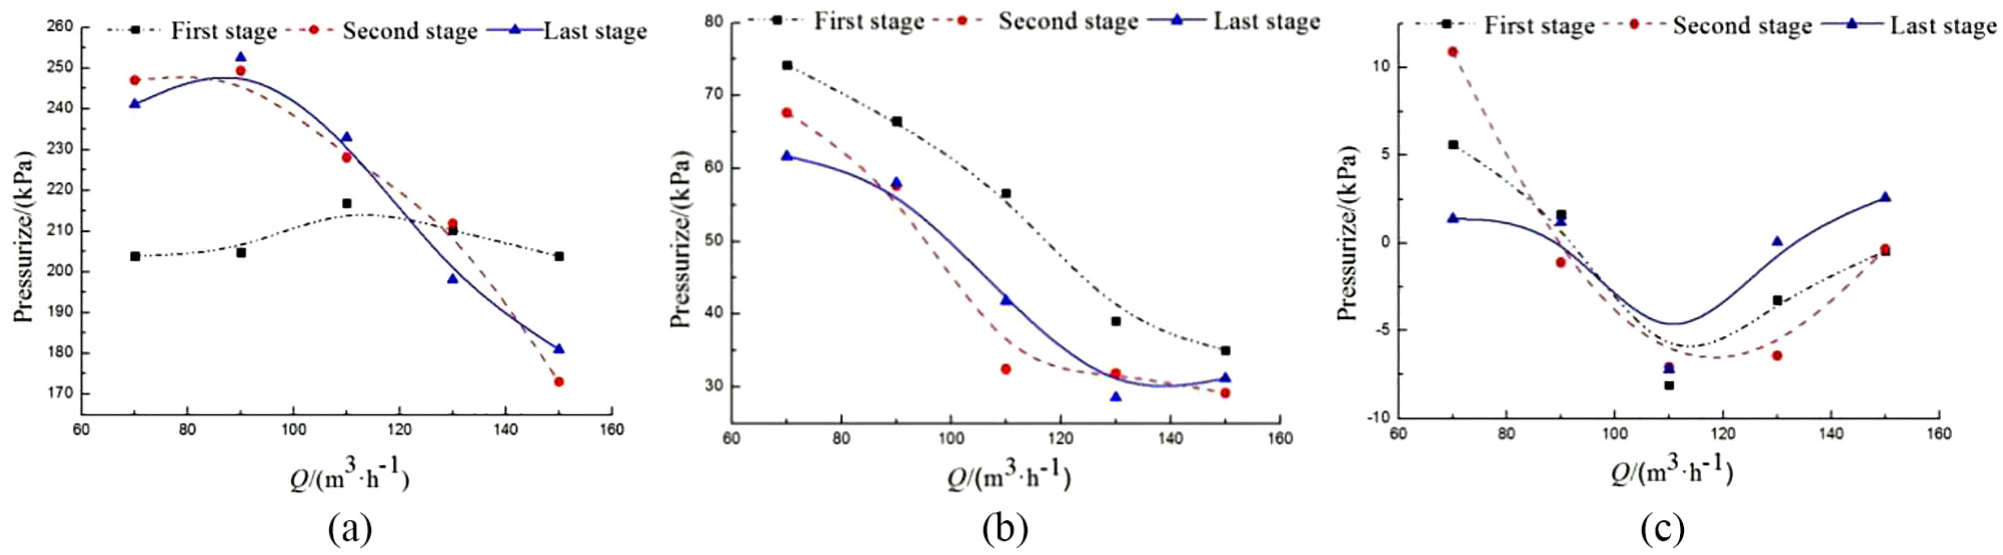
The pressurization performance of different regions within the impeller under different flow rates: (a) inlet section, (b) middle section, and (c) outlet section.
As can be seen from Figure 13(b), with the increases in the flow rate, the pressurization performance of the middle section of the impeller at all stages presents a decreasing trend; among them, the middle section of the first-stage impeller pressurization performance is the best, and the pressurization performance difference between second-stage impeller and the last-stage impeller is not big.
As can be seen in Figure 13(c), with the increases in the flow rate, the pressurization performance of the impeller outlet section at all stages decreased first and then increases, while the pressurization performance is the smallest under the design flow rate.
We also can see from Figure 13(a)–(c) that from the impeller inlet section to the outlet section, the pressurization performance of the impeller decreases, and when the flow rate is 70 m3/h, the pressurization performance of the first-stage inlet section is 2.75 times that of the middle section and is 36.36 times that of the outlet section. When the flow rate is 70 m3/h, the pressurization performance of the secondary impeller inlet section is 3.65 times that of the middle section and 22.67 times that of the outlet section. When the flow rate is 70 m3/h, the pressurization performance of the last stage of the impeller inlet section is 3.91 times that of the middle section and 173.46 times that of the outlet section. Under the design flow rate, the pressurization performance of the first stage of the impeller inlet section is 3.83 times that of the middle section, while the outlet section without pressurization steps down instead. Under the design flow rate, the pressurization performance of the secondary impeller inlet section is 7.03 times that of the middle section, while the outlet section without pressurization steps down instead. Under the design flow rate, the pressurization performance of the last stage impeller inlet section is 5.57 times that of the middle section, while the outlet section without pressurization steps down instead. When the flow rate is 150 m3/h, the pressurization performance of the first stage of the impeller inlet section is 5.82 times that of the middle section, while the outlet section without charging steps down instead. When the flow rate is 150 m3/h, the pressurization performance of the secondary impeller inlet section is 5.94 times that of the middle section, while the outlet section without pressurization steps down instead. When the flow rate is 150 m3/h, the last-stage impeller inlet section pressurization performance is 5.81 times that of the middle section and is 70.15 times that of the outlet section. This shows that with the change in flow rate from a low flow rate to a high flow rate, the most powerful pressurization performance region of the impeller is always at the inlet section, and there is no obvious movement.
The influence of the gas volume fraction on the pressurization performance of the impeller
Figure 14 shows the change rule for the pressurization performance of different regions under different gas volume fractions. As can be seen from Figure 14(a), in the impeller inlet section, the strongest pressurization performance is at the last stage of the impeller, while the first-stage impeller pressurization performance is the weakest. Under the gas volume fraction of 10%, the last-stage impeller pressurization value is 1.025 times that of the secondary impeller and is 1.089 times that of the first-stage impeller. Under the gas volume fraction of 20%, the pressurization value of the last stage impeller was 1.026 times that of the second-stage impeller and is 1.097 times that of the first impeller. Under the gas volume fraction of 40%, the pressurization value of the last-stage impeller is 1.016 times that of the second-stage impeller and is 1.086 times that of the first-stage impeller. This shows that under the same gas volume fraction, from the first-stage impeller to the last-stage impeller, the inlet pressurization value increases gradually, and with the increase in the gas volume fraction, this increasing value increased first and then decreases. We can also see from Figure 14(a) that in the impeller inlet section, with a gas volume fraction increased from 10% to 40%, the first-stage impeller pressurization value decreased 60.821 kPa, the second-stage impeller pressurization value reduced 63.815 kPa, and the last-stage impeller pressurization value decreased 66.625 kPa, and this shows that the gas volume fraction increases had the biggest influence on the last stage impeller inlet section and had a minimal influence on the first stage impeller inlet section.

The pressurization performance of different regions within the impeller under different gas volume fractions: (a) inlet section, (b) middle section, and (c) exit section.
As can be seen from Figure 14(b), in the middle section of the impeller, the first-stage impeller pressurization performance is the strongest, and the last-stage impeller pressurization performance is the weakest. Under the gas volume fraction of 10%, the pressurization value is 1.134 times that of the second-stage impeller and is 1.193 times that of the last stage impeller. Under the gas volume fraction of 20%, the pressurization value of the first-stage impeller is 1.106 times that of the second-stage impeller and is 1.161 times that of the last-stage impeller. Under the gas volume fraction of 40%, the first-stage impeller pressurization value is 1.156 times that of the secondary impeller and is 1.212 times that of the last-stage impeller, and this shows that under the same gas volume fraction, from the first-stage impeller to the last-stage impeller, the pressurization value gradually decreased, and with the increase in the gas volume fraction, this decreasing value decreased gradually. In the middle section of the impeller, with the gas volume fraction increased from 10% to 40%, the first-stage impeller pressurization value decreased 18.914 kPa, the second-stage impeller pressurization value reduced 17.376 kPa, and the last-stage impeller pressurization value decreased 16.380 kPa, and this shows that with the gas volume fraction increased, the influence on the first stage impeller middle section is the biggest, and the influence on the last stage impeller middle section is the smallest.
As can be seen from Figure 14(c), at the impeller outlet section, with the increase in the gas volume fraction, all stages of the impeller outlet section pressurization value appear to change irregularly, and the last-stage impeller outlet section has no pressurization and steps down instead.
Conclusion
From the inlet section to the outlet section of the impeller, the velocity gradient within the impeller decreased first and then increased, and there is a local vortex near the impeller inlet surface. In the first half of the impeller, when the blades are closer to the rim, the pressurization performance of the impeller is stronger. In the second half of the impeller, when the blades are closer to the hub, the pressurization performance of the impeller is stronger.
With the increase in the flow rate, the pressurization performance of the inlet section increased first and then decreased, the pressurization performance of the middle section within the impeller at all stages showed a decreasing trend, and the pressurization performance of the outlet section within the impeller at all stages decreased first and then increased. The impeller pressurization performance of the strongest area was always at the inlet section and did not move in any obvious manner. For example, when the flow rate is 70 m3/h, the pressurization performance of the first stage inlet section is 2.75 times that of the middle section and is 36.36 times that of the outlet section.
At the impeller inlet section, with an increase in the gas volume fraction, the influence on the last stage was the greatest and the influence on the first stages was the smallest. At the impeller middle section, with an increase in the gas volume fraction, the influence on the first stage was the greatest and the influence on the last stages was the smallest, such as with the gas volume fraction increased from 10% to 40%, the first-stage impeller pressurization value decreased 18.914 kPa, the second-stage impeller pressurization value reduced 17.376 kPa, and the last-stage impeller pressurization value decreased 16.380 kPa. At the impeller outlet section, with an increase in the gas volume fraction, the influence on the impeller was irregular. With an increase in the gas volume fraction, the pressurization performance of each section decreased gradually without the outlet section.
Footnotes
Handling Editor: Hyung Hee Cho
Declaration of conflicting interests
The author(s) declared no potential conflicts of interest with respect to the research, authorship, and/or publication of this article.
Funding
The author(s) disclosed receipt of the following financial support for the research, authorship, and/or publication of this article: This work was supported by grants from the National Key Research and Development Program (2018YFB0905200), Education department key project of Sichuan province of China (17ZA0366), China Postdoctoral Science Foundation (2016M600090), China Postdoctoral Science Foundation (2017T100077), and the Key scientific research fund of Xihua University of China (Z1510417). This work was also supported by the Open Research Subject of Key Laboratory of Fluid and Power Machinery, Ministry of Education (szjj2016-004).