
Abstract
As to low permeability reservoir, faults and fractures have a significant impact on effect of water injection and may lead up to the lower efficiency of oil displacement, which will bring about low efficiency of injecting water, and the intended purpose of improving recovery factor by water injection will not be reached. In order to reveal the mechanism for channeling of injecting water, research work is conducted as follows: First of all, based on seepage mechanics, fluid mechanics, rock mass mechanics, and multifield coupling theory, the mathematical model considering fluid–solid coupling of water-flooding development for low permeability reservoir is established, the numerical solution of the coupling model is obtained, and by creating an interface program between the seepage simulation procedure and stress computation program, we set up a feasible method to simulate the process of development of reservoir considering deformation of reservoir stratum; second, some cores are selected to test the stress sensitivity of rock in reservoir, and the relation of permeability and stress is proposed to connect the field parameters of the coupling model; finally, taking the S11 block of Daqing Oilfield, for instance, the seepage field and deformation of reservoir stratum is analyzed, and then the mechanism for leakage of injecting water in this block is given out, and the advice for adjustment of injection–production scheme in the future development stage is provided.
Introduction
In the process of reservoir development, there exists multifield and multiphase coupling, especially in low permeability reservoirs. The permeability of reservoir is low during the developing process by injecting fluid. There also exist speed-sensitivity, salt-sensitivity, acid-sensitivity, stress sensitivity, and so on.1–3 If injected fluid is ordinary water, most of the oil fields with low permeability will perform a strong stress sensitivity, which has already been confirmed in most oil fields at home and abroad. In the development of heterogeneous and low permeability reservoir,4–6 the contradiction between interlayer and the inner layer is prominent, and injection–production process will lead to uneven distribution of pressure which will cause the difference of effective stress throughout reservoir; however, the reservoir’s permeability can change when the effective stress varies; therefore, the permeability of reservoir is changing in the whole process of injection–production, and there is a strong non-linear relationship between them.7–9 Consequently, when carrying out numerical analysis in the process of injection–production for this kind of reservoir, the diversification of permeability must be taken into consideration. 10 Here, the main consideration is that permeability of reservoir will change with effective stress.
During the mining process of injecting water with high pressure, fluid–solid coupling of reservoir is very intense.11–13 Interaction between effective stress and pore pressure will change the porosity and permeability of rock, and for reservoirs with low permeability, a subtle change of the pore volume of the reservoir will cause significant change of its permeability.14–18 In this process, if the permeability of weak permeable sublayer changed significantly, it is likely to become a passageway of flow channeling for injected fluid and cause flow channeling. In this article, based on the principle of effective stress, we consider the dynamic evolution of the relationship among the porosity, permeability, and effective stress and analyze the change of permeability with different effective stress under different initial porosity and permeability with three-dimensional finite element model. The results show that the permeability of weak permeable sublayer will change significantly in the mining process of injecting water with high pressure under the effective stress-pore pressure coupling effect and may lead to inflowing of water along fault.19,20 Research results have a theoretical guidance meaning for the prevention and cure of fault inflowing in the mining process of injecting water with high pressure for oil filed with low permeability and improving the efficiency of water injection.
Under the fluid–solid coupling, the permeability of the rock is not fixed.21,22 And small change of pore in porous media has a significant impact on the ability of the flowing, and the subtle, slight change of pore volume for reservoir with low permeability can cause dramatic change of its permeability. 23 Other studies24,25 showed that in low permeability reservoirs, although the sensitivity relationship between effective stress and porosity is weak, there is a strong sensitivity relationship between effective stress and permeability.
Mathematical model of fluid–solid coupling for reservoir with low permeability
Seepage model of low permeability reservoir
According to seepage mechanics with multiphase, in the development of reservoir, the equations of flowing fluid can be described by black oil model which is based on black oil model hypothesis, 5 and the seepage equations for oil–water considering the deformation of medium are as follows

Relationship among porosity, permeability, and rock effective stress is determined by
where
When solving a practical problem, we must know the appropriate boundary conditions; for seepage problems, the boundary conditions include two categories: one is constant pressure boundary and the other is the constant flow boundary. Where the constant pressure boundary means that the pressure is known in the boundary each time, its form is as follows
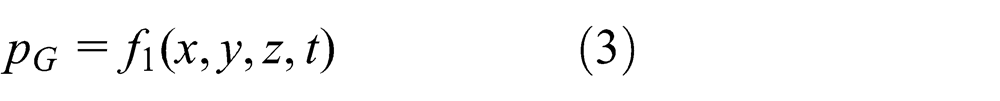
The formula representing the pressure of a point (x, y, z) on the boundary is
Another boundary is that the flowing rate is known each time, and its form is as follows
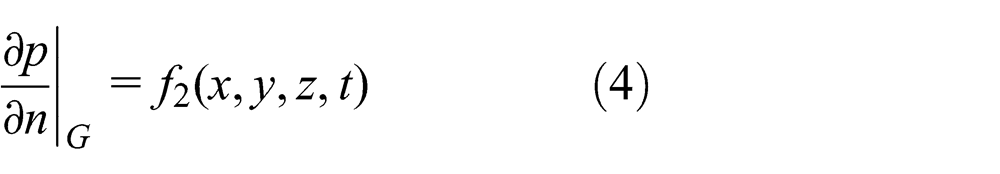
where
For transient seepage problems, we also need to add the appropriate initial conditions, which means the distribution of pore pressure for reservoir at initial moment should be given out, and its form is as follows

Mathematical model of rock deformation for low permeability reservoir
The elastic–plastic model of reservoir’s rock and soil includes equilibrium equations, geometric equations, and constitutive equations of elastic–plastic (including yield criterion, flow rule, the relationship of stress–strain in incremental form). When combining these equations together, we can solve the elastic–plastic problem.
When rock of reservoir is regarded as elastic–plastic medium, according to the associated theory of elastic–plastic mechanics, we can obtain the mathematical model for computing the stress field of reservoir. The equation includes the following three important groups.
Based on the principle of effective stress, 6 stress balance equation of rock considering the role of effective stress is as follows

where
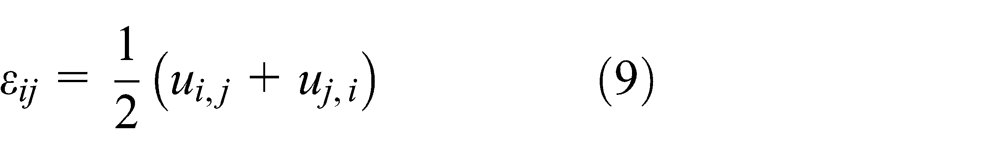
According to the conditions of continuity of deformation, we can obtain geometric equation 7

where
Calculation model of stress considering fluid–structure coupling
The mechanics model of reservoir considering fluid–structure coupling includes seepage field and stress field. Seepage field and stress field were solved by the finite element and Galerkin finite element methods, respectively; to obtain the node solving discrete pore pressure and stress, employ the effective stress principle to decouple the relationship between stress field and seepage field; at the same time, stress field affects the seepage field through permeability and porosity.
The elastic–plastic initial stress method has been adopted in calculation for the sandstone layer. And elastic–plastic mechanics model of the sandstone is composed of the equilibrium equations, the geometric equations, and the elastic–plastic constitutive equation (including yield criterion, flow rule, and incremental form of stress–strain relationship).
The differential equation of equilibrium considering deformation of reservoir based on the effective stress can be expressed as

The geometric equation of the deformation of rock is as follows
where
The elastic–plastic constitutive equation is used, and the constitutive equations of incremental form can be expressed as follows
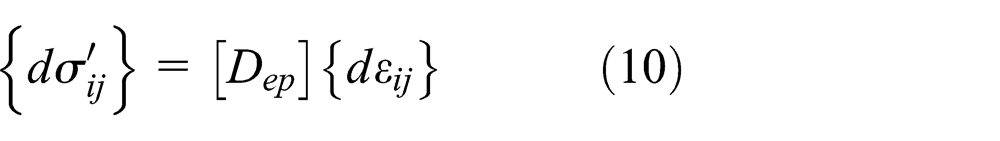
where
The Drucker–Prager criterion is adopted to describe the yield behavior of rock. And its form is as follows
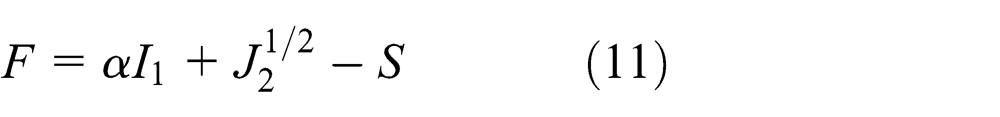
where

As can be seen from the formula, Drucker–Prager criterion is independent of the third invariant stress tensor.
There are two kinds of boundary conditions in deformation field of reservoir rock:
The surface force of rock skeleton is known. The boundary conditions are as follows

where
The surface displacement of rock skeleton is known. The boundary conditions are as follows

where
The finite element method has been adopted to solve geotechnical elastic–plastic deformation problem based on solid–fluid coupling. The step is as follows: first of all, the reservoir space should be discretized and displacement of node is unknown (need to solve). The equilibrium equation between forces and displacement of node should be established based on virtual work principle. Then, the displacement vector could be obtained after solving equations. Next, strain could be obtained from the geometric equations and stress distribution from constitutive equations.
For the convenience of docking with the commonly used oil reservoir simulation software, iteration method is used for the calculation of permeability–stress coupling based on equivalent continuous medium model. The basic idea of iteration method is as follows: first of all, the initial stress field should be obtained through calculation. The permeable coefficient tensor can be obtained from the stress tensor of each node. Then, the pore pressure of each node could be known from the results of calculation in seepage field. Next, pore pressure is treated as a body load and applied to the stress field to obtain the stress value of next step. Repeat iteration until convergence. The general iterative format can be expressed as follows:
Step 1. Calculate the initial stress field.
Step 2. Calculate permeability tensor of each cell in seepage field based on stress distribution; calculate the permeability coefficient matrix of each cell and then assemble total permeability coefficient matrix.
Step 3. Calculate seepage field.
Step 4. Pore pressure distribution of seepage field is treated as nodal load and applied to the stress field.
Step 5. Judging convergence condition. If yes, stop iteration. Or, turn to step 6.
Step 6. Calculate stress field and then turn to step 2.
The process described above is shown as follows in Figure 1.
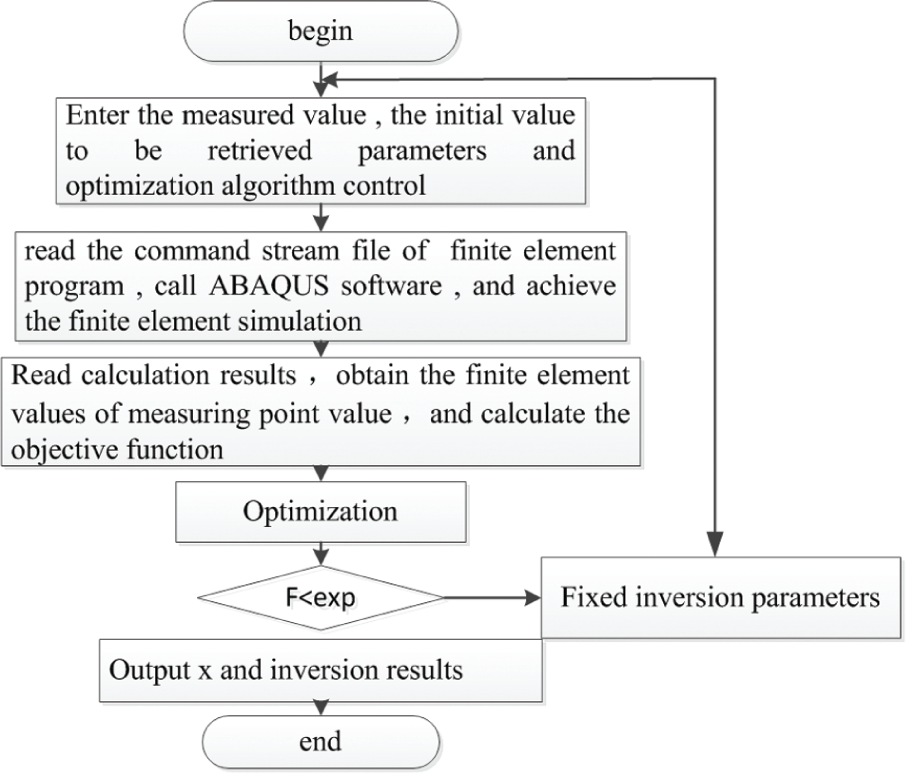
Inversion block diagram of geotechnical engineering optimization.
In order to actualize the process described above, according to the correlation between difference grid (DG) and finite element grid (FEG), we create a converting program to transfer the DG to FEG; therefore, the transferring of parameters of stress field and seepage field becomes true.
Stress sensitivity tests of reservoir
All experiments were conducted in the state key laboratory of oil and gas reservoir geology and exploitation (Southwest Petroleum University); experimental facilities used include rock tri-axial machine, rock rheology, testing machine, multiparameter measuring instrument of rock at high temperature and high pressure. The main equipment is shown in Figure 2 and the core of formation in Figure 3.

Multiparameter measuring instrument of rock at high temperature and high pressure.

Ordinary sandstone core.
Figure 4 shows the test results of stress sensitivity for 1#–4# and 1#–10# cores. The purpose of this experiment is to study the law of change of permeability with different effective stress under different confining pressure. During the experiment, because the cores numbered 1–4 are shale rock samples, the permeability is very low—only 0.005 mD; when the effective stress increases, permeability is almost zero, and it is difficult to obtain accurate stress sensitivity curve. From the test curve, permeability of core decreases with the increase in the effective stress and reduces by a big margin.
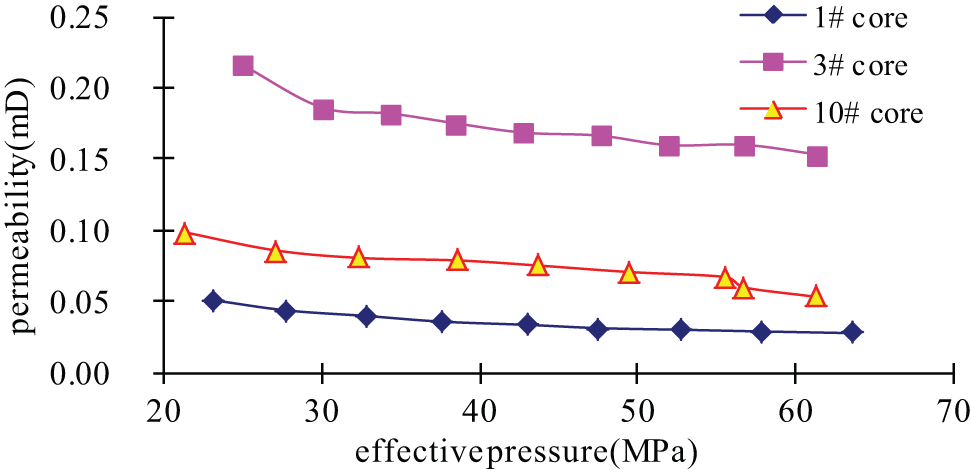
Permeability versus effective stress of some cores.
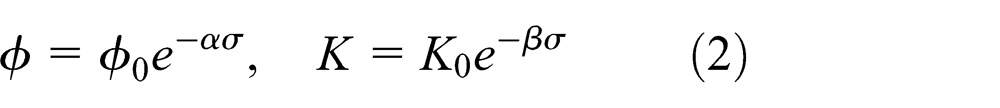
In order to apply the results above easily in the numerical calculation, through statistical analysis and fitting experimental curve, we can obtain a function of the stress sensitivity of reservoir permeability. The relationship of Formula 2 can be used to fit and then obtain the relationship

Establish geologic model and finite element model and match the production history
Build geological model
S11 block was started to produce from 1998 and finished in 2010; the grid number of model in three directions is 113, 178, and 50; the total grid number is 931 and 500; the geologic model of the field is shown in Figure 5, and the main feature of the block is that when more interlayer develops, majority of injected water enter the fault; in order to analyze easily, now we choose part of the model for simulation. In Figure 5, the blue part represents initial model, and the highlighted part represents the block intercepted for analysis.

Overall model of block S11.
In the intercepted model above, the grid numbers in the three directions of X, Y, Z are 85, 78, 50, and the total grid numbers are 331, 500; the part model we chose as research area is shown in Figure 6, in which there are 52 wells; 12 of them are water wells, and 40 of them are producing wells. The main geological feature of S11 is the presence of a large number of faults; in the process of injecting water, the fault may slide due to improper parameters of injection and production, and then the coefficient of conductivity will be improved strongly and cause much water leakage.
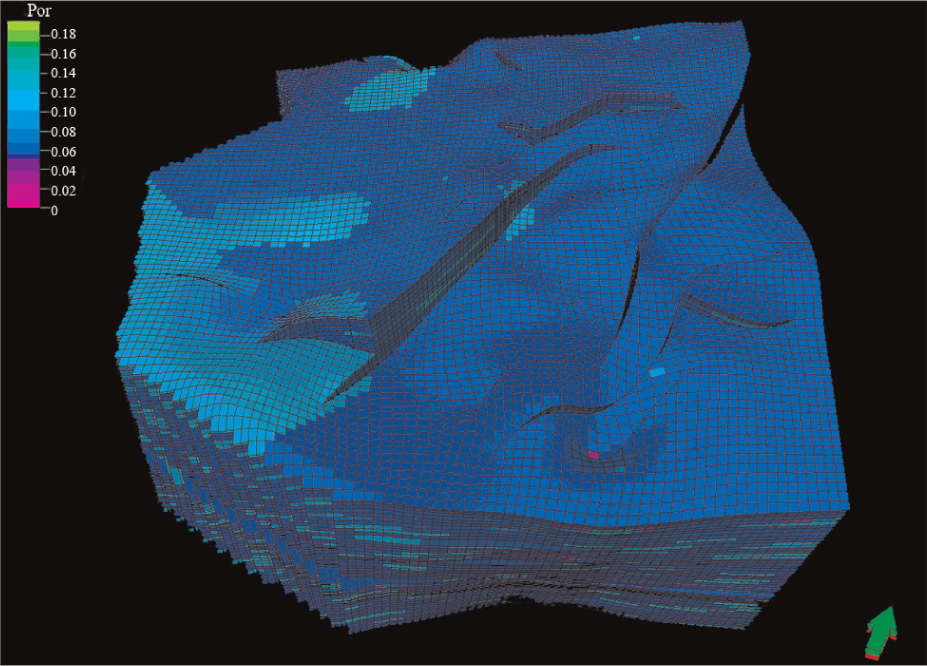
Porosity distribution of the model.
Here, in order to simplify the calculation, the fault fracture zone is approximated to the high permeability zones for enhanced penetration.
Finite element model and the method to solve the coupling model
According to correspondence between the grid of finite difference and finite element, convert the reservoir grid above into the finite element numerical model and let the unit near the fault for continuous treatment; taking fault’s compatibility of calculation into account at the same time, we can use the finite element solver to calculate the stress field of model, and we can make an interface procedure to convert the geologic model to finite element model; the converted results are shown in Figures 7 and 8.
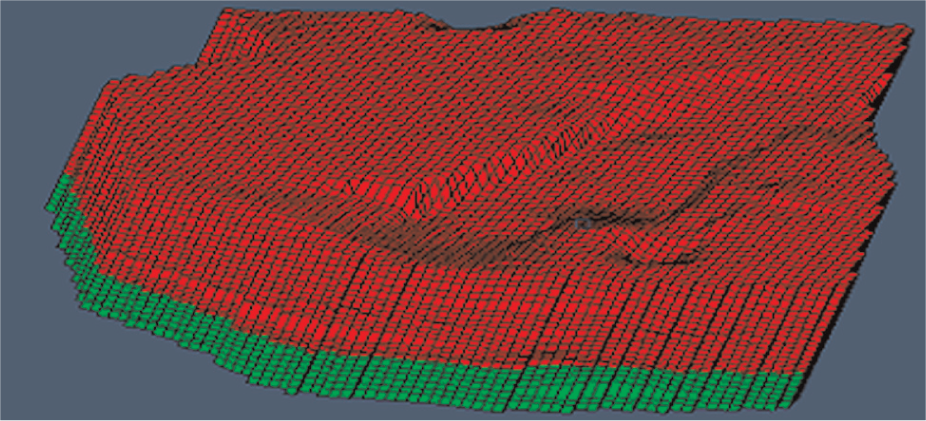
Finite element model of the block S11.

S11 Distribution of wells in the block for finite element model.
As can be seen from Figure 7, the fault in the model is replaced by some entity element, and it is useful to simulate the stress; from Figure 8, the blue and red pillars represent the well in the model, and in the simulation process of stress, these wells can be treated as beam element.
In the process of calculation, calculate the pore pressure of reservoir; first, export the pore pressure of node. Second, read pore pressure of node by the finite element solver and calculate stress field of reservoir. Third, get the results of effective stress and then calculate effective stress of every unit corresponding to DG. In the next step, calculate permeability of each unit through the coupling relationship between stress and seepage fields and amend permeability parameter of the reservoir model, followed by a numerical calculation of reservoir seepage field; we will get the pore pressure and output flow field results corrected; in this way, a circulation of fluid–structure coupling is completed. By repeating the process above, we can complete the numerical simulation of reservoir considering flow-solid coupling.
Match of production history
The total number of oil wells in S11 block well group is 52; there are 42 producing wells among them. At the beginning of production, there were seven water wells, and it has increased to 10 in 2004; the entire block started to produce from December 1998. This simulation end time was in April 2010.
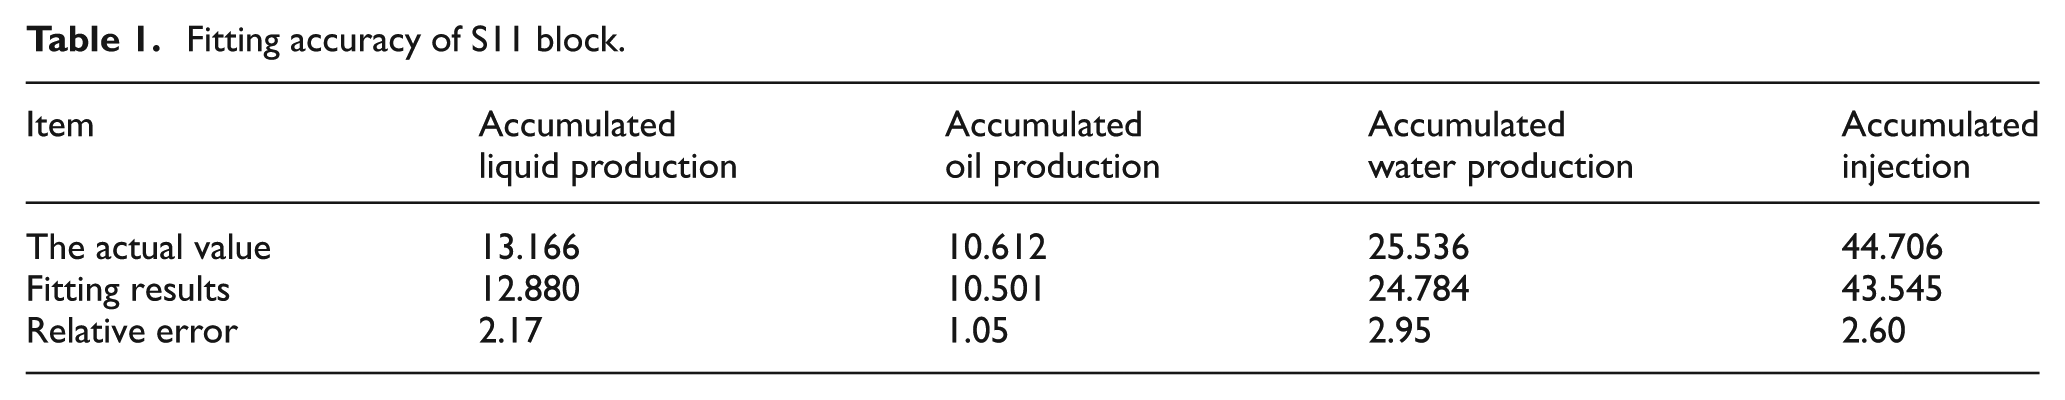
The fitting accuracy of simulation is obtained and shown in Table 1. From the simulating results, the fitting results of each index in entire block were within 5% (margin of error), which meet the requirements of reservoir engineering calculations and indicate that the model and parameters established are correct; they can be used as scheme comparison and study on optimization in the later period.
Fitting accuracy of S11 block.
Mechanism of leakage
Before the analysis of leakage of injected water, we should divide the reservoir model into several parts. After the main analysis of injection of reservoir and fault, we will analyze the efficiency of injection, and so, the model is divided into the two regions: one is reservoir area and the other is potential high permeability zone-fault zone conducted with penetration approximation. When the water flows into the reservoir area, it is the effective water; however, when water flows into the fault area, it is the invalid injection. Since in the reservoir developing process, production well pressure controls the production process and has an important impact on groundwater dynamics particularly, subsequently, we will analyze the law that pressure of production well influences injected water of interbed and the sensitivity analysis of pressure for production wells. When pressure of production well is 0.5, 1, 2, 3, and 5 MPa, and other injection and production parameters are the same, conceptual design is shown in Table 2.
Sensitivity analysis program of injection velocity.

Three field simulations result when pressure of production wells is 0.1 and 5 MPa, mainly given out plane distribution of S11 blocks FI1 layer’s parameters. The water saturation when production time is 10 and 20 years is shown in Figure 9.

Distribution of water saturation at different time.
As seen from Figures 9 and 10, fault flowing increases with the exaltation of bottom-hole pressure of production wells, which means that higher the bottom-hole pressure of production well, the more fault inflowing; therefore, in the mining process, we can consider the low pressure of production wells to reduce fault inflowing.
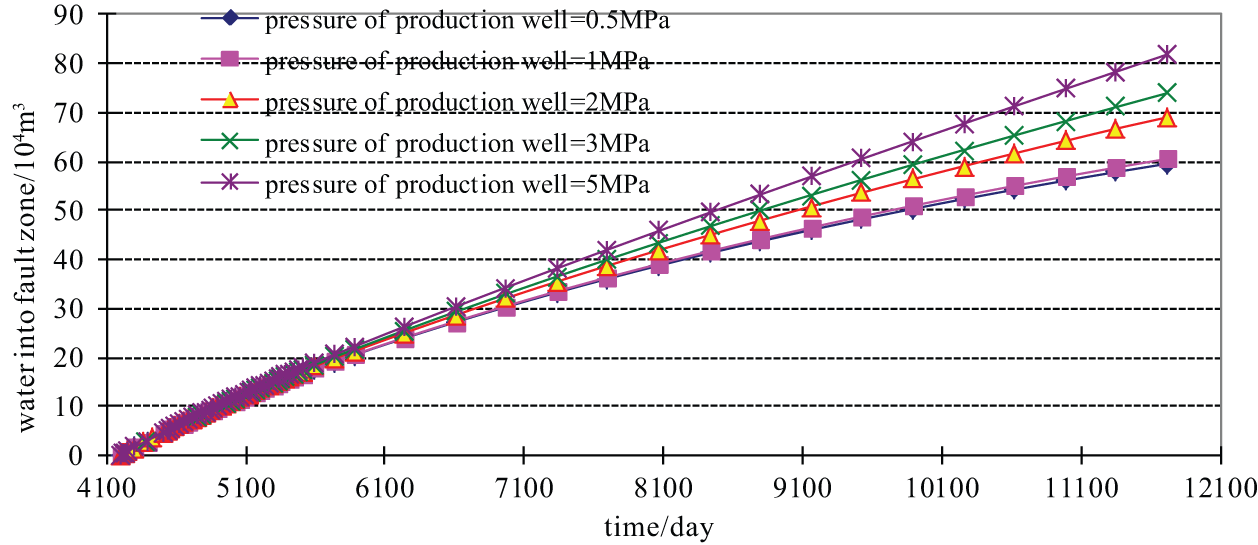
Water into the fault zone at different pressure of production wells.
As seen from Figure 11, the lower the pressure of production well, the more the reservoir inflow; we can make more injected water to flow into the reservoir through reducing the pressure of production wells.
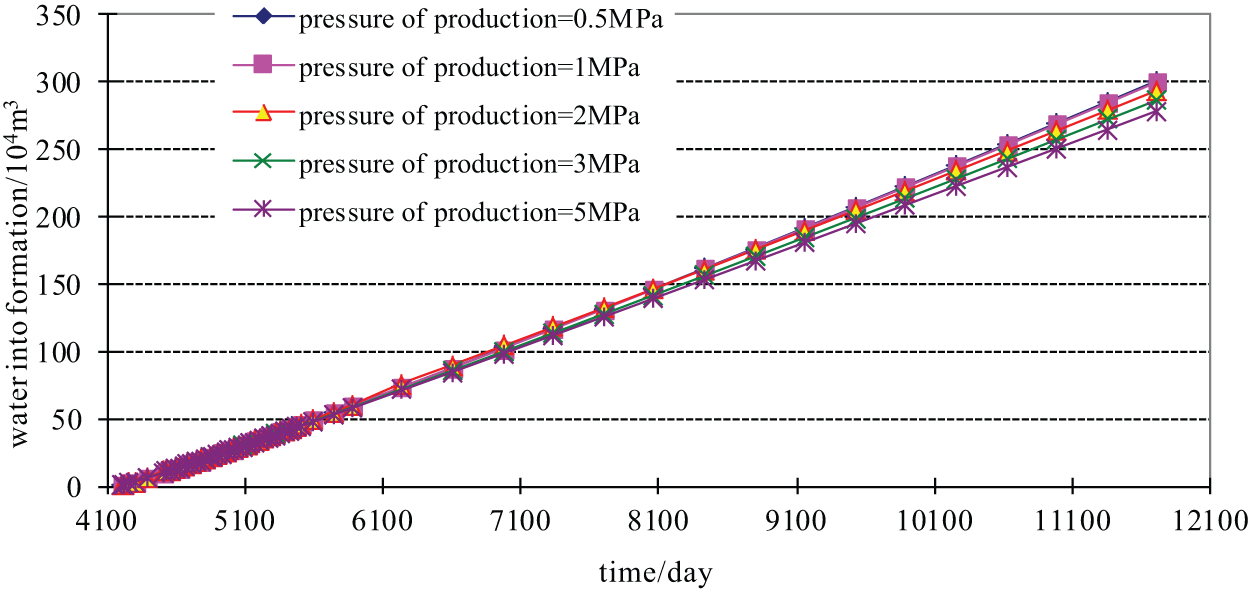
Reservoir inflow curve at different pressure of production wells.
With the increase in pressure of production well, fault inflow increases and the amount of water injected into reservoir decreases.
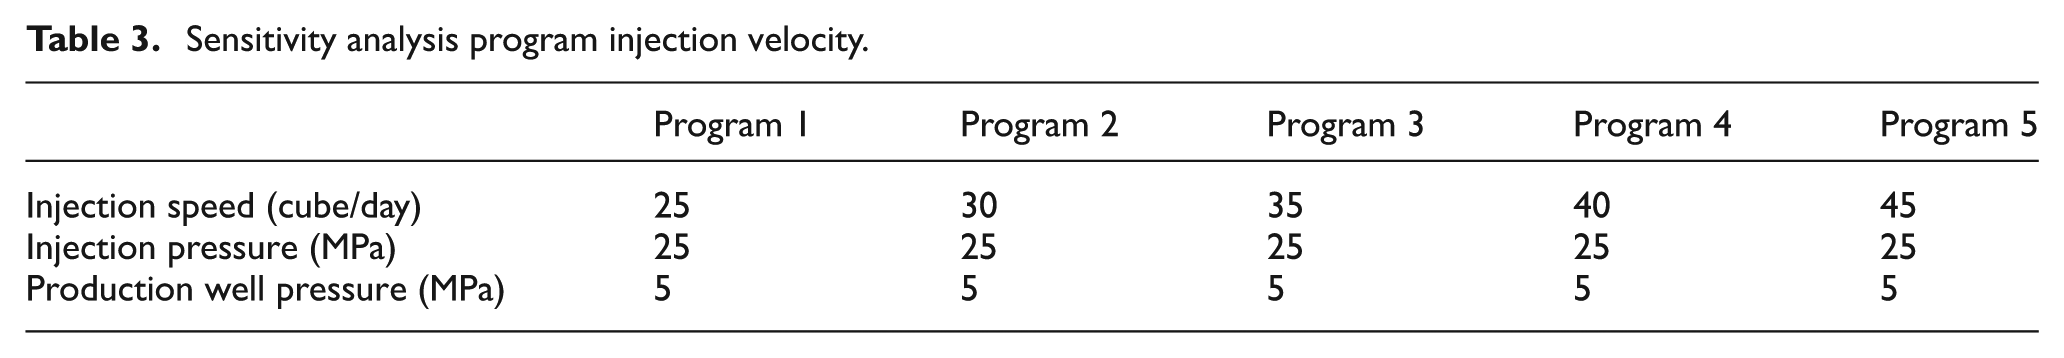
Next, analyze sensitivity of water injection rate. When injection speed is given as 25, 30, 35, 40, and 45 cube/day, the same as other injection parameters, program designed is shown in Table 3.
Sensitivity analysis program injection velocity.
From Figure 12, with the increase in daily water injection rate, fault flowing increases, and this kind of increase is large, which will result in too much water flow to the fault; the velocity of injected water to the fault will increase as the daily water injection rate increases and then leads to increase in fault flowing; we can reduce the fault flowing by reducing the daily water injection rate based on the assurance of injected water and its efficiency.

Water into the fault zone at different daily water injection rate.
From Figure 13, with increase in daily water injection rate, fault inflowing increases, while water flow to reservoir decreases, which indicates that large daily water injection rate is more beneficial to flowing of water into the fault zone.
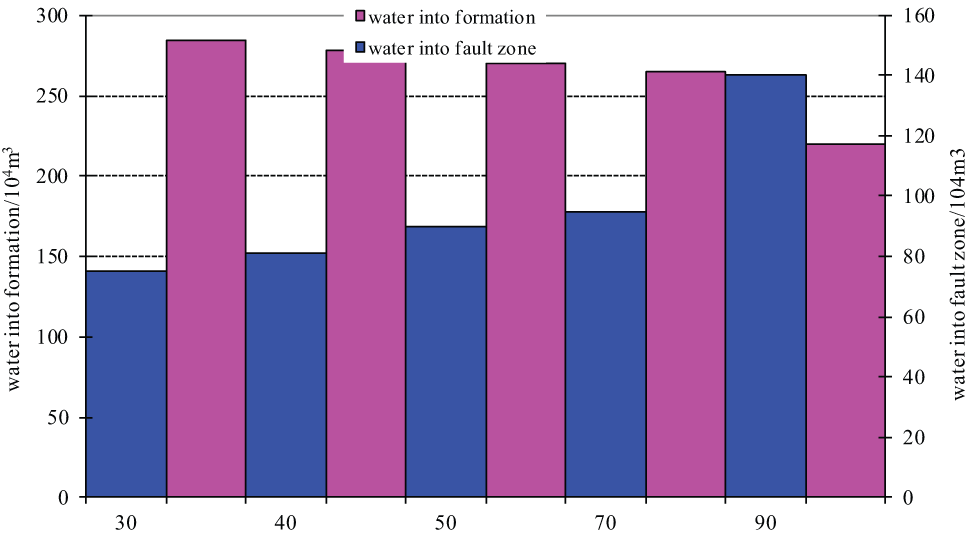
Water into the fault zone and ordinary reservoir versus water injection rate.
When injection pressure is given as 25, 28, 30, 32, and 35 MPa, the same as other injection parameters, program designed is as shown in Table 4.
Optimization scheme of injection pressure.

The curve of fault inflowing and reservoir water injection is shown in Figure 14, and the variation law of fault flowing and reservoir water injection with change in injection water pressure was also seen from this figure; with the increase in injection water pressure, the fault flowing gradually increases, while the quantity of water into reservoir gradually decreases.

Fault inflowing curve at different injection pressure.
As can be seen from Figure 15, fault inflowing will augment as injection pressure increases; with the increase in injection pressure, water into reservoir decreases, which indicates that higher the injection pressure, the more beneficial to fault inflowing; we can decrease fault inflowing by controlling the change in injection pressure.

Variation law of fault inflowing and water into reservoir with the injection pressure.
Conclusion
The comprehensive model of stress and fluid for reservoir development is established, and then, the solution method of the coupling model is set up; it makes the field scale simulation considering stress-fluid coupling of reservoir come true; as far as the simulation results are concerned, the model and the method established in this research are valid. It can be used to analyze the distribution of stress and pore pressure, the interaction of geo-stress and seepage, and the impact on development of reservoir.
According to mechanism analysis of S11 block fault inflowing, we can obtain the following main conclusions:
With the increase in bottom-hole pressure of production well, fault inflowing gradually increases, which means that higher the bottom-hole pressure of production well, the more the fault inflowing; therefore, in the mining process, we can take over the use of low pressure of production wells to reduce fault inflow.
With the increase in daily water injection rate, fault inflowing increases, and this kind of increase is very large. As daily water injection rate increases, fault inflow increases and water into reservoir decreases, which indicates that if daily water injection rate is higher, it will be more beneficial to fault inflowing.
Fault inflow will augment with the increase in injection pressure; with the increase in injection pressure, water inflow into reservoir decreases, which indicates that higher the injection pressure, the more beneficial to fault inflowing; we can decrease fault inflowing by controlling the injection pressure.
Footnotes
Academic Editor: Fakher Chaari
Declaration of conflicting interests
The authors declare that there is no conflict of interest.
Funding
This work was financially supported by the open foundation project from State Key Laboratory of Oil and Gas Reservoir Geology and Exploitation of Southwest Petroleum University (Grant No. PLN1131), the project (Grant No. 2014QHZ036) from sail plan of Southwest Petroleum University, the project (No. 2014_3310,2014_3334) from Work Safety Supervision Bureau of China and effective development technology of ultra-low permeability reservoir (Grant No. 2011ZX05013006-005), the key project (Grant No. 13ZA0189) from Education Department of Sichuan Province, open fund project (Grant No. ESP1406) from Ecological Security and Protection Key Laboratory of Sichuan Province (Mianyang Normal University) and Natural Science Foundation of China (Grant No. 51074137 and No. 51174170), major projects (09ZA139, 12ZA197) from the Education Department of Sichuan Province and the key project (Grant No. 2012XJZ027) from Science and Technology Fund of Southwest Petroleum University and the SWPU Geotechnical Mechanics and Engineering Science & Technology Innovation (Cultivation) Youth Team (No. 2013XJZT006).