
Abstract
A design of a pure electric vehicle controller research and development platform is presented in this article. Based on a Freescale MC9S12XDP512 microcontroller with several I/O ports, the hardware of the controller together with a controller area network communication interface to coordinate functionalities of each vehicle module is designed. The control strategy is modeled and verified by MATLAB/Simulink and AVL.Cruise softwares. The calibration of parameters is verified by a 55 kW dynamometer machine with different test scenarios. Besides, comprehensive experiments are performed and the results are obtained using the platform.
Keywords
Introduction
Due to the pressure of energy shortage and environmental pollution, new energy vehicles have attracted rapidly increasing attention in recent years.1,2 As one type of the new energy vehicles, pure electric vehicle has developed most rapidly. For example, Japan launched the first pure electric car Leaf in 2010, with excellent appearance design and long continuous mileage after charging once. At the 2011 Shanghai Auto Show, the Changan BenBen MINI pure electric car with lithium battery is presented, which can provide maximum speed of 120 km/h and continuous mileage can be reached to l50 km after one charge. In addition, the ferric phosphate batteries are employed by BYD e6. The standard charging time of it is 6 h, which can provide the maximum speed of 160 km/h and continuous mileage of 300 km.
At present, four key technologies of pure electric vehicle research are investigated, including vehicle controller, energy management system, motor drive control technology, and lithium battery technology. As we all know, the vehicle control unit (VCU) is the core component of an electric vehicle control system. 3 More importantly, the motor control system signal, the acceleration pedal signal, the brake pedal signal, and signals of other parts are first collected by VCU, which will analyze the driver’s intention and make corresponding judgment. Then, to coordinate the movement of various power components and protect normal driving of electric vehicles, the required motor output torque and other parameters are calculated.4–6 Moreover, the structure of the electric vehicle will have an impact on the movement of vehicles. Qin et al. 7 proposed a new approach for vibration mitigation based on a dynamic vibration absorbing structure for electric vehicles. Tang et al.8,9 proposed motor torque control methods to suppress the vibration of a dual-motor hybrid powertrain during start-stop operation. For the energy management, the energy control strategies such as equivalent consumption minimization strategy (ECMS), Pontryagin’s minimum principle (PMP), and model predictive control (MPC) strategy are widely used in the hybrid electric vehicles (HEVs),10–13 while the pure electric vehicles are used less. However, the higher energy efficiency of pure electric vehicle can be achieved by regenerative braking energy recovery. 14 At the mean time of completion of energy and power control, it also monitors the actions of the lower level components of the controller and provides the key functions of normal driving for the battery energy and braking energy feedback, network management, fault diagnosis and processing, and vehicle status monitoring.15,16 For example, Van Mierlo and Maggetto 15 proposed a recognition model to estimate the distance directly by training a deep neural network. In Guo et al., 16 a novel control system of electric vehicles is proposed, which has been validated by the simulation and experimental tests.
The current research on vehicle controller is mainly focused on regenerative braking control, traction force control, and so on. Although overseas vehicle controllers are often produced by large automobile enterprises with advanced technologies, they are mainly used for complex four-wheel drive and wheel motor drive pure electric vehicles. For example, the vehicle controller of Toyota mainly receives the driver’s operation signal and the motion sensor signal. Then, it calculates these signals by the control strategy and drives the left rear wheel and the right rear wheel, respectively, through the left and right sets of motor controllers and inverters. 17 The vehicle controller of Nissan LEAF receives electronic signals from the speed sensor and acceleration pedal position sensor of the combination instrument and controls the motor, generator, power cell, solar cell, and regenerative braking system through the sub-controller. 17 For single motor-driven pure electric vehicles, the functions are usually achieved by the motor controller instead of vehicle controller. The current domestic studies on vehicle controllers are mostly still in the experimental stage and achieve the hardware structure foundation preliminarily for vehicle controller development.18,19 In the domestic market, a few universities, such as Tsinghua University, Tianjin University, and Beijing Institute of Technology, and other individual enterprises have accomplished small quantities of production and managed sale of pure electric vehicle controller products. Establishing a research and development platform to investigate more cost-effective vehicle controller technologies can benefit a wide variety of electric vehicle models and products in the domestic market.
Overall design scheme
The vehicle controller receives the operation information from the driver, such as the accelerator pedal, the brake pedal, and the shift lever signals, and then the driver’s intention and the corresponding operation are determined based on the information. When the vehicle is running, the vehicle output torque and the vehicle status are sent to the motor control unit. When the vehicle is started and stopped, the high and low voltage power, which is supplied by the external related equipment, is controlled to turn on and off in sequence. The start and running state of the motor controller and power management system are controlled to meet the vehicle control needs. To coordinate the working status of each module, the vehicle controller is communicated with other control units by the CAN (controller area network).
The vehicle control system is shown in Figure 1, which consists of vehicle controller, motor and motor controller, power battery, power battery management system (BMS), fault diagnosis management unit, gearbox, main reducer, auxiliary system, and other components. The auxiliary system includes steering motor and its controller, air conditioning motor and its controller, braking system, DC/DC, and so on. The battery is the power source of the whole vehicle and provides power for all the equipment. The driver achieves the overall control of the vehicle through the vehicle control system.

The structure of the vehicle control system.
The CAN network topology is widely used in vehicle controls and can be shown in Figure 2, where the system consists of two communication channels. Channel 1 is a high-speed CAN bus and channel 2 is a low-speed CAN bus. For power system components with high real-time requirements, such as motor controller, BMS, fault diagnosis system, and on-board charger, high-speed CAN bus connection is adopted, and the communication rate can be up to 500 kbps. Low-speed CAN bus is employed for the acquisition and feedback of control signals with low real-time requirements in the vehicle, such as air conditioning, combination instrument, cooling system, and vacuum booster pump brake system, and the communication rate can reach up to 100 kbps. The fault diagnosis management unit is built on the high-speed CAN bus, which is responsible for the storage of vehicle fault information, the control of fault signal lamp, and the information interaction with non-vehicle diagnostic instrument. As a high-voltage safety management subsystem, the unit is responsible for the state monitoring of high-voltage circuit (contact resistance, insulation, pre-charging process, and main contactor), as well as the driving management of pre-charging relay and main contactor.
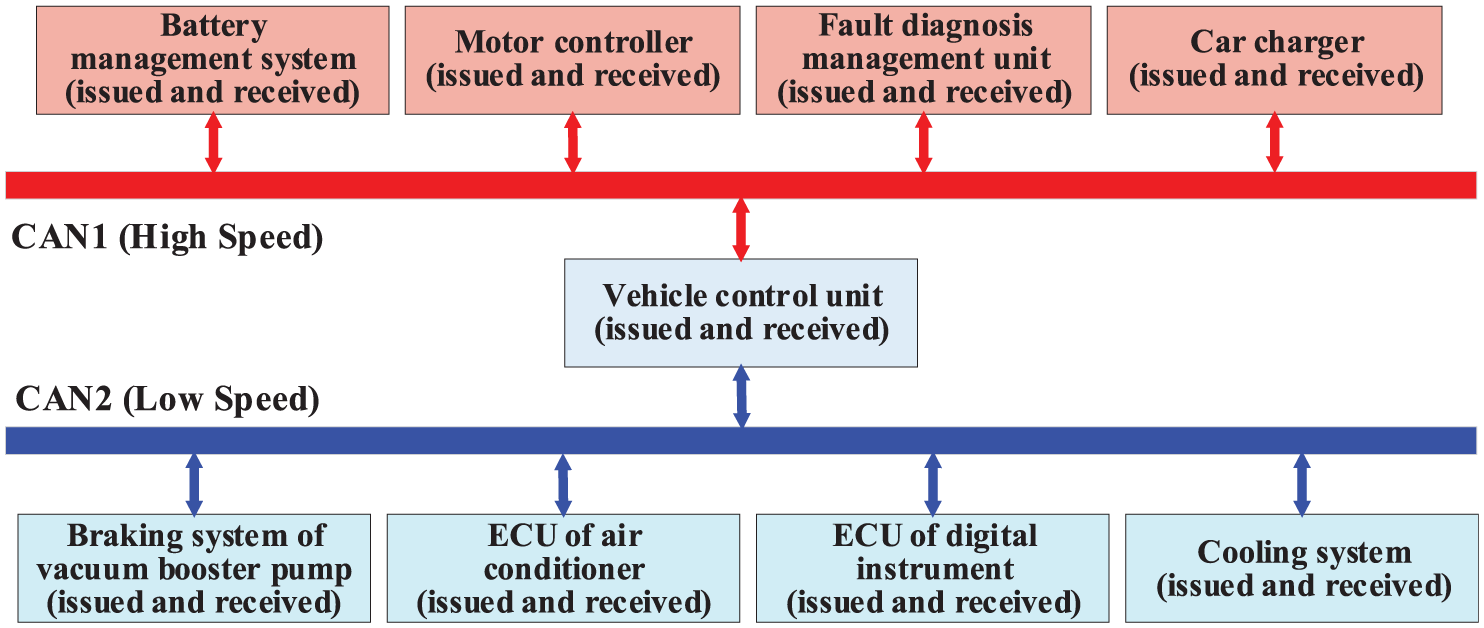
CAN network topology.
This study is focused on the centralized motor drive mode, which means the vehicle driving force is solely provided by one motor. The motor driving force is transmitted to the wheels through the gearbox, main reducer, and differential unit to drive the vehicle. By analyzing the gears, pedals, and other signals, the motor speed or motor torque is controlled by the vehicle controller to enable driving of the vehicle. The basic signals required for the vehicle controller are as follows:
Accelerator pedal signal. Based on the different degrees of the accelerator pedal, the vehicle controller is used to calculate the whole speed or torque requirements.
Brake pedal signal. Based on the brake pedal signal, the power on and power off of the motor are controlled by the vehicle.
Gear signal. Based on the gear signal, the neutral, forward, and reverse motions of the motor are controlled by the vehicle to achieve the vehicle forward and reverse driving.
Wheel rotational speed signal. Vehicle controller needs to collect the wheel speed signal to determine the driving state of the vehicle and to perform closed-loop control of the wheel speed.
Speed signal. The speed signal is collected to help determine the vehicle driving state and for display.
Table 1 shows the number of ports required for this project, including digital input, output, analog input, PWM (pulse width modulation) output ports, and three CAN bus communication channels. The central processing unit is based on Freescale MC9S12XDP512 microcontroller, 20 which can satisfy the requirements of the vehicle controller development and commissioning tasks greatly.
Number of ports of the vehicle controller.

PWM: pulse width modulation; CAN: controller area network.
Hardware design
The detailed pin definition of the vehicle controller is presented in Table 2. Each CAN module consists of a high channel and a low channel, which are respectively transmitted by two individual pins. Extra pins mentioned in Table 1 but not in Table 2 are reserved for later usage.
Pin definition of the vehicle controller.

The power, which is supplied to the vehicle controller, is provided by the 24 V vehicle battery. To convert the battery electricity into 5 V DC power needed by the ICs, there are two issues to be solved. The first is that the large voltage reduction from 24 to 5 V is difficult to convert using regular conventional power conversion ICs. The second is that the 500 kHz CAN signal is very sensitive to disturbances. In addition, it requires a pure power supply to avoid fluctuations, which means an independent power supply should be provided for the CAN module.
Therefore, the controller is designed with two-level power supply modules. The higher level is shown in Figure 3, which converts 24 V DC from the battery into 9 V DC by a switching power converter. To absorb surge from the battery power and filter out fluctuations and alternate components from the external circuit, large capacitors and inductors are added in the front end. TVS diode D01 is used to absorb surge power and avoid the damage of component surge pulse. PSU-24-9 is the voltage conversion module. The capacitance and inductance in the figure are mainly used for filtering. Meanwhile, the IN4007 diode provides reverse connection protection.

Higher level power supply module.
The lower level power supply module is shown in Figure 4, which is converted from 9 V DC into two separate 5 V DC power sources. One way based on LM2940 switching power IC is to obtain 5 V 2 W power, as shown in Figure 4(a), for the microcontroller and most of the other ICs. Another circuit in Figure 4(b) based on ASM1117 chip is to obtain stabilized 5 V power for the CAN circuit only.

Lower level power supply module: (a) Power supply for the control board and (b) Power supply for the CAN bus interface.
The microcontroller is based on a Freescale MC9S12XDP512 single chip computer and the minimum system is designed as recommended in the manual. 21 The CAN communication circuit is one of the most important parts of the controller. Each of the three CAN channels is based on one TJA1050 22 chip using the circuit, as shown in Figure 5. TJA1050 is a high-speed CAN transceiver.
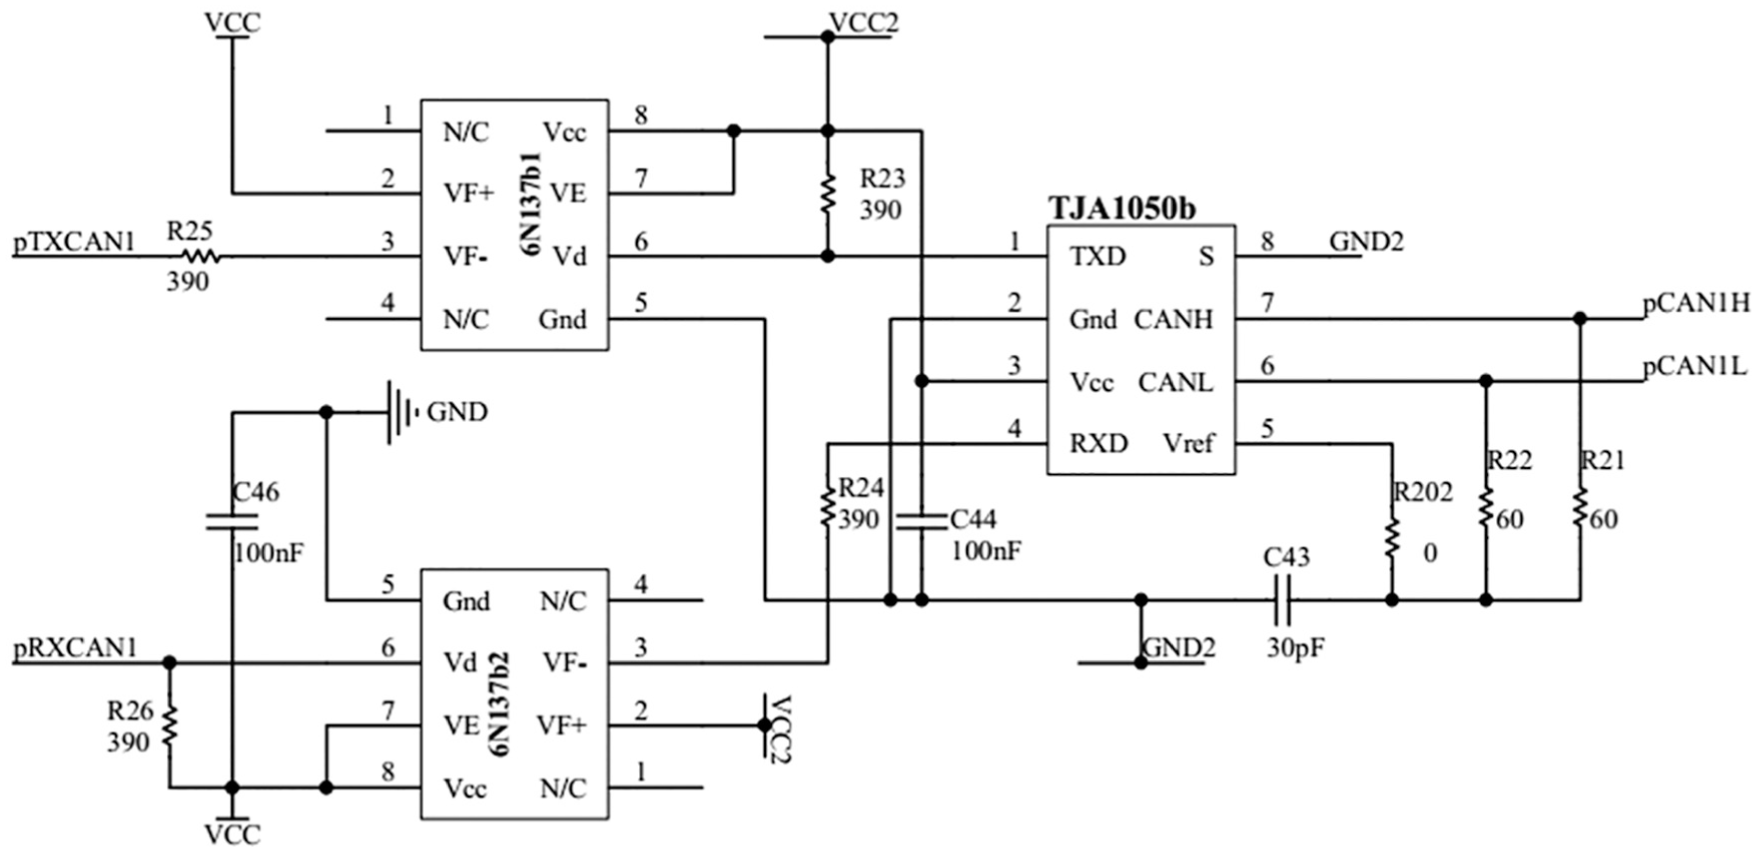
CAN communication circuit.
As shown in Figure 6, the digital input circuit is protected by a TLP521 optical coupler. Most of the digital inputs are negative controls, which means when an external switch is grounded, the 24 V DC current will go through the left side of TLP521, leading to the right side also connected to the ground. Therefore, VCC originally, applied on the microcontroller digital pin, will be discharged by giving a logic change from high to low. TLP521 is a current-driven photocoupler, and the resistance in the figure is current-limiting.

Digital input circuit.
As shown in Figure 7, the digital output circuit also uses TLP521 optical coupler to protect the microcontroller pins. The working principle is similar to that in Figure 6.

Digital output circuit.
Figure 8 shows an example of an analog input circuit. To remove fluctuations in the external signal, the input analog signal goes through a filter. Then it applies on the analog input pin of the microcontroller. To remove high and low frequency noises, two capacitors are set as 0.1 and 0.001 µF, respectively. The resistance and capacitance in the figure make up the filter circuit.

Analog input circuit.
Control strategies
The vehicle control strategies have been modeled in the MATLAB/Simulink and AVL.Cruise22–26 and summarized into torque control mode, as follows.
Based on the electric vehicle dynamic performance index, the three-phase asynchronous motor with the model HPQ7.5 ybe-72 is finally selected, with consideration of the motor efficiency and reliability. The motor rated power and peak power are 15 and 7.5 kW, respectively; the rated torque and peak torque are 26.5 and 115 N m, respectively; and the rated speed and maximum speed are 2700 and 5500 r/min, respectively, which meets the demand of power index design.
Acceleration pedal signal processing mode
The signal of acceleration pedal opening can directly reflect the demand intention of the motor torque of the driver compared with other input signals, which is closely related to the safety of personal property. According to the standard of ISO26262, it is necessary to design the signal collecting sensor of acceleration pedal, which is opening with redundancy to ensure its safety and reliability. More importantly, because of the signal interference and the electromagnetic interference of the road roughness, acceleration pedal sensitivity, and the high-voltage circuit of the electric system, the filter circuit for the signal of acceleration pedal is necessary, which is designed to dispose the anti-interference and anti-fluctuation. Two non-contact hall sensors are employed to pick up the signal of acceleration pedal opening to ensure the reliable of the work, which will increase the redundancy and improve the ability of the system fault self-diagnosis in this study.
As shown in Figure 9, in the scope of the pedal travel, two-way signal voltage ΔU = 0.5 V, the two output signals are simultaneously processed by the VCU which is calibrated to digital by the A/D conversion module. Then, the final signal of acceleration pedal opening (input signal of the control strategy) is obtained by removing the dither with the filtering, threshold, and the synchronization monitoring. The flowchart of the acceleration pedal signal acquisition is shown in Figure 10.

The characteristics of the sensor output signal.

Acceleration pedal signal collection flowchart.
Filtering processing
The error of road roughness, the jitter of the driver, and the sensitivity of the accelerator pedal will generate the occasional interference signal in the vehicle driving. It is necessary to dispose the signal of accelerator pedal strictly due to the error of the accelerator pedal signal which will cause the loss of vehicle control. To guarantee the sensitivity and reliability of the signal, the acceleration pedal signal collecting and filtering algorithm is put into the interrupt service program, which employs the first-order low-pass RC filter circuit for the collection of accelerator pedal signal and removes the dither of secondary filtering.
Threshold processing
The output voltage Uout will be abnormal when the trouble occurs such as short-circuit and open-circuit of accelerator pedal or the electromagnetic interference of the electric vehicle high-voltage circuit. By comparing the U0 and the voltage, present value of the accelerator pedal in the memory is (Umin, Umax), if U0 < Umin, Uout = Umin is output; if U0 > Umax, Uout = Umax is output.
Synchronization monitoring
As shown in Figure 9, the difference between the output signals of the two sensors is 0.5 V in the normal condition. The simultaneity of the two output signals is judged by synchronization monitoring mode, which will guarantee the accuracy and reliability of the signal.
The signal acquisition module is built in SIMULINK to realize the off-line simulation. The simulation model is shown in Figure 11, while the results are shown in Figure 12, where the red line is the original signal and the blue line is the post-processing signal. In addition, the established model is ideal for the signal processing shown in Figure 12.

The signals acquisition module.

Simulation comparison.
Model analysis of control strategy
There are three processing curves for acceleration pedal opening and motor torque load factor L, as shown in Figure 13.27,28

Accelerator pedal treatment curve.
In Figure 13, a, b, and c correspond to general mode, dynamic mode, and economic mode, respectively. Under the dynamic model, the speed of acceleration is strong and adapts to high load and slope. Under the general mode, the acceleration is stable and suitable for smooth running condition. Under the economic model, the power battery and the driving motor can be fully utilized and the energy utilization rate is high.
Integrated mode control strategy
From the above analysis, the single-mode control strategy can only meet the single driving condition, while the urban road conditions are diversified. A comprehensive control strategy should be designed according to the specific road conditions.
The driver’s demand power is not only reflected in the accelerator pedal opening but also related to the change rate of pedal opening. With the change of the same pedal opening, the more urgent the driver’s demand for torque is, the faster the pedal opening rate will be changed.
In this section, the torque of the basic torque is given based on the given integrated mode, and the compensation torque considering the change rate of pedal opening is used as the motor torque MAP of this study. In general, MAP is a kind of data curve generated during motor testing, which mainly reflects the distribution of motor efficiency under different rotational speeds and torques.
Basic output torque
The driver’s demand for torque is directly reflected on the depth of his accelerator pedal. If the driver needs a large torque, such as rapid acceleration and fast start, the driver will step down the accelerator pedal and the pedal opening value is also larger, which is close to the dynamic pattern recognition. If the driver needs less torque, that is, when the vehicle starts steadily and accelerates slowly, the driver step down the speed pedal is shallow, and the pedal opening is also smaller. It is close to energy-saving pattern recognition. In this case, the method used in this article is to employ the L-Acc curve under the energy-saving mode when the speed of the accelerator pedal is 0%–20%. The L-Acc curve under the general mode is adopted when the speed of the accelerator pedal is accelerated from 20% to 80%, while the L-Acc curve under the dynamic mode is adopted in the 80%–100% accelerator pedal opening, and the three-section curve is interpolated. The minimum interpolation method is used to get the corresponding relationship between the torque load coefficient L and the accelerator pedal opening Acc in the integrated mode, and the L-Acc curve is shown in Figure 14.

Acceleration pedal treatment curve under comprehensive mode.
The motor torque MAP is shown in Figure 15. Based on the graph, torque changes are more intensive under low opening and high opening, which can consider both vehicle power and economy. Under medium pedal opening, the torque increases uniformly to meet the general needs of vehicle running in the middle period.

MAP curve of motor torque under comprehensive mode.
Torque of compensation
The control strategy of the above comprehensive model can basically meet the torque requirements of different working conditions. On this basis, the sensitivity of torque output to driver’s operation can be further improved by proper correction. The basic torque of the comprehensive model does not consider the influence of the driver’s speed of the accelerator pedal on the torque demand. When the driver urgently needs acceleration, the speed of the accelerator pedal will have a great change rate. Besides, the driver controls the vehicle mainly by judging the speed of the vehicle. Therefore, two independent variables can be chosen as the input variable of the fuzzy controller, which are the speed of the vehicle and the speed of the accelerator pedal opening. The compensation torque is decided and the torque MAP curve is added to the integrated mode to improve the operation sensitivity. This article will take the pedal opening rate and speed as input, the compensation torque as output, and then a fuzzy controller is designed, which can better achieve the driver’s intention.
Fuzzy control refers to the precise mathematical model that does not depend on the system, fuzzing the variables and defining the membership function. The precision of calculating the output by the fuzzy rules is worth the control algorithm. Compared with classical control theory, it has strong robustness.25,26,29
The domain division of the variables is defined as follows. The speed range of the low-speed pure electric vehicle is defined by second chapters as 0–50 km/h, and the domain is divided into five intervals, including the lowest ZS, low speed S, medium M, high speed B, and the highest HB. The range of acceleration pedal change rate is 0–100%/s, and the domain is divided into minimum ZS, small S, medium M, large B, and maximum HB. The compensation torque range is 0–20 N and the domain is divided into minimum ZS, small S, medium M, large B, and maximum HB.
The membership function of each variable is defined as follows. The speed of the input variable and the change rate of the accelerator pedal speed use the triangle function, the output variable compensation torque is Gauss’ function, and the traditional Mamdani-type fuzzy inference rules are used to get the membership function curves of the three variables, such as Figures 16 –18.

Vehicle speed membership function.

Membership function of accelerating pedal opening change rate.

Compensation torque membership function.
The fuzzy rules are defined as shown in Table 3.
Fuzzy control rule of compensation torque.

The drawing compensation torque surface using MATLAB is shown in Figure 19.

Compensatory torque curve.
It can be seen from the compensation torque curve in Figures 3–18, that the compensation torque is larger in the low-speed startup stage and the fast-speed acceleration stage when the accelerator pedal is opened. Meanwhile, the demand power is increased, and the actual control requirements are met.
Simulation and analysis of vehicle dynamic performance
To further verify the drive control strategy, AVL-Cruise simulation software is used to analyze the vehicle’s dynamic performance. Parameters of each module are set in AVL-Cruise, and once the settings are completed, the whole vehicle simulated will be started. The simulation condition is selected as the standard urban cycle condition in China, including a variety of working conditions such as rapid acceleration, which can verify whether the driving control strategy in this article can meet the requirements of the vehicle’s dynamic performance. Finally, the simulation results are compared with the real vehicle test results. Figure 20 shows the typical urban driving cycles in China. Figure 21 shows the built vehicle model.
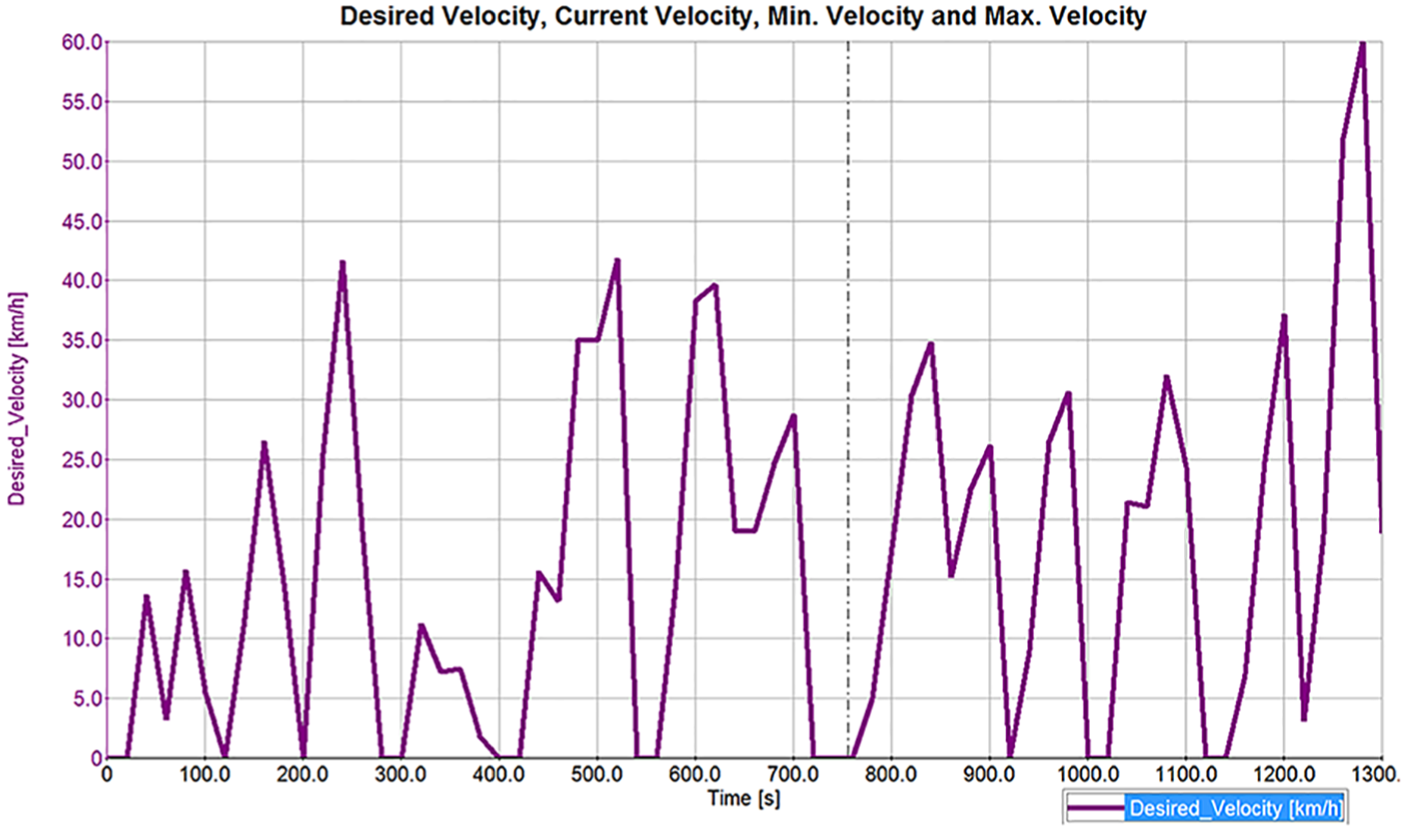
Typical urban driving cycles in China.

Vehicle simulation model.
Figure 22 shows the simulation results of speed following. As can be seen from Figure 22, the actual speed of the car can basically follow the speed required in the cycle condition. When the vehicle needs rapid acceleration (the speed needs to be accelerated from 0 to 50 km/h), the vehicle’s power performance is obviously insufficient. The main reason is that the maximum speed is about 40 km/h determined by the peak characteristic curve of the motor and the reducer, which is consistent with the dynamic performance index we proposed and the subsequent real vehicle bench test.

Simulation results of speed following.
Control software
Underlayer software design
The underlayer of the controller software performs analog acquisition, digital acquisition, digital output, and CAN bus driver, which connect the system hardware to the application layer. 29 It is designed for the specific hardware and called up by the application layer. The functions of the underlayer software modules are introduced below:
Analog acquisition. The vehicle controller needs to collect the analog signals, such as the braking signal and the accelerator pedal signal. Meanwhile, it provides the reference and judges the basis for the driving control application based on the value of these analog signals. The analog acquisition is realized by the AD function of the microcontroller. The AD module of the microcontroller converts the input analog signal into digital quantity. The actual voltage value of the analog input can be obtained by reading the corresponding register.
Digital acquisition and output. The value of the digital acquisition is 0 and 1. When the supply voltage is 5 V, the microcontroller contains hysteresis ranging between 1.75 and 3.25 V. When the voltage is higher than 3.25 V, the value returned by the register is 1 (high level), and when the voltage is lower than 1.75 V, the register returns a value of 0 (low level). Filtering is not needed for the digital ports. The vehicle controller reads digital signals from the charge confirmation switch, braking switch, and other detection levels to control the vehicle. The digital outputs are in a similar manner related to many relays to perform functional controls.
CAN bus driver. The CAN bus underlying driver includes bus module initialization, the sending message program, and the receiving message program. The CAN module 1 and module 2 both use baud rate of 500 kHz.
Application layer software design
The application layer of the controller software performs the following working modes:
Charging mode. When the power is plugged into the charging interface, VCU will collect the effective charging enabling signal and CAN bus signal from the charger, and make charging judgment. When the vehicle is in the static state, the gear is neutral, the throttle is reset to zero, the main contactor of the motor controller is turned off, and the BMS is fault-free. Then, the VCU sends the allow charging CAN message to the BMS. After charging starts, the charging contactor is open, and the vehicle is prohibited to enter other modes until charging ends.
Starting mode. In this mode, the VCU performs the related action according to the position of the key. If it is placed in the ON position, the system performs self-test. When the related pre-charging operation is completed, and the pre-charging contactor is closed, it can enter the starting mode.
Driving mode. When the vehicle is in the non-charging state, the key is placed in the START position for more than 0.5 s, and the power system (including VCU, MCU, and BMS) if free of emergency failures then it can enter the driving state. After entering this mode, the VCU calculates the current desired torque based on the accelerator pedal position information, the brake pedal information, the gear position information, the vehicle speed, and the state of the battery and the motor, and drives the vehicle by transmitting the desired torque to the motor controller.
Fault diagnosis mode. According to the abnormal operation and fault information on the vehicle, the system performs control of the vehicle driving state.
The system working process can be described by the flowchart in Figure 23.
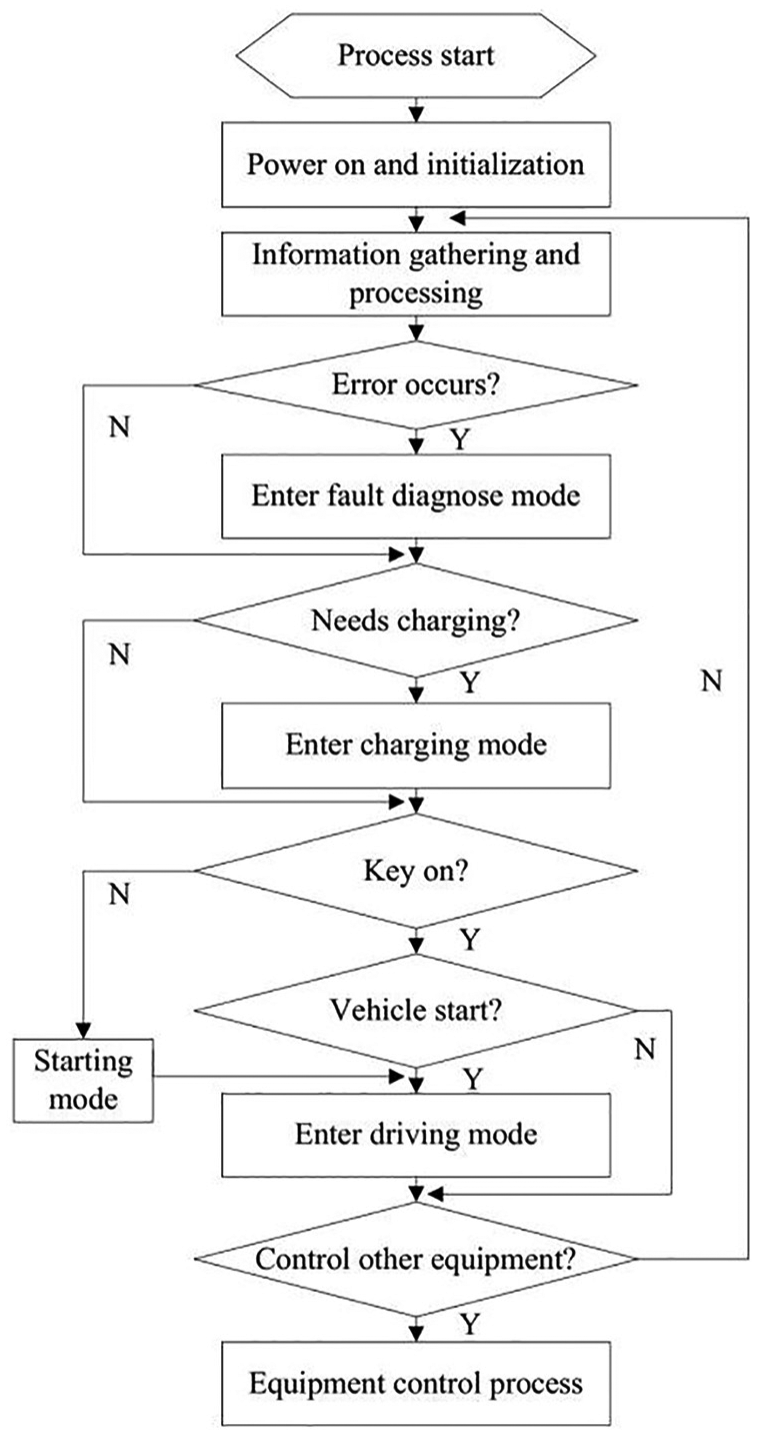
The vehicle control flowchart.
The driving mode is the most important part of the controller since it determines how the vehicle runs on the road and how emergency is handled. The flowchart of the driving mode is presented in Figure 24.

The driving mode control flowchart.
Calibration and experiment
Manufacture of prototype controller
As shown in Figure 25, a prototype controller board has been made in the lab after a comprehensive design of hardware and software of the controller. A standard industrial connector has been equipped on the board to enable connection with a vehicle.

The vehicle controller prototype.
The functionalities of the controller have been tested thoroughly to ensure all the digital and analog ports are working properly. The CAN interface circuit in the earlier version of the design did not use independent power supply, and the signal quality, which is shown in Figure 26(a), is badly affected by the power source and the electromagnet effects. In the final prototype, an independent power supply based on ASM1117 has been added very close to the CAN circuit and leads to very good signal quality as shown in Figure 26(b).
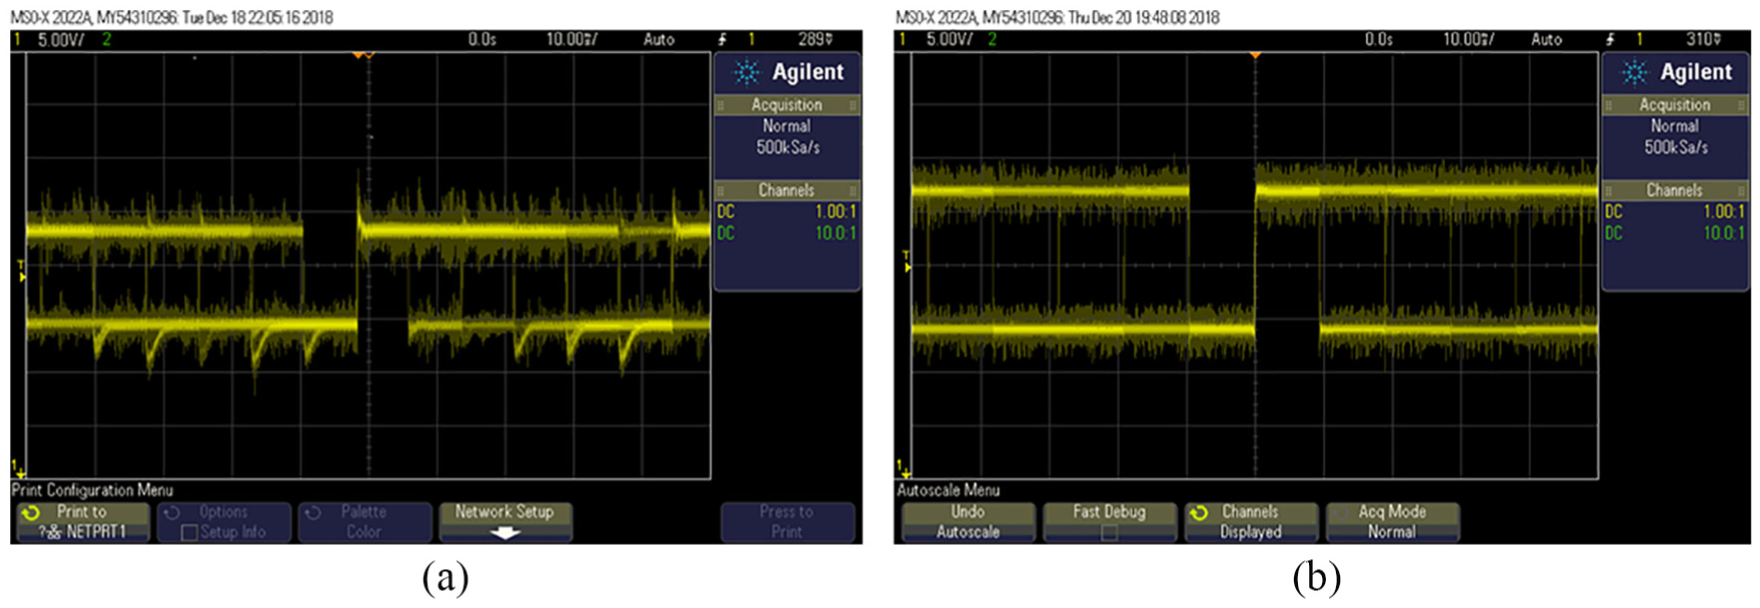
The quality of the output CAN signal: (a) without using independent power supply and (b) using independent power supply.
Calibration and experiment
The calibration process is mainly to achieve two aspects of the functions, one is to monitor the parameters of the vehicle controller and the second is based on the calibration process to adjust the parameters online. The calibration contents include both bench calibration and on-vehicle road calibration. This study is aimed at constructing a vehicle controller research and development platform, and therefore, it is more focused on the bench calibration methodology. It is mainly based on simulation results to test and verify the control algorithm, and the main contents are as below:
Static parameter calibration, such as motoring maximum torque/power and base speed.
Simulate a variety of driving conditions, such as starting, driving, and braking, test design functions and analyze dynamic characteristics.
Comprehend the law of calibration for a variety of parameters and determine the approximate parameter reference values and calibration range.
As shown in Figure 27, the bench test system has been developed based on a 55 kW dynamometer machine. Accelerator pedal, braking pedal, and gear signals are connected to the vehicle controller to simulate a vehicle operation environment, the controller output is sent to the motor controller, and the dynamometer machine is adjusted in several different scenarios to simulate vehicle driving conditions.
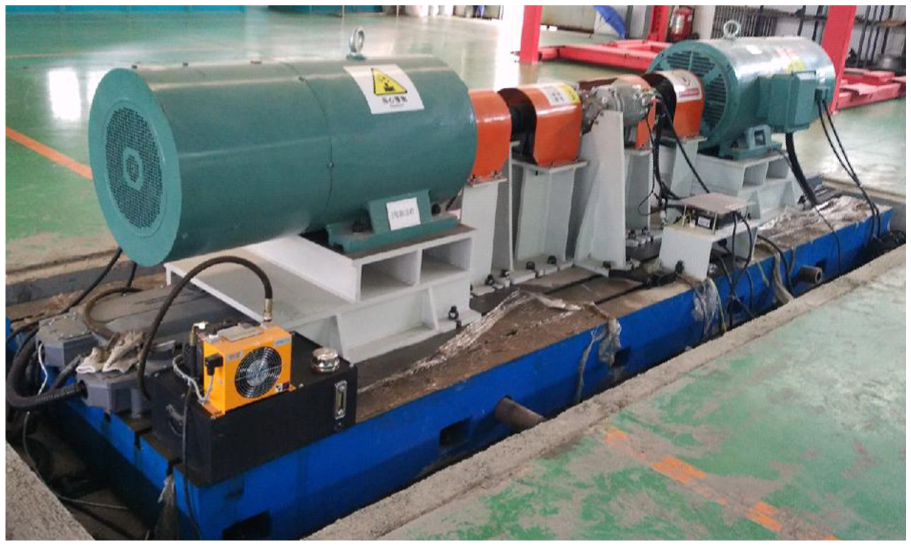
55 kW dynamometer test system.
The dynamometer output was recorded in the software for analysis. Figure 28 shows the controller output torque in red color varies with the braking signal in blue color. Greater braking signal leads to higher braking torque. The gear level indicated by the green line remains the same, and the throttle level in yellow color is released during braking.

Changes of output torque (red) with braking signal (blue).
Figure 29 shows the changes of torque in the red curve varies with throttle signals in yellow, combined with gear changes in the green color. The gears are only set to 0 neutral, 1 forward, and 2 reverse. Therefore, it can be seen with gear 1, the output torque rises quickly with the throttle signals, while with gear 2, the output torque expands in the negative area with opening throttle signals, indicating a reversing state.

Changes of torque (red) with throttle (yellow) and gear (green) levels.
After all, many results can be collected from the vehicle controller research and development platform. These should be comprehensively analyzed and optimized to construct stable and efficient vehicle control strategies, which will be investigated in later studies.
Conclusion
This study presents a design of a vehicle control research and development platform. The platform consists of a genuinely designed vehicle controller and a 55 kW dynamometer test system, connected with CAN bus communication protocol and torque control strategies. The major contribution of this article is it presents a complete design structure of such a complex system, which is rare in public academic literatures. The controller hardware is constructed with a Freescale MC9S12XDP512 single chip computer as the central processing unit. The system is designed with the following features:
The controller hardware incorporates dual power supply modules to provide adequate power for the ICs and pure DC power supply by the CAN communication circuit, leading to robust performance and high quality of CAN signals.
Based on TJA1050 ICs, 12 digital input channels, 12 digital output channels, 8 analog input channels, and other features, three CAN channels are designed to satisfy the comprehensive I/O and communication requirements for vehicle control applications.
The platform utilized the ADVISOR (Advanced Vehicle SimulatOR) software in MATLAB/Simulink environment to simulate vehicle dynamics and developed vehicle control strategies for torque control modes. To implement the control strategies, the underlayer and application layer software are developed.
Based on a 55 kW dynamometer machine, a test platform is constructed to calibrate and test the control parameters, and comprehensive test results are obtained.
In later studies, a large amount of experiments can be carried out on the platform, and the experimental results will be thoroughly analyzed to construct optimized vehicle control strategies and control parameters for different types of vehicle models.
Footnotes
Handling Editor: Yanjun Huang
Declaration of conflicting interests
The author(s) declared no potential conflicts of interest with respect to the research, authorship, and/or publication of this article.
Funding
The author(s) disclosed receipt of the following financial support for the research, authorship, and/or publication of this article: This study was supported by the National Natural Science Foundation of China (Grant No. 61703192), Shandong Province Higher Institution Science and Technology Plan Project (Grant No J17KA028), Special Fund Plan for Local Science and Technology Development Lead by Central Authority, Shandong Province Natural Science Foundation (Grant No. ZR2014EL023), and Scientific Research Fund of Liaocheng University, China (Grant No. 3180500/318011519).