
Abstract
In view of the little research that has been conducted on the ride comfort of mini vehicles, an electric mini off-road vehicle was designed in this study and a 2 degree-of-freedom quarter car model was established to investigate the ride comfortability. The amplitude-frequency and vibration response characteristics of the suspension were analyzed with the natural frequencies of the front and rear suspensions selected in accordance with the required driving performance. A comprehensive objective function with respect to the safety and comfortability was established, and the damping ratio of the suspension was determined. The damping characteristics of the shock absorber were analyzed to derive an adjustment rule of the suspension damping ratio. The piecewise linear speed characteristics of the shock absorber were subsequently obtained, and suspension-parameter identification and ride comfort tests were conducted. The test results showed that the natural frequencies and damping ratios of the front and rear suspensions were 1.676 and 1.922 Hz, and 0.225 and 0.242, respectively. The results of a pulse input test and D-level road random running test also demonstrated the safety and good ride comfortability of the vehicle.
Introduction
Recent years have witnessed the rapid development of vehicles powered by unconventional types of energy, such as electric vehicles. However, the mileage of electric vehicles has been limited by the low battery capacity and efficiency. Nevertheless, electric mini off-road vehicles (EMORVs) used for special purposes such as single-person weapons and equipment transportation benefit from their small size and are characterized by low noise, good maneuverability, and easy concealment. Moreover, the weight limit imposed on individual combat equipment reduce the operation weight of EMORVs used for transporting them, enabling the vehicles to travel longer distances compared with conventional military off-road vehicles with the same battery capacity. Many studies have been conducted on the ride comfortability of conventional off-road vehicles. Han et al. 1 experimentally investigated the vibrational performance of an off-road vehicle on an uneven road and proposed evaluation of the mobility based on the vehicle speed corresponding to the vertical vibration power absorbed by the human body. Similarly, Zhou et al. 2 simulated the ride comfortability of an off-road vehicle on a soft terrain and found that a suspension adapted to a hard ground was not suitable for a soft one. Sun 3 investigated the vibration prediction of a mobile missile transporter and developed a detailed calculation process, although he did not undertake an experimental verification. Els et al. 4 observed that the spring and damper characteristics required for good vehicle handling differed from those required for ride comfortability and suggested the use of a suspension system capable of safely and predictably switching between a stiff spring and high damping mode (for handling) and a soft spring and low damping mode (for ride comfortability). Several researchers have also developed a method for evaluating the ride comfort of an off-road vehicle. Xia et al. 5 and Els 6 investigated the correlation between the objective methods for determining ride comfort and the subjective comments of vehicle drivers and posited that the ISO2631, BS6841, average absorbed power, and VDI 2057 methods could be used to specify and evaluate ride comfort. They, however, also noted that the acceptable ride comfort limits may vary. Shi et al. 7 simulated and tested the ride comfort of mini-electric vehicles and found that they could not afford ideal ride comfort at speeds above 50 km/h on a Class-B road. However, no study has been conducted on the ride comfort of a mini vehicle on a worse road surface. Ni et al. 8 experimentally investigated a modified electric vehicle, improved the ride comfort of the whole vehicle, and verified the economic advantage of the modified vehicle. However, their method limits the improvement of the suspension structure and the degree of innovative design that can be achieved. Yang et al. 9 modeled and simulated the ride comfort of a four-wheel independent-drive electric vehicle and obtained the time-domain and frequency-domain simulation results with respect to the ride comfort index. Based on the results, they optimized the ride comfort of the electric vehicle. Compared with conventional off-road vehicles, mini off-road vehicles have a smaller wheelbase that is more sensitive to ground roughness. This makes an investigation of the ride comfort of mini vehicles significantly more important. Zhou and Els showed that it was difficult to simultaneously adapt a passive suspension to various road conditions. It would therefore be beneficial to develop a suspension system with easily adjustable stiffness and damping to meet the requirements of different road conditions. This type of suspension system was designed and analyzed in this article.
Vehicle structure
The structure of the EMORV considered in this study basically consisted of a steering system, power battery pack, suspension, brake system, car frame, driving system, and seat (Figure 1). The stipulated limit of the weight borne by a soldier under normal temperature conditions is 40 kg. 10 Hence, to maximize the combat capability of a soldier and considering the power performance of the EMORV, the design effective load-bearing capacity of the present EMORV was set to 250 kg. The main design parameters are listed in Table 1.
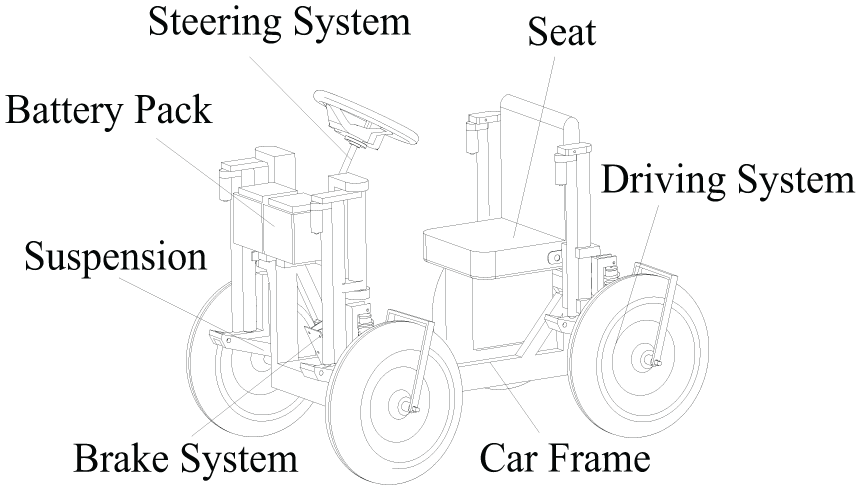
Schematic diagram of the EMORV.
Main parameters of the EMORV.

EMORV: electric mini off-road vehicles.
Vehicle vibration model
Considering the complexities of a natural environment, particularly the unpredictability of the weather, such as with regard to the occurrence of rain or snow, a waterproof rigid seat was utilized in the EMORV. The seat could be dismantled as may be necessary for the performance of special tasks. Consequently, the seat stiffness and damping were not considered in the analysis. Moreover, only the characteristics of the vibrations transmitted from the ground to the frame were investigated in this study. Assuming a two-axle vehicle with a mass distribution coefficient (

where r,

Two-DOF quarter car model.
The differential equations of the system vibrations are as follows 14

where
In an analysis of the vibration characteristics of a vehicle using a quarter model, the damping of the tires is often ignored; hence, equation (2) can be rewritten as follows15,16

Analysis and design of suspension
Analysis of suspension characteristics
When the EMORV is running, the main inputs of the vibration system are the road roughness and vehicle speed, and the output parameters include the dynamic deflection of the suspension

where
In suspension analysis, the mean square value (MSV) of the vibration response is typically used to describe the vibration intensity. According to the theory of the driving vibration of a vehicle,
16
the MSV of
where
Structural design of suspension
There are two main types of automobile suspensions, namely, independent and non-independent suspensions. Examples of independent suspensions are horizontal arm, vertical arm, candle, MacPherson, and single oblique arm suspensions.
17
Another type is the longitudinal arm suspension, which occupies less space between the wheels and frame than the other types. This characteristic helps lessen the impact of a collision in the area between the wheels and the interior of the vehicle and affords greater compactness of the entire vehicle structure. A longitudinal suspension was adopted in the present EMORV, as depicted in Figure 3, where

Structural diagram of the utilized suspension.
The design scheme of the EMORV includes an independently installed damping spring and damper. When the spring position is fixed, the lever ratio and installation angle of the shock absorber can be adjusted within certain ranges. In addition, the lever ratio and installation angle of the shock absorber can be changed to achieve a favorable ξ of the suspension. The suspension spring and damper are designed to be at certain distances from the wheel axis, and the central axes of the spring and damper are positioned at certain angles with respect to the vertical line of the wheel axis (Figure 3). This causes the stiffness and damping of the suspension to differ from those of the spring, as expressed in equation (6)

where
Damping ratio selection
When the EMORV is operated on an uneven pavement, if
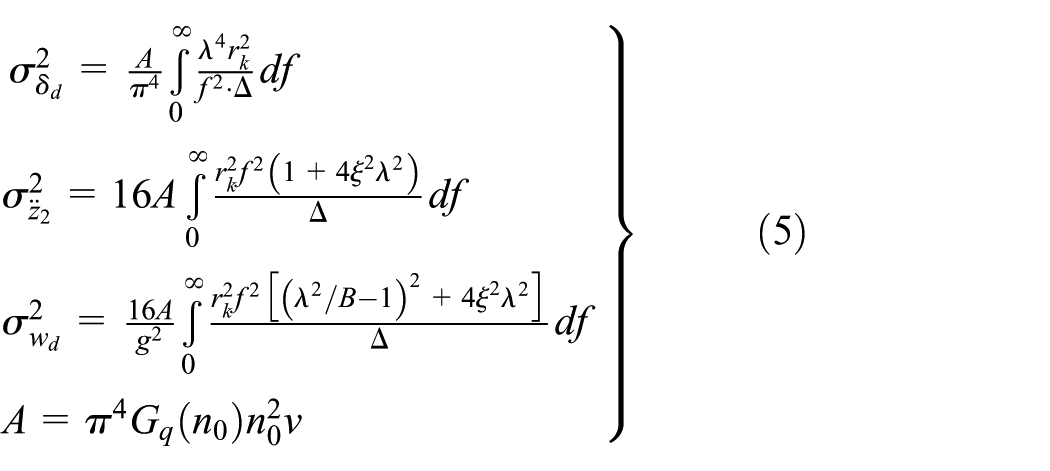
In this study, the dimensionless objective function

where
With reference to equation (5), equation (7) can be expressed as follows

where
The sprung mass of the front axle was set in this study to be equal to that of the rear axle, and it was directly driven by the hub motors. The dynamic stiffness of the tires of the EMORV was approximately 1.1 × 10⁵ N/m for a tire inflation pressure of 140 kPa and tire load of 1000 N. 18 The design parameters of the suspension are listed in Table 2.
Design parameters of the suspension.

The value of ξ of the suspension was determined by simulating

Simulation results: (a) variations of
Figure 4(a) and (c) shows that ξ can be set between 0.15 and 0.23 and between 0.17 and 0.25 for the front and rear suspensions, respectively. It can be seen from Figure 4(d) that the RMS of
Analysis of amplitude-frequency characteristics
Based on the parameters of the suspension, the amplitude-frequency characteristics of the suspensions were obtained using equation (4), as presented in Figure 5. The amplitude-frequency characteristics of the rear suspension are analyzed below as an example.

Amplitude-frequency characteristics of the rear suspension: (a) amplitude-frequency characteristics of the VVA, (b) amplitude-frequency characteristics of
Figure 5(a) and (b) shows that with increasing ξ, the amplitudes of
Analysis of damping characteristics of shock absorber
This section presents an analysis of the rear suspension damping. When

where i,

Variation of
Figure 6 shows that, when
Variation of
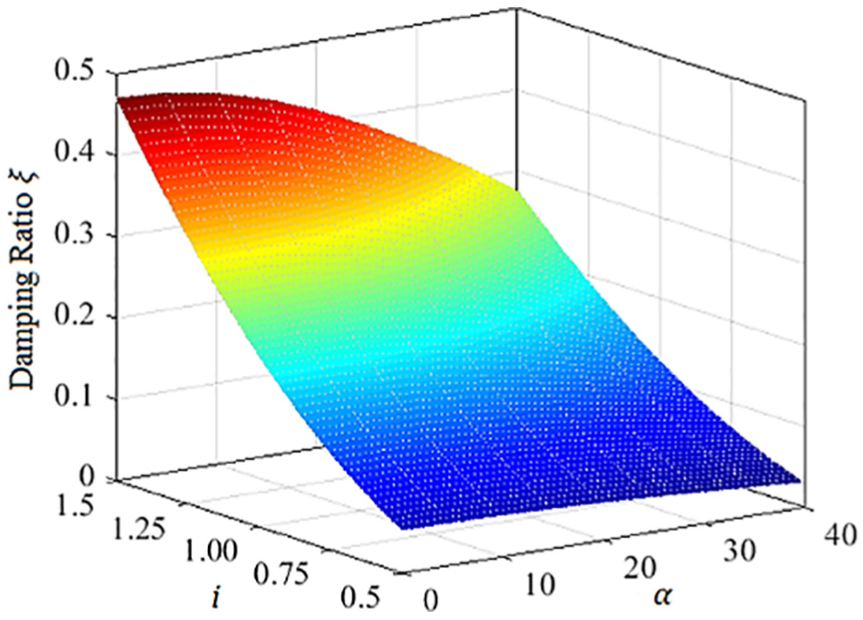
The damping force of a shock absorber is related not only to the inherent properties and installation parameters but also to the speed of the piston rod of the shock absorber. 21 This is because of the linear relationship between the damping force and the speed of the damper opening valve. The damping properties of the entire process can thus be described by equation (10). Figure 8 illustrates the damping characteristics of the EMORV shock absorber with respect to the lever ratio for an installation angle of 30°

where

Damping characteristics of the shock absorber.
From Figure 8, ξ of the rear suspension was determined to be 0.25. The theoretical determination process was based on the surface values of the piecewise linear characteristic curve for a given lever ratio. The shock absorber parameters used for actual testing are often inaccurate and sometimes unknown, but the trends of the selected damper are generally as shown in Figure 7. Therefore, when it is necessary to achieve a certain ξ value of the suspension, efficient adjustment can be achieved with rapid convergence to the design value stipulated by regulations. Figure 8 shows the piecewise linear velocity characteristics of the damping force for an established lever ratio. The lever ratio and installation angle implemented in the present EMORV were approximately 1.3 and 30°, respectively. The damping force curve of an absorber with a lever ratio of 1.3 can thus be used to represent the characteristic curve of the theoretical piecewise linear speed of the shock absorber.
Simulation and test
According to the theory of the random vibration of a vehicle, the VVA between the front and rear axles is less than that of the body above the axles. Thus, in this study, the VVA above the front or rear axle was adopted as the simulation and test object, because of its higher safety margin.
Determination of natural frequency and damping ratio
The LabVIEW 2014 software was used to develop the acquisition program. An NI USB-6009 data acquisition card and MMA7361 three-axis vibration acceleration sensors were employed for the data acquisition. The sensors were mounted on the front and rear axles, with the vehicle body directly above them. The roll-down test method was adopted. 22 Concisely, the two front or rear wheels of the EMORV were first placed on a convex block of height 60–120 mm and pushed down from the block (Figure 9(a)). The vibrations that occurred during the process were monitored and recorded. Table 3 presents the results of the test, subsequent analysis, and processing of the test data. Figure 9(b) shows the VVA attenuation curves of the wheels and body, as obtained from the final fitting curve.
Stiffnesses and natural frequencies of the suspensions.

AVG: average value.

Test results of the natural frequency and ξ: (a) test site and (b) free vibration attenuation curve.
The experimental results showed that the stiffnesses of the front and rear suspensions were within the predetermined design range. Because of the adjustable damping structure, ξ of the suspensions could be efficiently adjusted. Thus, the experimental values of ξ could be made to approach the design values through a few adjustments of the lever ratio and installation angle of the dampers.
Impulse input design for simulation and testing
The stochastic input model was established based on the differential equation of the single-wheel road roughness 23 and can be expressed as follows

where
Speeds of 0–30 km/h on an A-level road were implemented in the simulation and test. In the simulation, excitation was implemented by the superimposition of an impulse signal on a random input signal, while a single triangular convex block 24 was used for pulse excitation in the actual test. Figure 10(a) shows the standard size of the pulse excitation block, while Figure 10(b) shows the test site.
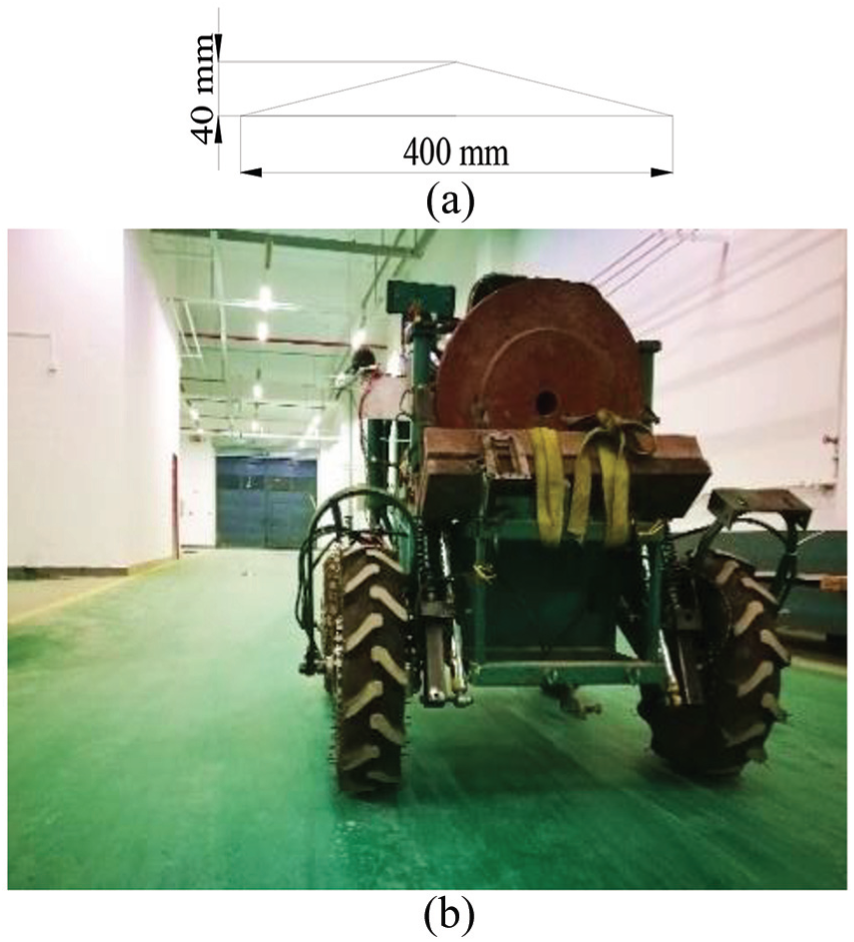
Pulse input for the test: (a) standard size of the pulse excitation block and (b) pulse input test site.
It should be noted that, during the test, the suspension did not impact the limit block and the control performance did not deteriorate. There is good agreement between the results of the simulation and experiment; specifically, both sets of results show that the VVA of the vehicle body immediately increases as the wheels pass through the pulse excitation block, and that the maximum VVA is proportional to the vehicle speed.
Figure 11(a) shows the response curve for an operation speed of 25 km/h. Figure 11(b) shows that the test-based VVA curve is higher than the simulation-based curve. Further analysis reveals that, in addition to the effect of the structural and testing errors, there is also the need to consider the influence of the shock absorber damping force. Furthermore, a higher speed shortens the action period of the pulse excitation block, increases the velocity of the damper, increases the compression damping force, and increases the vibration acceleration of the body. These observations confirm that the ride comfort can be improved by reducing the damping coefficient of the shock absorber compression stroke.
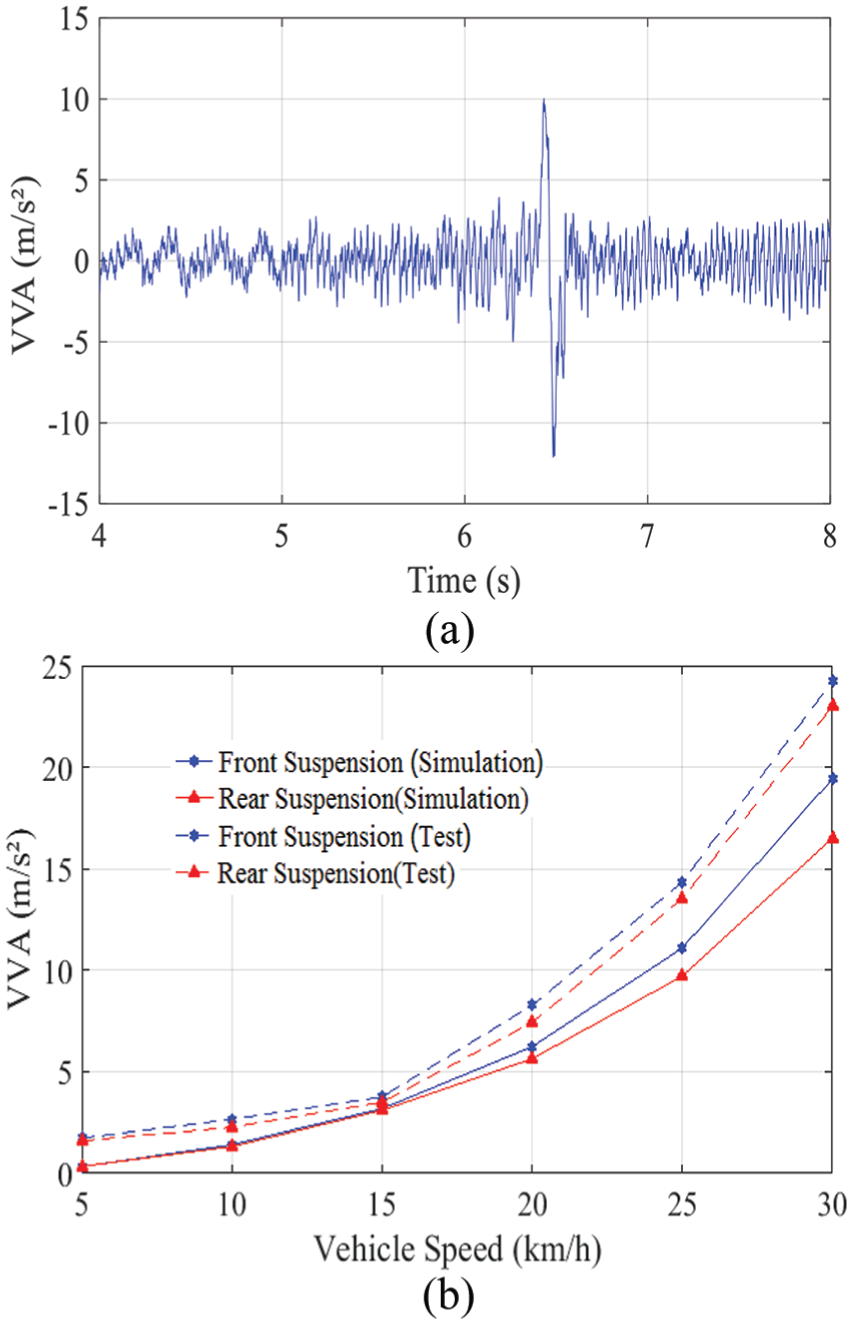
Simulation and test results: (a) VVA in response to the pulse input (25 km/h) and (b) maximum VVAs of the simulation and test.
Simulation and test of D-level road driving
Equation (11) was used to generate the random input on a D-level road to obtain the VVA of the vehicle body (Figure 12(a)). An idle grassland was specifically used as the test site. The VVA of the EMORV for an operation speed of approximately 30 km/h was found to be within the safe vibration acceleration level of approximately 31.44 m/s2. 25 The results of the random driving test (Figure 12(b)) thus indicate that the EMORV can be safely operated on a D-level road up to the maximum design speed of 30 km/h. Figure 12(b) shows that the test data are much higher than the simulation data over a certain period. This is mainly because the test road surface was not an ideal driving surface, with many sudden changes occurring over it, such as ditches and ridges. The passage of the wheels through such areas inevitably induced pulses at the variable cross section, resulting in higher data compared with the simulation.
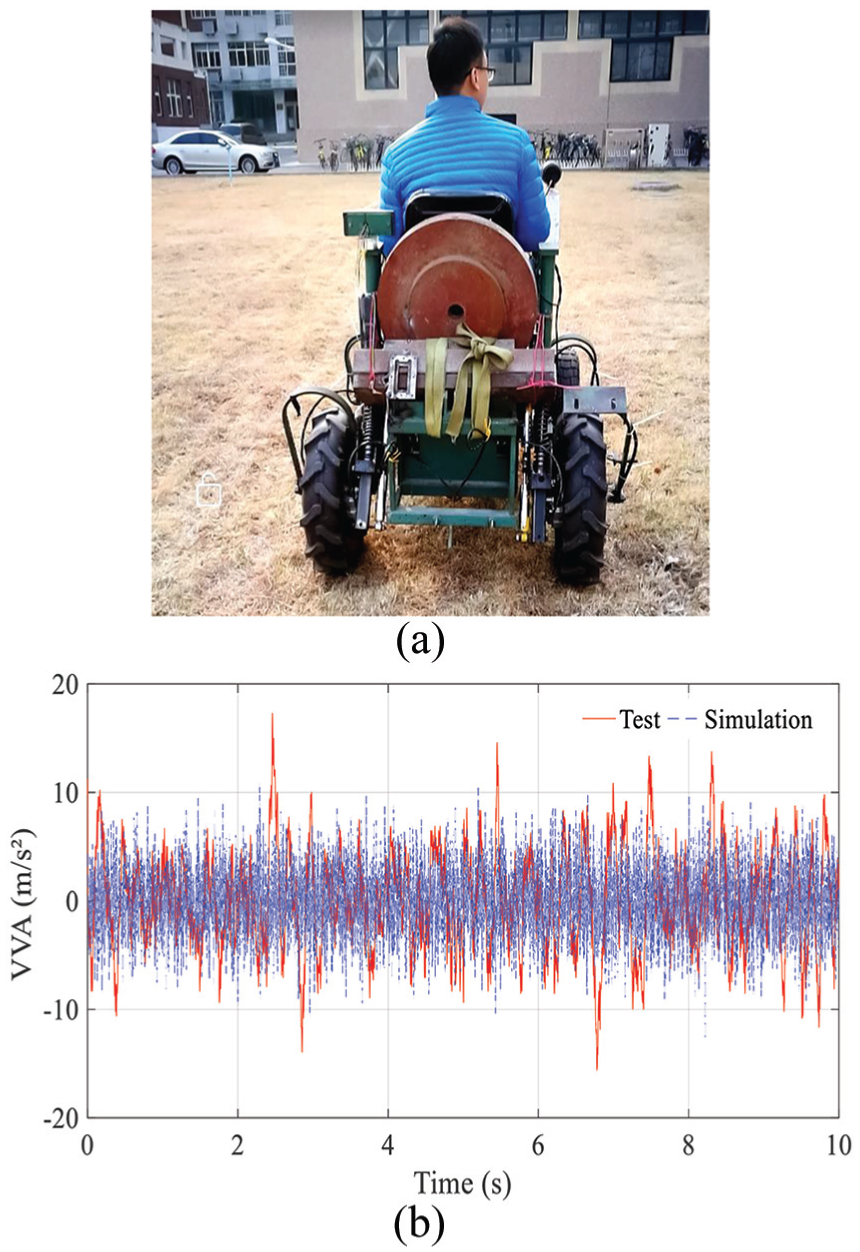
Results of driving test conducted on D-level road: (a) random driving test site and (b) VVA results for an operation speed of 30 km/h.
Conclusion
The amplitude-frequency and vibration response characteristics of the suspension of an EMORV were analyzed in this study. Based on the characteristics and requirements for the suspension, a comprehensive design objective function that focused on safety and comfort was established. MATLAB simulation using the objective function yielded suspension damping ratios of 0.23 and 0.25 for the front and rear suspensions, respectively. These damping ratios were subsequently used to analyze the damping characteristics of the shock absorber, and the results were used to establish a damping ratio adjustment law for the suspension. The theoretical piecewise linear velocity characteristics of the vibration shock absorber of the EMORV were also determined with respect to the lever ratio and installation angle. The test results showed that the stiffness and suspension damping ratio was within acceptable ranges, with the suspension exhibiting good cushioning and damping performances, and the vehicle affording good ride comfort. The EMORV design discussed in this article can be used as reference for suspension design and ride comfort investigations for low-speed electric vehicles, especially mini off-road vehicles. This study, however, has some limitations. First, the damping characteristics of the suspension dampers were considered to be piecewise linear, whereas they are generally nonlinear in actual dampers. Further study is thus required to consider the nonlinearity. In addition, while the suspension structure presented in this article allows for easy adjustment of the stiffness and damping of the suspension, the manual process requires significant time and effort. Further study should be undertaken to develop an automatic adjustment method, such as by hydraulic or electric systems, to improve the adjustment efficiency and precision.
Footnotes
Acknowledgements
The author(s) would like to thank all the students from College of Engineering, China Agricultural University, who took part in the experiment.
Handling Editor: Yunn-Lin Hwang
Declaration of conflicting interests
The author(s) declared no potential conflicts of interest with respect to the research, authorship, and/or publication of this article.
Funding
The author(s) disclosed receipt of the following financial support for the research, authorship, and/or publication of this article: This research was supported by National Natural Science Foundation of China (General Program, NO: 51775548).