
Abstract
The aerodynamic characteristics of open rotor hovering in confined environment are extensively studied, but few papers focus on shrouded rotor. In order to study aerodynamic performance and flowfield characteristics of micro-scale shrouded rotor hovering in confined environment, experimental measurements and computational fluid dynamic simulations are conducted in this article. Three cases of confined planes including ground, ceiling, and wall close to shrouded rotor are studied successively. Another case of no confined planes around shrouded rotor is also researched. Results show that both ground and ceiling improve the aerodynamic performance of shrouded rotor at distance below 1.5 rotor radii with the enhanced figure of merit, while wall plane influences flight stability because of the unbalanced moment. The experimental data reveal that the performance of shrouded rotor in-ground effect is more sensitive than that of shrouded rotor in-ceiling effect. However, for in-ground effect or in-ceiling effect, the performance of shrouded rotor is more sensitive than that of open rotor. Flowfield analysis by computational fluid dynamic shows the confined planes block airflow around shrouded rotor. Tip flow leakage and flow separation occur near shroud lip when shrouded rotor is hovering considerably close to ground or ceiling. Turbulent vortices and fluctuating velocities affect the flight stability of shrouded rotor.
Introduction
Over the past decades, micro air vehicles (MAVs)1–5 have boomed in the military and civil applications (e.g. reconnaissance, rescue, payload delivery, aerial photography and videography, and so on). Especially, rotary wing MAVs6,7 which are vertical take-off and landing (VTOL) aircrafts with hovering and low-speed flight capabilities are suitable to perform missions in confined environment. Compared with traditional rotorcrafts, shrouded rotor (SR) aircrafts have some advantages, for example, high maneuverability, low noise, and producing more thrust than open rotor (OR) at the same size and power consumption.8–10 In addition, relative to OR, SR considerably decreases the safety area 11 required for flight so that SR can hover in closer proximity than OR to confined conditions. Furthermore, as an aerial manipulator,12–14 SR aircrafts equipped with robotic arms can carry out operations in close proximity to objects. Therefore, SR gains significant advantages over OR flying in confined environment.
In addition, SR aircrafts are widely used in flying vehicles, such as Pop.Up15–17 and X-Hawk. 18 The vehicles travel among cities’ ground road and airspace. When vehicles take off from ground, the ground effect on the aerodynamic performance of SR cannot be ignored. When vehicles fly in confined environment, the ceiling effect19,20 and wall effect19,21,22 on the aerodynamic performance of SR should also be considered.
The confined environment is in various complex configurations in real life, while the three basic forms of ground plane, ceiling plane, and side wall plane gain lots of interest in research. Some other configurations such as channel plane, 19 corner wall, 21 and duct (or shroud) wall 19 can be simplified into the basic forms. In such confined environment, the aerodynamic performance will deviate from that in unconfined space. Therefore, it is necessary to study the influence of confined environment on the aerodynamic performance of SR aircraft.
When rotor is hovering out-of-ground effect (OGE), the wake flow is in contraction. However, when rotor is hovering in-ground effect (IGE), the downwash expands radially through the ground plane. And the aerodynamic performance is improved with less power consumption to produce the same thrust. Lee et al. 23 have conducted particle image velocimetry (PIV) experiments on a micro-scale OR hovering IGE to study the fluid dynamic of interacting blade-tip vortices with a horizontal ground plane. A wall jet which is composed of unsteady outward flow develops in the region between the ground plane and the vortical remnants of the rotor wake. Jardin et al. 19 have performed PIV experiments and proposed an empirical asymptotic model to study the aerodynamic performance of micro-scale OR hovering in confined spaces. Rossow 24 has experimentally investigated the thrust changes induced by ground and ceiling planes on a micro-scale OR in hover. Various computational investigations on OR hovering IGE have also been carried out. Akturk and Camci25,26 have performed three-dimensional (3D) Reynolds-averaged Navier–Stokes (RANS) simulations to study the effect of the tip leakage flow and the inlet flow distortion on the aerodynamic performance of SR. The simulation results are validated by PIV experiments. Lakshminarayan and colleageues27,28 and Kalra and colleagues27–30 have employed unsteady Reynolds-averaged Navier–Stokes (URANS) method to simulate tip-vortex-flowfield and ground-wake interactions for micro-scale OR. Gourdain et al. 31 have performed simulations with Lattice Boltzmann method (LBM) to analyze the turbulent flow produced in the wake of micro-scale OR and SR interacting with the ground. Free-vortex wake model has been applied by Griffiths et al. 32 to predict the performance of OR hovering IGE. Virtual blade model and potential flow model are used by Hosseini et al. 33 to study the performance of micro-scale SR hovering IGE. But the tip vortices and ground vortices cannot be captured by the two models accurately. In addition, brownout phenomenon IGE which has been the subject matter of recent studies attracts a lot of researchers, for example, Glucksman-Glaser and Jones,34,35 Sydney and Leishman. 36 The aerodynamic characteristics of micro-scale OR hovering IGE have been extensively studied. However, few papers report the aerodynamic characteristic of SR hovering IGE.
In addition, the aerodynamic characteristics of rotor hovering IGE are different from that in in-ceiling effect (ICE) flight. The immersed boundary method is adopted by Robinson et al. 20 to simulate the flowfield characteristics of hovering microrotor in close proximity to a ceiling plane. Jardin et al. 19 have also experimentally investigated the aerodynamic performance of OR hovering ICE. They think that ICE flight is more beneficial to MAVs endurance than IGE flight. However, the vertical wall boundary condition has a negligible impact on OR. Konuş and Savaş 21 have employed PIV and strain gauge thrust measurements to study the rotor vortex wake in close proximity of walls in hover. In their measurements, the average thrust coefficient decreases by 6% as the vertical wall is approached. Hosseini et al. 33 have also studied the performance of micro-scale SR hovering in ground/wall effect (GWE) by computational fluid dynamic (CFD) simulations. Robinson et al. 20 have also performed computations to investigate the aerodynamic characteristic of microrotor hovering in-wall effect (IWE). Two wake asymmetry phenomena, that is, asymmetry in wake shape and asymmetry in vortex circulation strength, have been observed IWE. Moreover, Konuş and Savaş 21 have also researched the aerodynamic characteristic of mircorotor hovering in very close proximity to corners. Jardin et al. 19 have also experimentally investigated the effect of channel-type confinement on the aerodynamics of microrotors. Based on the results of IWE, duct effect does not significantly influence the aerodynamic loads of OR, which is shown by Jardin et al. 19 The tip clearance δtip in the test is more than 1/10 of a rotor radius and it is not small enough to reach the extreme requirement of SR (δtip < 3.0% of a rotor radius 37 ). Varieties of research works have focused on OR hovering in the confined environment, such as IGE, ICE, and IWE. Nevertheless, the studies of SR hovering IGE, ICE, and IWE are rarely mentioned.
As mentioned previously, SR is more suitable than OR to fly in confined space, such as urban areas, indoor places where they may have to fly around obstacles or in close proximity to objects. Therefore, the impact of the restraint space on the performance of SR aircraft cannot be negligible. This article presents thrust and moment measurements to study the aerodynamic performance of SR hovering IGE and ICE. Also, CFD computations have been run to analyze the flowfield characteristics. The CFD results are in good agreement with the experimental data. Considering the complexity of experiments, the study of IWE is only described in computational results in this article.
The remaining part of the paper is organized as follows: thrust and moment measurements and error analyses are first presented in section “Experimental methodology”; computational method and grid independence study are proposed in section “Computational methodology”; section “Results” details the results of SR hovering IGE, ICE, and IWE; and finally, we draw concluding remarks in section “Conclusion.”
Experimental methodology
Experimental setup
The experiments are conducted at the Vehicle Research Center of BIT (Beijing Institute of Technology). There are a variety of SR vehicles10,11,38–41 developed successfully in the laboratory. In our past work, 10 the test model is mounted vertically and reversely on a test bench (0.3 m × 0.3 m × 1.2 m) so that the air flows from bottom to top. In this work, a horizontal installation method that the rotational axis is fixed horizontally is shown in Figure 1. The air runs from the shroud lip to the shroud diffuser.

Photograph of the experimental platform: (a) OR for OGE, (b) SR for OGE, (c) SR for IGE, and (d) SR for ICE.
The experimental platform illustrated in Figure 1 is designed to measure the force and moment of the system simultaneously. The test rig consists of the complicated mechanical system and the sensitive electrical system. It is equipped with the power supply system and the measurement system, which will be detailed in section “Experimental measurement.” An SR aircraft without rudders is used as the test model in the experiment. The distance between the shroud axis and the bench plane is about 2R, where R = 0.165 m is the rotor radius. The wall effect can be ignored in this configuration, which can be drawn from Jardin et al. 19 and Konuş and Savaş. 21 Two force load cells are mounted separately on the two brackets that support the shroud. The thrust of the shroud can be calculated by the sum of the measurements of the two force load cells. The rotor is installed on another bracket with brushless motor, rotary encoder, and force and moment measurement unit. The rotor can be moved along the shroud axis. In this way, the measurements of the rotor and the shroud are separated by the configuration shown in Figure 1. In addition, the tip clearance is ensured less than 3 mm.
Figure 1(a) and (b) illustrates OR and SR hovering OGE, with ICE and IWE also neglected. The impacts of special effects including IGE and ICE are able to be regulated by changing the location of the confined plate. As shown in Figure 1(c), IGE can be studied in the experiment by placing the confined plate at the shroud diffuser side. And ICE can also be modeled by placing the plate at the shroud lip side as illustrated in Figure 1(d). In order to compare the aerodynamic performance between SR and OR, the shroud can be removed from the test rig and the two effects can also be studied in the experiment
SR model
The shroud is made of photosensitive resin using the 3D print technology, and the shroud scheme is shown in Figure 2(a). The shroud profile is designed based on the airfoil Clark Y whose chord length is 1.0R. Our past research work 10 shows that the shroud thrust is mainly produced by the negative pressure region (where the absolute pressure is less than atmospheric pressure) close to the shroud lip. In addition, satisfied aerodynamic performance is ensured by small tip clearance (δtip < 3.0%R). 37 Therefore, the shroud lip surface should be large and the rotor is placed at the shroud throat (0.25L) as illustrated in Figure 2(a). The nozzle is also an important component of the shroud. Since a divergent nozzle exit helps to expand the flow after the rotor and affects the mass flow rate through rotor-disk plane, the divergent shroud37,42,43 has better performance than the shroud without a diffuser. Meanwhile, the shroud diffuser angle should not be very large to avoid flow separation. The diffuser angle has been studied in some papers37,43 and 10° is suitable for the diffuser, which is also applied in this article. The inner diameter of the shroud throat is Dinner = 2.036R. Therefore, the diffuser expansion ratio8,9,37 is 1.14, which equals the area of the shroud exit divided by the area of the rotor: σd = Ae/A.

Rotor and shroud description: (a) shroud scheme and (b) blade chord and twist distribution.
Compared with the conventional helicopters, MAVs with smaller size and lighter weight are suited for flight in low Reynolds environment. It is less efficient for the uniform chord blades in this environment where the viscous effect is more obvious. 44 Therefore, the twisted blades with non-uniform chord are necessarily applied in the experiment. The past study 10 shows that large screw pitch is suitable for SR. A 5-blade carbon fiber rotor with 330 × 152 (diameter × screw pitch, in mm) is employed in the test. The chord and twist distributions of the rotors are obtained by the 3D scanner as plotted in Figure 2(b).
Experimental measurement
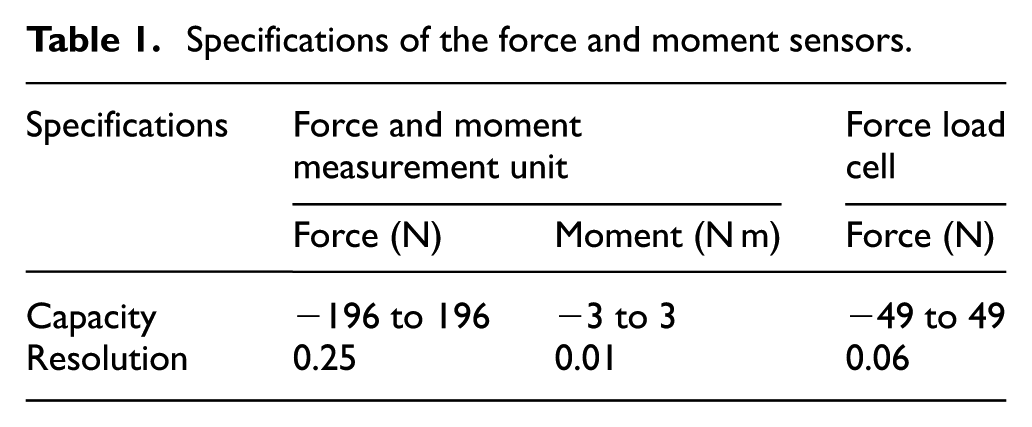
Figure 3 illustrates the schematic of the experimental measurement system which includes the force and moment measurement system, the rotary speed measurement system, and the electric parameter measurement system. The force and moment measurement system is employed to measure the thrust and the torque of the rotor (Tr, Qr), and the thrust of the shroud (Ts = Ts1 + Ts2). The force and moment sensors are designed by Forsentek company and their specifications are listed in Table 1. The rotary encoder is HKT22 model with a resolution of 100 counts per revolution. It is used to record rotary speed (Ω). Amperemeter and voltmeter are used to measure the input current and voltage (I, U), respectively.

Schematic of the experimental measurement.
Specifications of the force and moment sensors.
In order to stabilize the voltage in the test, a regulated direct current (DC) power supply is employed to provide the brushless motor with current. Moreover, the control and data acquisition (DAQ) system is designed to ensure that the experiment operates accurately. It is composed of the electronic speed controller (ESC), receiver, DAQ, PC (personal computer), and processing software.
Since the sensors send weak voltage signals, an amplifier is used to amplify the weak voltage signal (mV) into a measurable voltage signal (V). All the signals including the rotary speed, the current, and the voltage are sent to PC via the DAQ system. The DAQ system is integrated into Arduino Mega 2560 board which owns enough digital I/O pins, analog inputs, universal asynchronous receiver/transmitter (UARTs), and so on. The board can receive and send simple textual data via the Arduino software including a serial monitor. Besides the DAQ function, the DAQ system transmits remote control and receiver commands to ESC for controlling the motor speed.
Error analyses
Besides the actual force and moment measurement signals, the raw data also contain the electrical noise from the brushless motor (high frequency), the mechanical noise from the rotor system (rotor rotational frequency), and the resonances of the experimental platform (low frequency). The electrical noise and the mechanical noise can be easily removed by smoothing filter as shown in Figure 4, which is a sample of SR hovering OGE. The filtering is performed during the experiment to record the accurate data in real time. The noise in low frequency is avoided by skipping these working conditions where the resonance is obvious.

Sample thrust and torque measurements with raw data and filtered signals: (a) thrust coefficient and (b) torque coefficient.
In addition, the data are recorded five times in experiment and the mean values are used as the final results. The relative error (RE) of all the experimental results defined as equation (1) is less than 5%

Computational methodology
3D CFD simulations are carried out in this article to investigate the aerodynamic performance of SR aircraft in confined environment. The turbulent flowfield, especially, the flowfield near the ground, the ceiling, and the wall, is analyzed in detail.
The computations are carried out using the commercial software ANSYS FLUENT 18.0. The incompressible RANS equations are solved with finite volume method. The differential form of the equations can be written as

where the subscripts i and j indicate the ith and jth components of the Cartesian coordinate respectively;
The shear stress transport (SST) k–ω model45,46 is applied in simulations. The turbulence model takes into account the transport of the turbulence shear stress and makes accurate and reliable predictions of the flow separation under the adverse pressure gradient flows. A pressure–velocity coupling approach and second-order upwind scheme are used. The multiple reference frame (MRF) model 46 is a steady-state approximation to solve RANS equations and is adopted to analyze the performance of SR and OR in this study.
Computational domains and boundary conditions
With regard to boundary conditions, SR hovering IGE, ICE, and IWE is illustrated in Figure 5(a)–(c), respectively. A cuboid computational domain with 20R × 20R × 20R is shown, where hg and hc are the distance from the rotor-disk plane to ground plane and ceiling plane, respectively; d is the distance from rotor rotational axis to wall plane; x, y, and z are the coordinate directions of the computational domain. The shroud, the rotor, and the confined boundary condition are all solid walls with the no-slip boundary condition. For the outer boundary conditions, Ali Akturk and Camci 26 apply pressure inlet and pressure outlet for the simulations of SR in their papers. And the boundary condition pressure inlet and pressure outlet are applied in this article due to the hover condition. Atmospheric total pressure p∞= 101,325 Pa and total temperature T = 288 K are prescribed on the boundary condition pressure inlet and pressure outlet. The rotor was tested at rotational speed of 3000–6000 r/min, corresponding to the tip Reynolds number of 26,550 to 53,100, and the tip Mach number of 0.153–0.304.

The boundary conditions and the computational mesh used in the computations: (a) boundary conditions for GE, (b) boundary conditions for CE, (c) boundary conditions for WE, (d) computational domains with frame interfaces and (e) computational mesh around SR.
For SR, there are two separate computational domains connected by the interfaces as illustrated in Figure 5(a)–(d). It is the same with OR. The rotational block contains the domain near the rotor and the stationary domain is devoted to the rest block including the shroud. Since rotor and shroud are separated, the aerodynamic forces and torque of rotor and shroud can be calculated separately. The rotational cell zone is a revolving domain with 1.018R × 0.5R (radius × height). The rotor is rotating synchronously relative to the adjacent cell zone. The absolute velocity of the shroud is specified at 0 which means that additional sources of momentum are assigned at the shroud surface. Therefore, the shroud is stationary in the absolute frame, and rotating at the speed of the adjacent cell zone—but in the opposite direction—in the relative reference frame. The same method is applied to the confined boundary condition, such as the ground, the ceiling, and the wall surface.
The unstructured mesh is generated in this study. The computational mesh near SR is shown in Figure 5(d) and (e) and the nondimensional wall distance (y+) of around 1 is maintained close to the shroud and rotor region. In order to capture the turbulent vortices and predict the velocity gradient accurately near the confined boundary condition, prism layer is generated and refined smoothly near the ground, the ceiling, and the vertical wall surface, respectively.
Grid independence study
The grid sensitivity study proves that the numerical solutions do not depend on the mesh, and that the accurate and reliable results are ensured. The grid convergence index (GCI) proposed by Roache 47 provides a consistent manner in reporting the results of grid convergence studies and perhaps provides an error band on the grid convergence of the solution. The simulation of SR hovering OGE is chosen as test case. Three different size meshes are generated: a fine mesh with 7,500,000 tetrahedral cells, a medium mesh with 3,300,000 cells, and a coarse mesh with 1,400,000 cells. Based on GCI, the relationship between the computed aerodynamic coefficients and the normalized grid spacing can be seen in Figure 6. Richardson extrapolation 47 is applied using the two finest grids to obtain an estimate of the value of the coefficient. The rotor thrust coefficient is estimated to be 0.01229 with an error band of 0.49% and the shroud thrust coefficient is estimated to be 0.00823 with an error band of 0.80%. The rotor torque coefficient is estimated to be 0.00295 with an error band of 1.78%. The results indicate that the solutions are well within the asymptotic range of convergence. To balance the simulation accuracy and computation time, the medium grid is used in the paper and the other grids used in the study are generated according to the medium one. The number of grids in the rotational zone and the stationary zone is 1,880,000 and 1,430,000, respectively.

The computed coefficients versus normalized grid spacing based on GCI: (a) thrust coefficient and (b) torque coefficient.
Results
The aerodynamic performance of rotor is usually quantified and analyzed using nondimensional coefficients. The sectional surface pressure coefficient, the thrust coefficient, the torque coefficient, and the power coefficient for the rotor in hover are defined as


where
In order to evaluate the performance of rotorcrafts, the concept of the figure of merit (FM) is described. The FM for OR is defined as the ratio of the ideal power required to hover to the actual power required, 8 that is
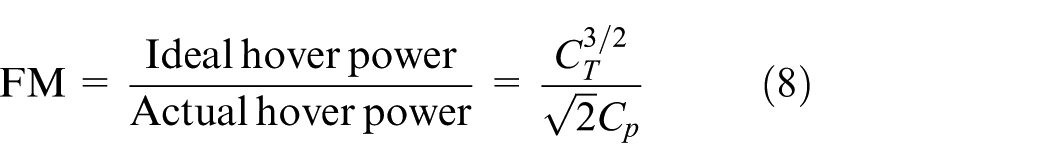
JL Pereira 37 defines the FM for SR which is

where CTt is the sum of rotor thrust coefficient CTr and shroud thrust coefficient CTs, the power coefficient CP is replaced by the rotor torque coefficient CQr, and diffuser expansion ratio σd = 1.14 in this study. In the rest of the paper, the FM for SR is derived from equation (9).
This section aims to detail the three special effects such as IGE, ICE, and IWE of the micro-scale SR and then to analyze the flowfield characteristics to account for the phenomena. Therefore, the experimental data are given as the thrust ratio at constant power and the power ratio at constant thrust. Also, the comparisons between the test data and the computed results are drawn at the constant RPM.
Ground effects
Aerodynamic performance
Figure 7(a) shows the normalized thrust ratio, thrust of IGE to OGE, versus the normalized rotor-to-ground distance at constant power, for both OR and SR. It can be seen that the thrust ratio is around 1.0 for the distance hg/R above 1.5 but rapidly increases for the distance below 1.5. The maximum thrust ratio 1.33 is obtained at the minimum value of rotor-to-ground distance hg/R = 0.2 for OR, while the maximum thrust ratio 1.23 is achieved at the minimum value of rotor-to-ground distance hg/R = 0.9 (rotor-to-shroud-exit distance 0.75R) for SR. In order to provide a reasonable estimate of the ratio, an empirical asymptotic model

Ground effects: (a) a thrust increase at constant power and (b) a power decrease at constant thrust.
The measurements of individual power ratio versus distance from the ground at a constant thrust for OR and SR are also given in Figure 7(b). A nearly 35% reduction in power is achieved at hg/R = 0.2 for OR while for SR an almost 26% power reduction is obtained at hg/R = 0.9. It can be found obviously that the power of SR decreases faster than that of OR in close proximity to the ground plane. In addition, b = 0.42 and b = 5.70 satisfy the fitting curves of OR and SR, respectively.
In Figure 7(a), the OGE thrust relationship between OR and SR is TOGE, SR = 1.18TOGE, OR at constant mechanical power, while in Figure 7(b) the OGE mechanical power relationship between OR and SR is POGE, OR = 1.28POGE, SR at constant total thrust. Therefore, SR offers a significant advantage over OR.
Figure 8 plots the thrust, torque, and FM of SR versus the rotor-to-ground distance for the constant rotational speed. The computed rotor thrust underpredicts about 10% than the measurement, while the overprediction of the computed shroud thrust is about 15%. The computed total thrust underestimates about 5% and the computed torque overestimates less than 10%. Considering that the estimated uncertainties in the measurements are about 5%, the agreement of the computation with the measurement can be considered good. Compared with the OGE results, the total thrust increases by 33.5% and the torque increases by 21.8% at hg/R = 0.9. When the rotor height off the ground is greater than 1.5R, the computed FM is about 0.45 and the measured FM is about 0.52. As the rotor-to-ground distance declines, FM increases smoothly. At hg/R = 0.9, the computed FM is about 0.61 and the measured FM is about 0.67. The presence of the ground plane which acts like the “air cushion 8 ” improves the aerodynamic efficiency of SR.

Ground effects at constant RPM: (a) thrust versus distance from the ground, (b) torque versus distance from the ground, and (c) FM versus torque versus distance from the ground.
As illustrated in Figure 8(a), as the rotor-to-ground distance decreases, the rotor thrust increases rapidly, while the shroud thrust decreases slightly. These two phenomena are due to the increasing back pressure below the rotor-disk plane. As the back pressure increases, the pressure difference between the top and bottom surface of the rotor also increases, and then rotor thrust increases. As to shroud, the increasing back pressure reduces the velocity near the shroud lip, the negative pressure on shroud lip increases, and then shroud thrust decreases. However, both the total thrust and the torque increase with the descent rotor-to-ground distance.
Flow field analysis
For OGE, the rotor tip vortices and the downwash wake can fully form, while for IGE the vortices are compressed near the ground and the downwash flow is turned radially. In order to further study the ground effect, the computed flowfield is analyzed in this section. Four cases with different rotor-to-ground distances at the constant rotational speed Ω = 5000 r/min are chosen to show. Time-averaged velocity fields are illustrated in Figure 9 in the form of the streamlines on a color-contoured background. All the velocities are normalized by the rotor tip velocity Vtip = ΩR.
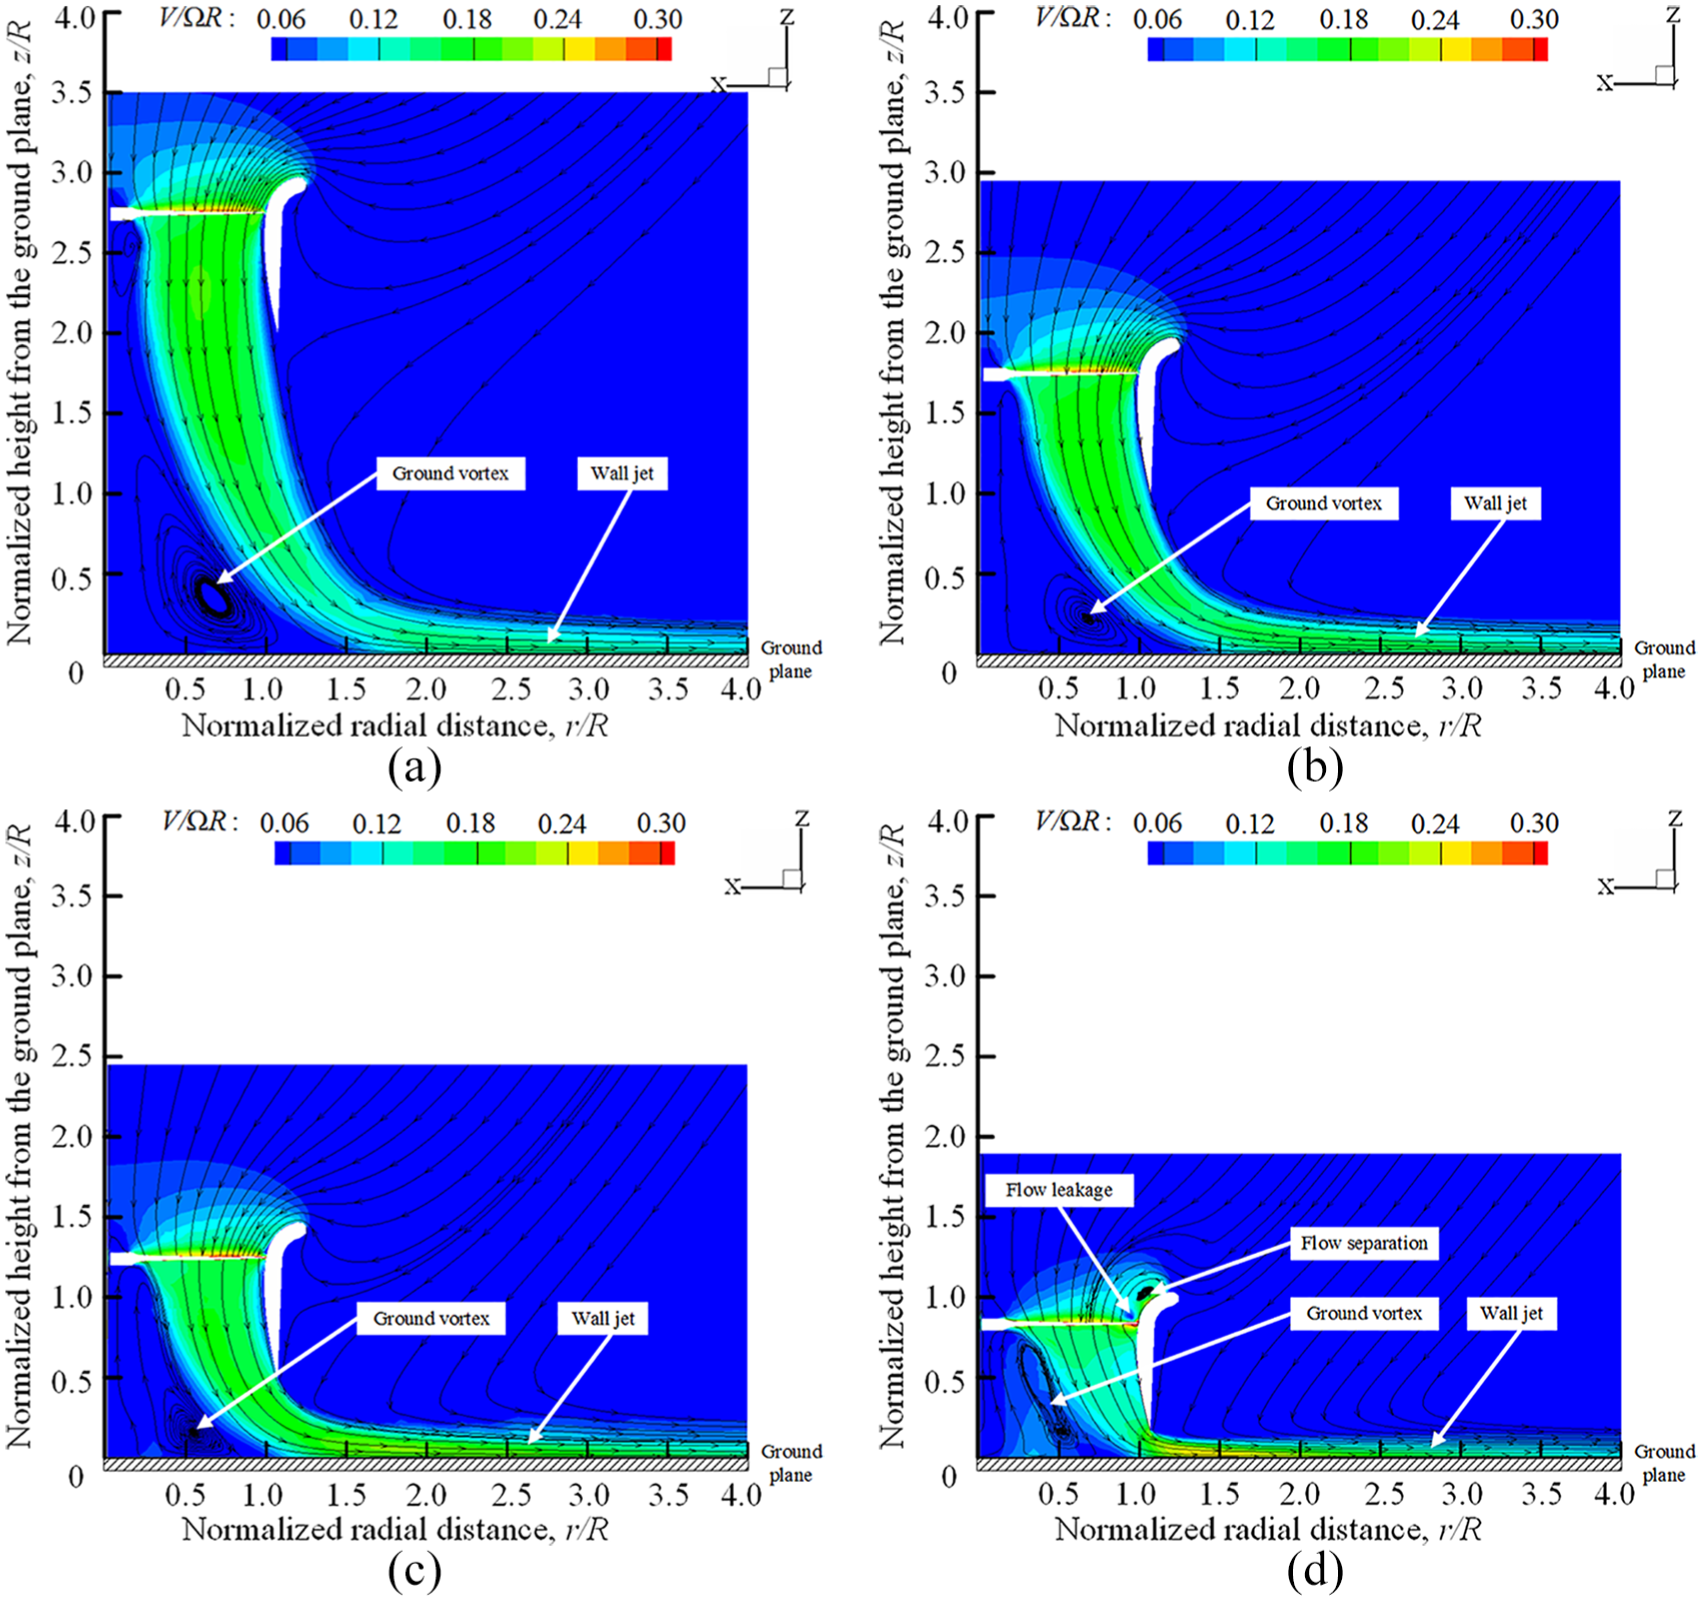
The time-averaged velocity fields near the ground plane for different rotor heights off the ground plane: (a) hg/R = 2.7, (b) hg/R = 1.7, (c) hg/R = 1.2, and (d) hg/R = 0.9.
In the four cases, it can be seen obviously that the downwash wake flow is turned and stretched radially outward as a wall jet through the ground plane. As illustrated in Figure 9(a), the wall jet starts to form at r = 1.5R and fully develops at r = 2.0R, thereafter beginning to decrease. In this case, the thickness of the wall jet is about 0.2R and its maximum velocity is about 0.18Vtip. In the following cases, the formation, development, and disappearance of wall jet occur successively at shorter radial station. Meanwhile, the thickness and the maximum velocity of the wall jet also increase to a certain extent. Lee et al. 23 consider that two competing fluid dynamic mechanisms, that is, the average rotor induced downwash combined with the local periodic effects of the blade-tip vortices and the vortex sheets contribute to the wall jet for OR in IGE flight. However, the wall jet of SR is much thinner with a greater velocity as depicted in Figure 9(d). In addition, the flow separation occurs near the shroud lip and the leaking flow runs from the rotor bottom to the top surface in the fourth case. The flow separation and the flow leakage are mainly caused by the back pressure below the rotor-disk plane, because of the too short ground distance for SR as illustrated in Figure 9(d). These account for how the thrusts of the shroud and the rotor change as plotted in Figure 8(a). In all cases, there is a region of flow recirculation (often called ground vortex) just below the rotor near the ground plane. The presence of the vortical flow requires more power consumption and also influences the flight stability of SR aircraft.
In order to further study the flow mechanism of the wall jet, the time-averaged radial velocity profiles are extracted from computational results as a function of the rotor heights. The profiles at six radial stations r/R = 0.8, 1.0, 1.25, 1.5, 1.75, 2.0 are plotted in Figure 10. Fine grids are generated at the boundary layer near the ground plane to capture the turbulent vortices and predict the fluctuating velocities accurately. It is obvious that at the six radial stations, the radial velocity increases initially downward the rotor, reaches a peak, and then decreases quickly close to the ground plane. As illustrated in Figure 10(a), the radial flow below SR forms already as similar as OR. 21 The wall jet has developed well at r/R = 1.0 as illustrated in Figure 10(b). Moving radially outward (see Figure 10(c)–(f)), the wall jet becomes thinner and reaches its peak velocity at about r/R = 1.5. Thereafter, the peak velocity decreases slightly. The radial velocities (see Figure 10(c)–(f)) are nearly zero near the outside surface of the shroud due to the confinement of the shroud.

The time-averaged radial velocity profiles at various radial distances from the rotor axis for GE: (a) r/R = 0.8, (b) r/R = 1.0, (c) r/R = 1.25, (d) r/R = 1.5, (e) r/R = 1.75, and (f) r/R = 2.0.
Figure 11 illustrates the time-averaged pressure fields near the ground plane for SR hovering four different heights. It is obvious that as the rotor-to-ground distance decreases, the static pressure below the rotor-disk plane increases, while the pressure on the top surface of rotor changes little. Therefore, the rotor thrust increases with proximity to the ground plane. Especially, in the fourth case (see Figure 11(d)), high back pressure on the rotor tip forces the air flow backward. And flow separation caused by the adverse pressure gradients occurs on the shroud lip.

The time-averaged pressure field near the ground plane for different rotor heights off the ground plane: (a) hg/R = 2.7, (b) hg/R = 1.7, (c) hg/R = 1.2, and (d) hg/R = 0.9.
Generally, there are some features observed in the flowfield of SR for IGE: (1) wall jet as well as ground vortex occurs near the ground plane; (2) rotor thrust increases due to the increasing back pressure below the rotor-disk plane; (3) shroud thrust decreases due to the flow separation near the shroud lip when SR is in close proximity to the ground plane. Therefore, the aerodynamic efficiency of SR is improved in IGE flight due to the obviously increasing rotor thrust. And the empirical asymptotic model may provide a reasonable estimate. However, the turbulent vortices and the fluctuating velocities affect the flight stability seriously.
Ceiling effects
Aerodynamic performance
As is previously detailed, the thrust ratio versus the rotor-to-ceiling distance at constant power and the power ratio versus the rotor-to-ceiling distance at constant thrust are plotted in Figure 12. It can be seen that the thrust ratio is around 1.0 for the distance hc/R above 1.5 but rapidly increases for the distance below 1.5. As shown in Figure 12(a), the maximum thrust 1.55TOGE is obtained at the minimum value of rotor-to-ceiling distance hc/R = 0.2 for OR, while the maximum thrust 1.52TOGE is achieved at the minimum value of rotor-to-ceiling distance hc/R = 0.55 (rotor-to-shroud-lip distance 0.25R) for SR. As shown in Figure 12(b), for OR a nearly 48% reduction in power is achieved at hc/R = 0.2, while for SR an almost 46% power reduction is obtained at hc/R = 0.55.

Ceiling effects: (a) a thrust increase at constant power and (b) a power decrease at constant thrust.
The empirical asymptotic model
Values of the parameter b for OR and SR.

OR: open rotor; SR: shrouded rotor; IGE: in-ground effect; ICE: in-ceiling effect.
In addition, the empirical asymptotic model provides a necessary guideline for flight control of MAVs hovering IGE and ICE. The MAVs could obtain the excellent flight efficiency with less power consumption and more thrust when approaching to the ground plane or the ceiling plane. Since the ceiling suction and the thrust of SR act in the same direction, ICE is intrinsically unstable. Furthermore, the shroud itself helps protect the high-speed rotating rotor.
Figure 13 shows the SR thrust, torque, and FM versus the rotor-to-ceiling distance at the constant rotational speed. The computed rotor thrust underpredicts about 15% than the measurement, while the overprediction of the computed shroud thrust is about 10%. The computed total thrust underestimates less than 5% and the computed torque overestimates less than 10%. Considering that the estimated uncertainties in the measurements are about 5%, the agreement of the computation with the measurement can be considered good. Compared with the OGE results, the total thrust increases by 38.2%, while the torque decreases by 14.4% at hc/R = 0.55. When the rotor clearance from the ground is greater than 2.0R, the computed FM is about 0.45 and the measured FM is about 0.52. As the rotor-to-ceiling distance declines, FM increases dramatically. At hc/R = 0.55, the computed FM is about 0.85 and the measured FM is about 0.89. The rotor is mounted at the throat position of the shroud, so for ICE flight the rotor can approach to ceiling plane much closer than ground plane in IGE flight. Therefore, the maximum FM of SR in the ceiling effect is much larger than that in the ground effect.

Ceiling effects at constant RPM: (a) thrust versus distance from the ceiling, (b) torque versus distance from the ceiling, and (c) FM versus distance from the ceiling.
As plotted in Figure 13, as the rotor-to-ceiling distance decreases, the thrusts of both rotor and shroud increase, while the rotor torque decreases rapidly. These may be caused by the changes of the pressure difference between the rotor top and bottom surface and the mass flow rate through the rotor-disk plane.
From Newton’s second law of motion, the thrust is defined as the change in momentum with the change in time (see equation (10)). If the exit pressure is not equal to the inlet pressure, the pressure difference also contributes to the thrust (see equation (11)). The general thrust is then given in equation (12). It should be noted that equations (10)–(12) are true only for a one-dimensional steady flow, and all terms related to the pressure forces are neglected in equation (10). Moreover, the recirculation around the shroud (close to a ground or a wall) will produce a shear stress that is not considered in equation (11)


where
The former term T1 is about mass flow rate and the latter term T2 is about the pressure difference. For SR, the rotor thrust is produced mainly by the latter term. As the rotor-to-ceiling distance decreases, the pressure difference increases, while the mass flow rate decreases, see Figure 14. Therefore, the rotor thrust increases when SR moves to ceiling plane.

The computed pressure difference and mass flow rate versus the rotor-to-ceiling distance at constant RPM.
The mechanical power is equal to the rotational speed times the torque

Also, the mechanical power is the sum of the induced power and the profile power

where
For rotor in hover, the induced velocity in rotor-disk plane can be obtained by the mass flow rate as follows

where ρ is the air density which can be obtained by the ideal gas law.
As SR aircraft approaches to ceiling plane, the mass flow rate through rotor-disk plane decreases due to the airflow blockage by the ceiling plane. The static pressures of both rotor top and bottom surface also decrease. The static pressure of rotor top surface decreases more rapidly than that of rotor bottom surface, so the static pressure difference between rotor top and bottom surface increases. As shown in Figure 14, the pressure difference between the rotor top and bottom surfaces increases by 33.6% and the mass flow rate through the rotor-disk plane decreases by 37.1%. Therefore, both the power consumption and the rotor torque of SR decrease for ICE at constant rotational speed.
Flow field analysis
The time-averaged radial velocity fields are shown in Figure 15 in the form of the streamlines on a color-contoured background, for four rotor clearances from the ceiling. The time-averaged computations are run at the constant rotational speed Ω = 5000 r/min for various rotor-to-ceiling distances. All the velocities are normalized by the rotor tip velocity Vtip = ΩR. In the four cases, it can be seen obviously that the streamlines close to the ceiling plane are nearly parallel to the ceiling plane and then the inflow is turned axially, running to rotor-disk plane. Grids are fine enough near the ceiling plane to resolve the boundary layer. The radial velocity near the shroud lip increases as the rotor-to-ceiling distance decreases, see Figure 15(a)–(d). At the distance hc/R = 0.55 (see Figure 15(d)), an obvious flow separation occurs near the shroud lip and leaking flow runs from the rotor bottom to the top surface through the tip clearance. This is caused by the tip back pressure which can be confirmed in Figure 16.

The time-averaged radial velocity field near the ceiling plane for different rotor clearances from the ceiling: (a) hc/R = 2.25, (b) hc/R = 1.25, (c) hc/R = 0.75, and (d) hc/R = 0.55.

The time-averaged pressure field near the ceiling plane for different rotor clearances from the ceiling: (a) hc/R = 2.25, (b) hc/R = 1.25, (c) hc/R = 0.75, and (d) hc/R = 0.55.
As the rotor-to-ceiling distance decreases, the static pressure on the shroud lip and the rotor top surface decreases, see Figure 16(a)–(d). Meanwhile, the static pressure on the bottom surface of rotor tip increases rapidly, see Figure 16(c)–(d). Therefore, both the rotor thrust and the shroud thrust increase when SR approaches to the ceiling plane. In the fourth case, the static pressure on the bottom surface of rotor tip is pretty high, while the pressure on the top surface is low. The shroud thrust is about to drop because of the obvious flow separation.
Overall, there are several features observed in the flowfield of SR for ICE: (1) the rotor thrust increases because of the increasing pressure difference between the top and bottom rotor surface; (2) the static pressure on the shroud lip decreases and the shroud thrust increases; (3) the mass flow rate through the rotor-disk plane decreases and the power consumption as well as the rotor torque decreases; (4) an obvious flow separation caused by the tip back pressure occurs on the shroud lip when SR is in close proximity to the ceiling plane. The aerodynamic efficiency of SR is also improved in ICE flight due to the increase of thrust and the descrease of power. However, the shroud thrust is about to drop because of the obvious flow separation. Therefore, SR should keep a certain safety distance from ceiling plane.
Wall effects
Aerodynamic performance
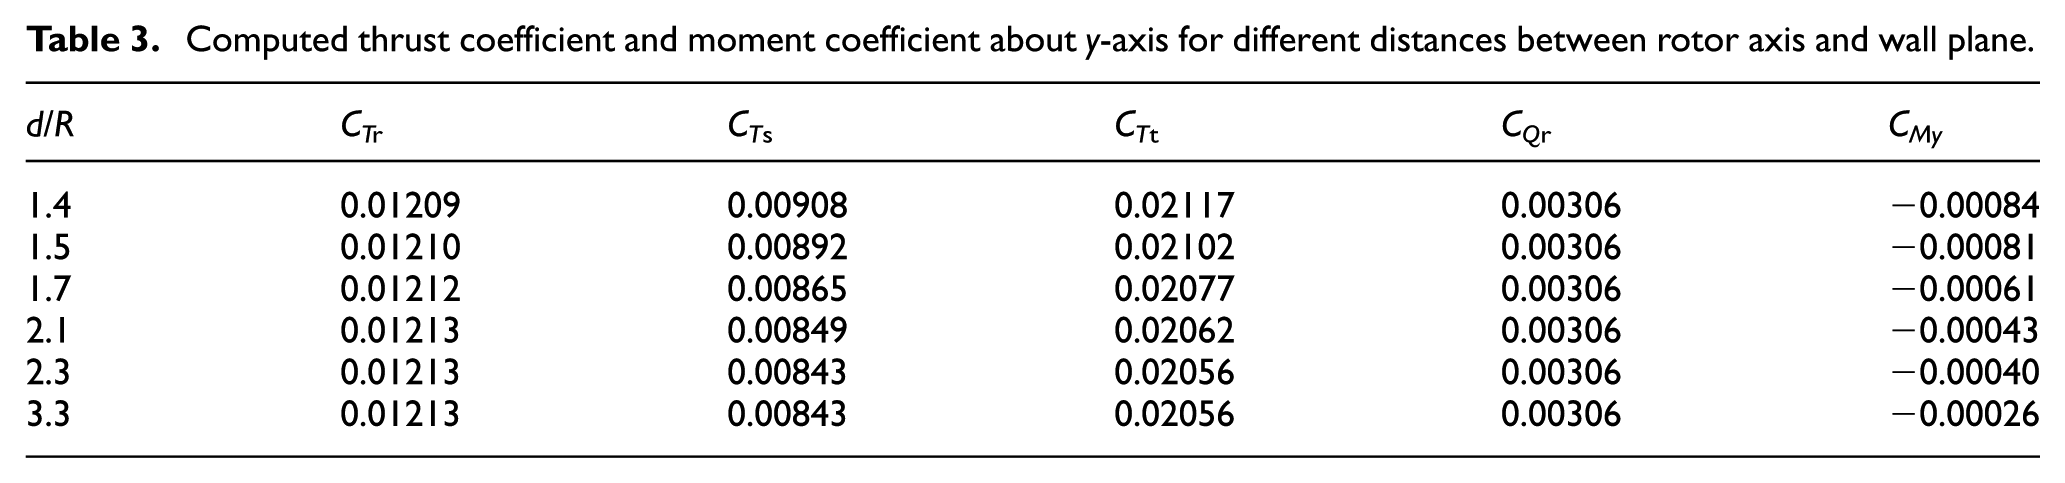
Considering the mechanical complexity of the experimental platform and the various noises, only the computational results are shown in this section. Table 3 lists the computed aerodynamic coefficients of SR for IWE, where CMy is the pitch moment of SR in proximity to wall plane and the negative sign indicates that shroud lip is tilting to the wall. Relative to the coefficients of SR at d/R = 3.3 (shroud-lip-to-wall distance 2.0R), the rotor thrust coefficient CTr at d/R = 1.4 (shroud-lip-to-wall distance 0.1R) decreases by 0.33%, the shroud thrust coefficient CTs increases by 7.71%, and the total thrust coefficient CTt increases by 2.97%. Konuş and Savaş 21 have found in test the average rotor thrust coefficient of OR decreases by 6% as the vertical wall is approached. Their ratio is larger than that in this study, because the rotor-to-wall distance is not small enough in this test due to the size of shroud. As SR approaches to wall plane, the rotor torque coefficient CQr changes little. However, the pitch moment of SR CMy at d/R = 1.4 increases by about 2.2 times compared with that at d/R = 3.3. At d/R = 1.4, the pitch moment is about 1/3 times as the rotor torque. Therefore, the pitch moment cannot be ignored. The pitch moment forces the shroud lip to tilt toward wall plane and seriously affects the flight stability of SR. This is a unique characteristic of SR, and the open literatures about OR have no such result.
Computed thrust coefficient and moment coefficient about y-axis for different distances between rotor axis and wall plane.
Flow field analysis
Figure 17 illustrates the time-averaged radial velocity fields near the wall plane. Computations are run at the constant rotational speed Ω = 5000 r/min for various rotor-to-wall distances. All the velocities are normalized by the rotor tip velocity Vtip = ΩR. The rotational axis of the rotor is parallel to the wall. Grids are also dense enough in the boundary layer near the wall plane. It can be found that as the rotor-to-wall distance decreases, the radial velocity field near the shroud lip whose portion is far away from the wall plane (see region A) has no much change. However, the radial flow velocity near the shroud lip whose portion is close to the wall plane (see region B) decreases rapidly when SR moves to the wall. The wall plane prevents more air from flowing to the rotor-disk plane in radial direction. Based on Bernoulli’s principle, the static pressure on shroud lip which is close to wall plane (see region C) is larger than that on the lip portion far away from the wall plane, which can be confirmed in Figure 18. As illustrated in Figure 18(a), the static pressure distributes evenly on the shroud lip for OGE. Therefore, the magnitude of the force on region A

The time-averaged radial velocity field near the wall plane for different distances away from the rotor axis: (a) OGE, (b) d/R = 1.7, (c) d/R = 1.5, and (d) d/R = 1.4.

The time-averaged pressure coefficient on SR for different distances away from the rotor axis: (a) OGE, (b) d/R = 1.7, (c) d/R = 1.5, and (d) d/R = 1.4.
The blade-tip vortices are sheared by the shroud and the aerodynamic interference effects of the wall plane on SR are not obvious. Moreover, the shroud itself can protect the rotor from damage in high rotational speed. This makes SR suitable to fly in a confined environment.
A corner can be simplified into two orthogonal wall planes and the asymmetry phenomena of the time-averaged flowfield are predicted to exist in the special effect. Therefore, the main features observed in the flowfield of SR for IWE can also be found in corner effect. Furthermore, the symmetry phenomena of the flowfield can be observed in duct (or shroud) effect. And the flowfield can be analyzed in the same way as IWE.
Conclusion
Due to the special characteristics, SR MAVs are more suitable than OR to fly in confined space where they may have to fly around obstacles or in close proximity to objects. In order to research the aerodynamic performance of SR hovering in confined environment and analyze the flowfield characteristics, experimental measurements and RANS simulations have been carried out in this article. High-resolution sensors are employed to measure the force and moment of SR and the signal noise is filtered during the test to record the data in real time. SST k–ω turbulence model and MRF technique are applied in the simulations and GCI is used to validate the grid sensitivity. The performance and flowfield analysis of SR for IGE, ICE, and IWE are explored successively. The computed results are in good agreement with the experimental data. The results are shown as follows:
Both ground plane and ceiling plane improve the aerodynamic performance of SR at rotor-to-plane distance below 1.5R with the enhanced FM. This is quite different from OR. When SR is in very close proximity to the planes, tip flow leakage and flow separation occur near shroud lip, which degrades the performance of SR. In addition, turbulent vortices and fluctuating velocities affect flight stability of SR. Furthermore, wall plane also influences the stability of SR because of the unbalanced moment.
The empirical asymptotic model is based on the experimental data. The model reveals that for IGE or ICE, the aerodynamic performance of SR is more sensitive than that of OR. For SR, IGE flight shows more sensitive than ICE flight.
Compared with the OGE case, for IGE flight at constant RPM, the measured FM increases to about 0.67 at hg/R = 0.9, while for ICE flight at constant RPM, the measured FM increases to about 0.89 at hc/R = 0.55. When SR is hovering IGE, shroud thrust decreases slightly due to flow separation near shroud lip; when SR is hovering ICE, rotor torque decreases due to the decreasing mass flow rate through rotor-disk plane.
For IWE flight at d/R = 1.4, the unbalanced moment is 1/3 times as the rotor torque. The moment forces shroud lip to tilt toward wall plane and seriously affects the flight stability of SR. This is a unique characteristic of SR.
For IGE flight, the downwash is turned radially outward through the ground plane and wall jet as well as ground vortex develops. For ICE flight, the inflow runs parallel to the ceiling plane and is turned axially to the rotor-disk plane. When SR is in very close proximity to the planes, there is a region of back pressure below rotor-disk plane. For IWE flight, wall plane prevents more air from flowing to the rotor-disk plane in radial direction.
The findings of this study are focused on SR MAVs hovering in confined environment. The aerodynamic performance of SR for IGE, ICE, and IWE is given in this work and provides guidelines for flight efficiency and flight control in confined space. Moreover, the flight envelopes of SR MAVs are expanded in very close proximity to the ground plane, the ceiling plane, and the wall plane.
Footnotes
Handling Editor: Xiaoxiao Han
Declaration of conflicting interests
The author(s) declared no potential conflicts of interest with respect to the research, authorship, and/or publication of this article.
Funding
The author(s) disclosed receipt of the following financial support for the research, authorship, and/or publication of this article: This research was supported by the Natural Science Foundation of China (NSFC) under grant no. 51505031.