
Abstract
Look-ahead information has been applied to vehicle shift systems and has led to the development of innovative changes in shifting strategies. A shifting strategy significantly influences the dynamic and economic performance of a truck. If a shift control system can predict the information of the road ahead, then the dynamic programming method can be used to obtain an optimal shift schedule, thereby achieving the best balance between the dynamic and the economic performance of a truck. Determining the weights of the economic and dynamic performance of a truck is critical in dynamic programming. Weight is related to road slope value; hence, this study uses different weights on 3%, 5%, and 10% ramp simulation experiments to investigate the relationship between fuel consumption and running time and to determine the optimum weight for different slopes. On the basis of the optimal shift schedule obtained via dynamic programming, the ramp information of the road ahead can be utilized to adjust the shift point to avoid unnecessary shifting before entering the slope and reduce shift times on a ramp. An actual truck test shows that the anthropomorphic shifting strategy proposed in this study meets driver expectations and is conducive to the ramp driving of trucks with automated manual transmission.
Keywords
Introduction
In the product cycle of a heavy truck, 30% of the cost is spent on fuel. 1 The main purpose of a heavy truck is to transport goods; hence, truck manufacturers pay more attention to fuel economy than to passenger riding comfort. With the aid of look-ahead information, intelligent speed adaptation and control, which is called the “no-cost” solution, has been developed and can significantly reduce the energy consumption of vehicles.2,3 In speed adaptation research, look-ahead information, such as road grade, speed limits, stop sign locations, road curvatures, average traffic flow speed, and traffic lights, have been utilized.4–7 Beside speed adaptation, a gear-shifting strategy is also closely related to vehicle fuel consumption. The use of look-ahead information is a new direction in the development of shifting strategies in recent years. The introduction of look-ahead information in shifting strategies can help reduce the fuel consumption of vehicles. In the past few years, the number of gear blocks in the gearbox of heavy trucks has been increased to enhance the probability of the engine being able to work within the speed range with low fuel consumption or sufficient torque. 8 These speed ranges do not overlap, and the fuel economy performance and dynamic performance of a vehicle exhibit a contradictory relationship. 9 A gear-shifting strategy can determine whether engine speed is within the economic or dynamic speed range. Different slopes pose varying power demands on vehicles. Therefore, an economical/dynamic gear shift mode handle or button has been designed in general for drivers to select manually in order to adapt to changing road conditions. But when ramps and flat roads appear alternately, frequently changing gear shift modes will cause drivers to tire easily. In addition, driver judgment of road power demand is not always reasonable. Current automatic gear-shifting strategies cannot intelligently determine road power demands on vehicles and thus cannot automatically put in the best gear shift mode. However, the addition of look-ahead information to the gear shift control system can help solve these problems.
In the literature of speed adaptation, an optimal control algorithm based on dynamic programming (DP) algorithm is commonly used.9–12 DP algorithm can also be used for optimal gear shift sequence with look-ahead information in ordinary driving mode where the driver controls the throttle. For different vehicle types, the specific application of DP algorithm is not identical due to different optimization objectives and vehicle structures. To a conventional vehicle, the key problem of DP algorithm is how to make the power and economic indicators’ integration in a cost function, that is, how to allocate the focus of shifting strategy on dynamic performance or economic performance to the vehicle. Hellström et al. 13 presented a method for weighting dynamic and economic performance, but did not explain how weights are determined. Han et al. 14 converted the dynamic index into power demand, but did not propose how the actual road can be matched to the power demand. Fu 15 transformed the dynamic index in the objective function into the reserve power constraint of the optimization process. In the current study, we use a variety of weights on 3%, 5%, and 10% (gentle, medium, and steep, respectively) ramp simulation experiments to investigate the relationship between fuel consumption and running time and to determine the optimum weight for different slopes. Accordingly, the definite weights that correspond to the slope of the road ahead can be allocated automatically in DP to plan an optimal gear shift schedule in real-time driving.
However, look-ahead information is also helpful in designing anthropomorphic automatic shifting strategies. Excellent drivers not only consider the performance of vehicles but also the road that the vehicle is about to travel on in manual shift mode. Driving environment identification is an important prerequisite for a shifting strategy. Normal identification methods are effective only when a vehicle is running in that environment. Thus, unnecessary shifting frequently occurs16,17 when road information ahead of the vehicle was not considered. Although unnecessary shifting does not conflict with the gear shift logic under the current road conditions, it does not conform to driver intention and will increase the fuel consumption of vehicles with automated mechanical transmission (AMT).
This article explores the application of look-ahead information in gear-shifting strategy in two ways. First, the relationship between slope grade and weight coefficient in DP algorithm is discussed in the aim to minimize fuel consumption. Second, look-ahead information is utilized to make shifting strategies more anthropomorphic and more intelligent than before. Therefore, after a truck model is built in section “Truck model” according to the requirement of DP algorithm and simulation, the effects of weight values on fuel consumption and running time are studied in detail when the truck is on different slopes. We studied how to design a curve gear-shifting strategy using the look-ahead curve information in 2016. 18 In section “Look-ahead gear-shifting strategy on ramps” of this work, a gear-shifting strategy on ramps based on the look-ahead information is studied, and an actual vehicle experiment verifies the effectiveness of anthropomorphic ramp-shifting strategy in section “Online test of the look-head gear-shifting strategy.” Finally, the article is concluded in section “Conclusion.”
Truck model
The power transmission system of a truck can be divided into two parts: the engine and the transmission. 19 The latter includes a clutch, an AMT, a final drive, wheels, and drive shafts, as shown in Figure 1. The engine is the power source of the truck, and its torque characteristics and fuel characteristics are related to gear shift planning.

Sketch of the power transmission system of a truck.
In this work, the power source of the truck is a 276-kW diesel engine. The torque characteristics can be expressed by engine angle speed

At a certain throttle opening, the torque can be fitted by a quadratic polynomial of the engine speed as follows

where
Engine torque data under different throttle openings were obtained via engine bench test and fitted by equation (2), as shown in Figure 2.

Diagram of engine load characteristics.
The fuel consumption of the engine can be calculated by the time integration of fuel consumption per unit hour. Fuel consumption per unit hour


Diagram of engine fuel consumption characteristics.
Similar to the principle of torque fitting,

where
A powertrain model follows the literature.12,20,21 Without considering clutch bonding process characteristics and energy loss in which the clutch is simplified as a power transmission switch, the engine torque transmission process that goes through the transmission, final reducer, and final transmission to the wheel is modeled as

where

where
From equations (1) and (6) and the relationship between engine speed

Similarly, hourly fuel consumption,

Assume that

where x is the state vector that includes velocity v and the currently engaged gear g,
Look-ahead gear-shifting strategy on ramps
Optimizing the gear-shifting strategy via DP
Cost function
The optimization target includes fuel consumption and running time. The former represents vehicle economic performance, whereas the latter represents vehicle dynamic performance.
Optimization aims to minimize fuel use and trip time. For optimization via a numerical method, models (4) and (5) should be dependent on position rather than time. In accordance with the conversion method presented in the studies of Ivarsson et al.
22
and Franke et al.,
23
suppose s denotes a short distance and
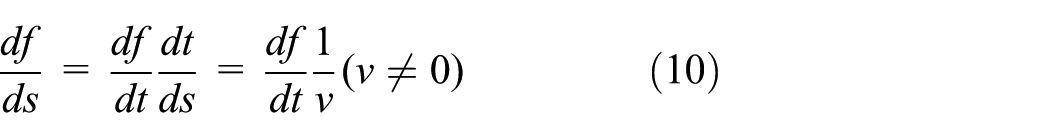
From equation (10), the running time and fuel consumption of a trip from


Then, the cost function is

where
If the predicted distance h is divided into N segments, then equations (11) and (12) can be written in discrete forms as


Then, the cost function can be expressed as

Constraints
State constraints
State constraints include two aspects: speed and gear. Each truck has a maximum design speed, which will not be exceeded by the current speed according to the transmit design. In addition, the current speed under a certain gear is within a certain range because it is limited by engine speed range

The current gear is limited to the number of gears in the transmission, and gear shifting should not be skipped. The rules are as follows

where
Control constraints
If the current gear has the lowest value, then shifting down is impossible. The next gear can only maintain the current position or shift up. If the current gear has the highest value, then the next gear cannot shift up. Apart from the aforementioned two cases, the current gear can shift up, shift down, or remain still

DP algorithm
The detailed guidelines for DP algorithms can be found in the literature.9,14,24 In the current study, the algorithm is summarized as follows
Step 1. Let
Step 2. Let
Step 3. Let
Step 4. Repeat step 3 for
Step 5. When k = 0, the optimal cost is
Determining the weight coefficient
The weight coefficient in DP determines the economic and dynamic performance of the optimized shift schedule. The weight coefficient is related to the ramp value of the road within a forecasted range. The truck has nearly all the power required to pass through the ramp on a steep slope, and economy cannot be considered. Power and economy can only be considered on a less steep ramp because the engine can still retain a certain amount of reserve power. In this section, offline simulation adjusts the weight to enable the slope value to find the best weight that can simultaneously satisfy the power demands of the road and save fuel. Thus, the definite weight coefficient in real vehicle driving will be set according to the road slope that the truck is about to enter and the optimal shift schedule can be obtained via real-time programming with DP.
On 3%, 5%, and 10% slopes (1500-m long), the weight coefficient of
Truck parameters for simulation.

Truck simulation data at ramp 3%.

Truck simulation data at ramp 5%.

Truck simulation data at ramp 10%.
On the basis of a large number of user surveys, China National Heavy Duty Truck Group Co., Ltd concluded that fuel consumption is the issue that mostly concerned Chinese automatic truck users. Therefore, the economic performance of a truck is the first standard used to evaluate the quality of its gear shift schedule. The simulation results show that the overall trend of the influence of the weight coefficient on fuel consumption and running time on different slopes is as follows. When the dynamic weight reaches its maximum value, running time is the shortest and fuel consumption is the highest. As the dynamic weight is reduced, running time increases and fuel consumption decreases. When the economic weight achieves its maximum value, fuel consumption is the lowest and running time is the longest.
Assume that
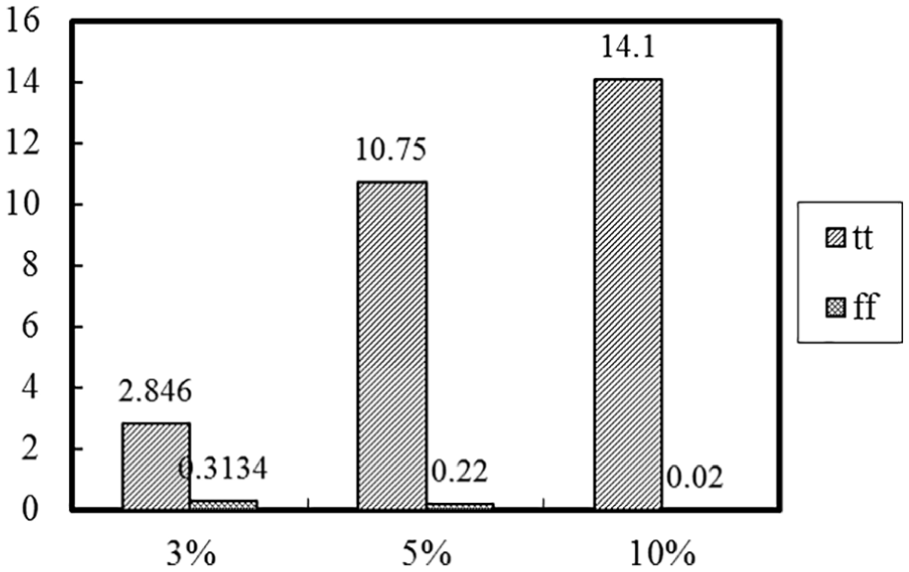
Comparison of tt and ff at slopes of 3%, 5%, and 10%.
As shown in the figure, fuel saving caused by the gear shift schedule, which focuses on economic weight, is significantly reduced with an increase in slope value. On the 3% slope, fuel saving is 0.3134 kg; on the 5% slope, fuel saving is 0.22 kg, which is lower than that on the 3% slope. When slope is increased to 10%, fuel saving is only 0.02 kg; hence, the fuel consumptions of the dynamic and economic gear shift schedules are nearly the same. Simultaneously, in the economic gear shift schedule, the additional running time used to save fuel consumption increases with increasing slope. On the 3% slope, the additional running time is 2.846 s; on the 5% slope, the additional running time is increased to 10.75 s. When slope increases to 10%, the additional running time is 14 s. Therefore, gear shift emphasis should be on vehicle economic performance when the grade is not steep (less than 5%). When the slope is increased to 10%, fuel can hardly be saved by focusing on the economic characteristics of the gear shift schedule; instead, running time will increase. Therefore, gear shift focus on vehicle dynamic performance is suitable.
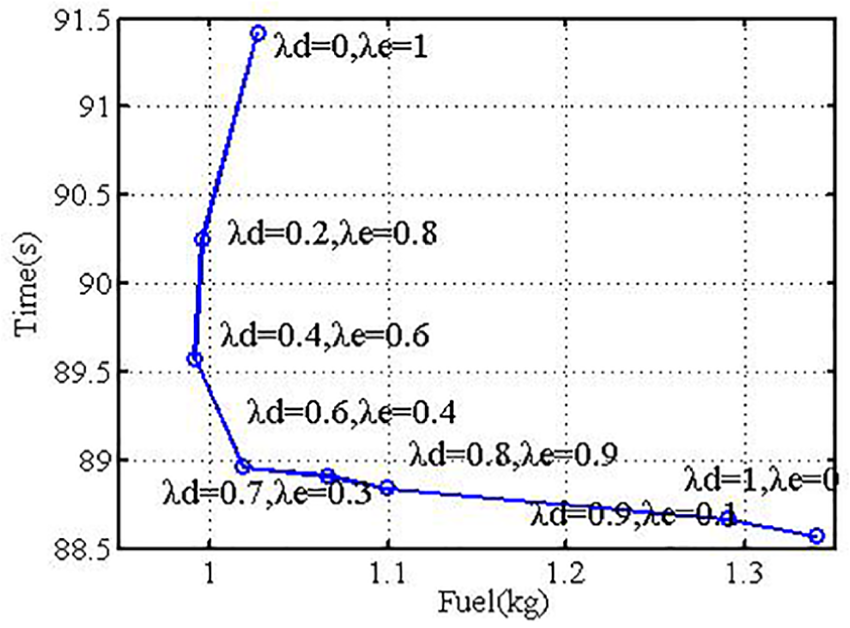
When the amount of fuel consumption is decreased, the running time of a vehicle increases, that is, fuel consumption is inversely proportional to running time, which represents the dynamic performance of a vehicle. Although fuel consumption is the most important index used to evaluate the quality of a gear shift schedule, this index is unreasonable if the set of dynamic and economic weights causes the vehicle to spend considerable travel time, whereas the amount of fuel saving is nearly negligible. On some ramps, fuel consumption is low when economic weight is below 1. For example, in the simulation of the 3% ramp, fuel consumption achieves its minimum value when
To describe the influence of weight change on the economy and power performance of a vehicle according to the setting principle of the cost function in DP, the running time and fuel consumption of the vehicle simulation results are normalized. Assume that
Normalized running time and fuel consumption on 3% ramp.
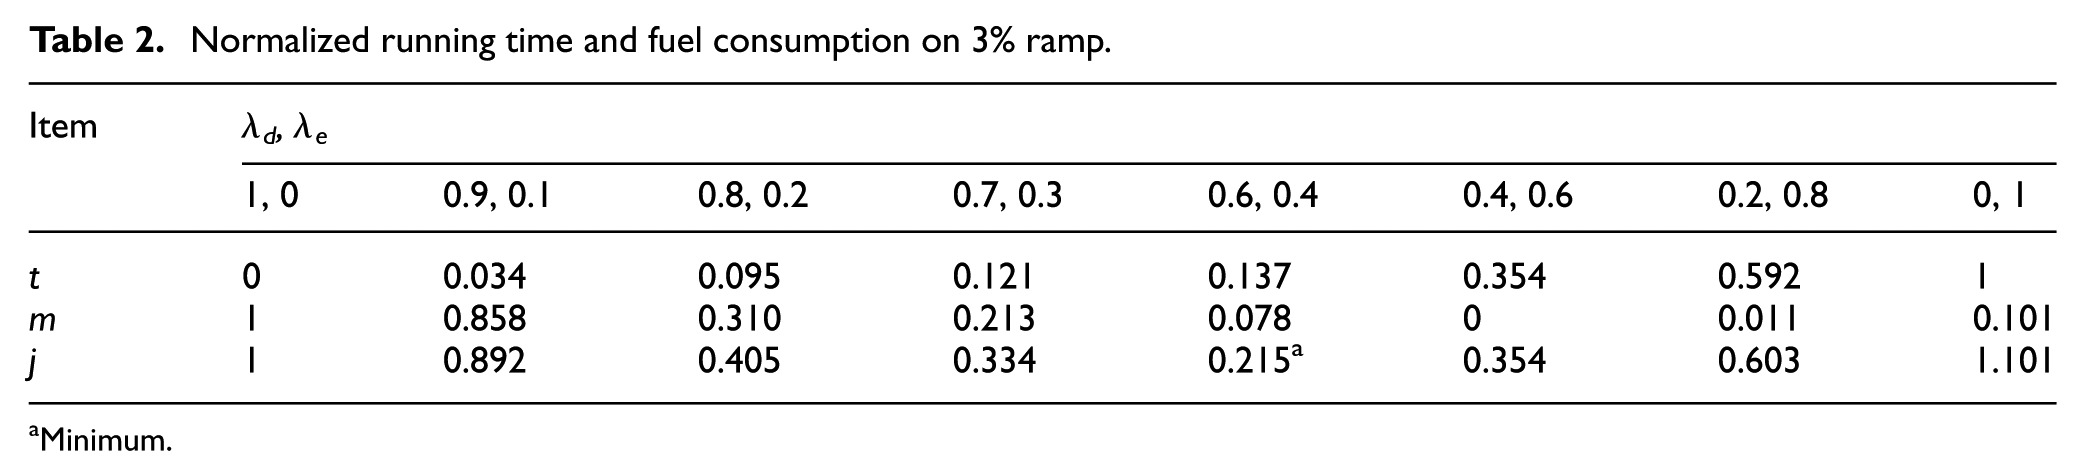
Minimum.
Normalized running time and fuel consumption on 5% ramp.
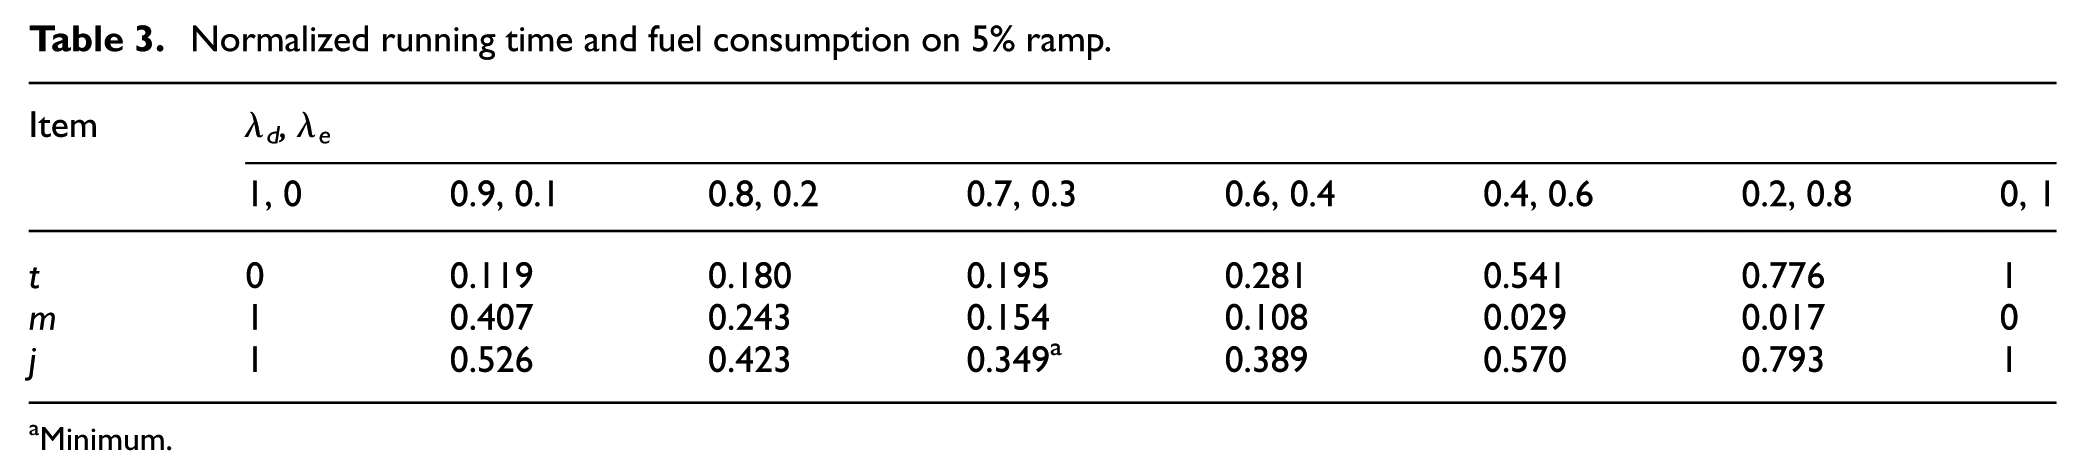
Minimum.
Normalized running time and fuel consumption on 10% ramp.

Minimum.
When fuel consumption and running time are adopted as evaluation indexes, the comprehensive optimum weight coefficient is
Anthropomorphic shifting strategy for slope driving
In section “Optimizing the gear-shifting strategy via DP,” the information of the road ahead of the vehicle is used to help solve the optimal gear shift schedule, which is suitable for road power demands. With predictable slope information, unnecessary shifting can also be avoided in certain special travel points, thereby achieving anthropomorphic shifting and improving shifting strategy performance. “Unnecessary gear shifting” refers to the phenomenon in which the shift system changes gears for a short time and then shifts back to the original gear position because the shift system cannot accurately identify the driving environment and driving intention or cannot predict the condition of the road that it will be entering. Engine power interruptions will reduce speed during automated manual transmission (AMT) shifting. When driving on a ramp, speed reduction is more serious than that on a flat road due to ramp resistance. Therefore, the shift times of a truck should be minimized in ramp driving. Driving rapidly through a ramp and reducing the number of shifts are highly recommended fuel-saving driving techniques based on experiences. An anthropomorphic shifting strategy is exactly designed which is appropriate for these driving habits with the advantage of predictable geographic information.
Behavior analysis of a truck running on a ramp
To make the shifting strategy on a ramp comparable with that of the manual shifting of an excellent driver, the driving behavior and manual shifting habit on a ramp of a driver should be analyzed first.
Limited by engine power, a truck will eventually travel at a constant speed if the ramp is sufficiently long. Such steady speed, which is related to slope and truck load, can be obtained through an observation experiment
25
and solved via vehicle longitudinal dynamics. From the analysis in section “Truck model,” the engine torque at a certain throttle opening can be fitted by vehicle speed. Then, equation (7) can be rewritten as

The speed that corresponds to each gear position can be calculated using equation (20). Each gear corresponds to a certain speed range (
If the initial speed before entering the slope is high, then slowing down to a steady speed after entering the slope will take a long time. We illustrate this problem with a 50-ton truck crawling on a 5% ramp at initial speeds of 60 and 40 km/h. To simplify the problem, shift influence on speed decline is not considered, and the engine is assumed to provide only power that is equal to the resistance force on a flat road, that is, vehicle driving force can only overcome rolling resistance and air resistance. The truck will then decelerate to a steady climbing speed with the deceleration produced by slope resistance. The calculation of the distance traveled by the truck during the deceleration process is shown in Figure 8.

Relationship between speed and slope length.
For a given ramp length, the higher the initial speed, the longer the speed decline to a steady climbing speed, and the shorter the time taken to climb. Therefore, skilled truck drivers will increase speed before the truck enters the ramp. In this case, an automatic shifting strategy should not upshift as much as possible; otherwise, the truck cannot speed up within a short time.
For a truck with AMT, vehicle speed will decline during gear shifting for engine power interruption. The speed decline is more serious when the truck is on a ramp than on a flat road due to ramp resistance. Therefore, the number of shifts should be minimized in ramp driving. To avoid downshifting on the ramp or to reduce the number of shifts on the ramp, the driver will also shift down properly when increasing speed before entering the slope in manual driving.
An automatic gear-shifting system may shift up the gear in view of increasing speed according to the flat road gear shift schedule if the control system does not know the ramp ahead and gear changing before entering the ramp does not conform to driver intention. On the basis of driving behavior observation, drivers typically increase the throttle opening to enhance the speed required to enter a ramp when the truck is still within a certain distance from the ramp. Under these circumstances, an automatic shift system without predictive capability may shift up in the A′A section, as shown in Figure 9. In the AB ramp stage, a traditional shift system calculates the ramp shift rule after recognizing the value of the slope, and then, the truck runs with the shift rule for the ramp until it reaches a flat road, which uses a shift schedule for a flat road. If the automatic shift system cannot predict the road ahead, then it may issue a downshift command according to shift rule before the truck gets out of the ramp at point B′, and this shift will not occur in manual shifting. When the truck is about to pass through the slope, the abolition of downshifting can avoid upshifting again within a short time because vehicle speed will increase rapidly for the gradient force, which vanishes when the truck leaves the ramp. If a gear shift at B′ is possible, then this shift should be delayed on the flat road next to the ramp to reduce the adverse effects of shifting on a ramp.

Road geometry of truck ramp driving.
Anthropomorphic shifting strategy on a ramp
The anthropomorphic shifting strategy is based on the basic shift schedule planned via DP, and the guiding principle is as follows: within engine speed limits, cancel upshifting in the A′A segment and avoid gear changing while the truck is going out of the slope.
When the driver increases the throttle at point A′ before entering the ramp, the shift system estimates the speed

Flowchart of shifting strategy before entering the ramp.
Suppose that the truck travels to A at an acceleration of point A′. Then, speed
where speed
In addition, the anthropomorphic shifting strategy can play a role in the phase when the truck is about to leave the ramp. If the truck is facing downshift at point B′, then this gear changing can be canceled within an allowable range of engine speed. The reason for the cancelation is that the gear that has been downshifted will soon return to its original position. When the truck is out of the ramp, speed will increase because running resistance decreases as gravitational force disappears. If the truck is facing an upshifting at point B′, then the gear shift can wait until the truck reaches the flat road after the ramp. With an appropriate delay, this shifting strategy can reduce power losses given that power loss in gear shifting on a ramp is more serious than that on a flat road.
Similar to the shifting strategy formulation rule in A′A, if a downshift is possible at point B′, then predict first speed
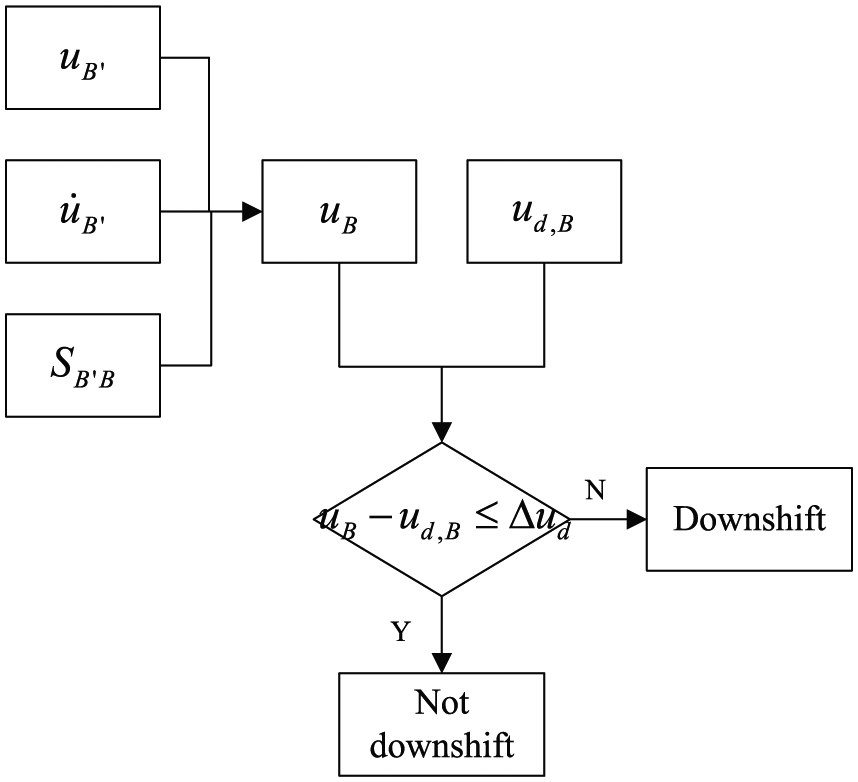
Flowchart of downshifting strategy before leaving the ramp.

Flowchart of upshifting strategy before leaving the ramp.
Online test of the look-head gear-shifting strategy
For the shifting strategy based on the geographic information prediction used in a commercial vehicle, a Global Positioning System (GPS) map that is suitable for the shifting strategy should be first constructed, and then communication between the GPS device and the truck shift control system should be completed. Our laboratory does not have the condition for real-time communication between a GPS device and a shift control system. Therefore, we set up an established route experiment in the test site. Through the pre-measurement of the geographical parameters of the driving track and by starting at a certain location, the real-time location of the truck can be calculated based on speed. 26 The shifting strategy is written according to the preset experimental conditions to match the driving geographical environment. In this manner, the shifting strategy based on geographical prediction can be verified.
An experienced professional trucker (with driving experience of over 10 years) drove the truck in a customary manner in our experiment. Figures 13 and 14 show the driving data using conventional automatic and anthropomorphic shift schedules, respectively.

Conventional shifting strategy test data on ramp.

Anthropomorphic shifting strategy test data on ramp.
In the conventional shifting strategy experiment, vehicle speed increased slightly before entering the ramp, and thus, the gear shifted from the 15th to the 16th. In accordance with the ramp-shifting strategy where the position on the 15th gear is suitable, the truck maintained the 16th gear only for 8 s and then downshifted to the 15th gear. In this case, upshifting from the 15th gear to the 16th gear before entering the ramp should be avoided. When the truck was about to exit the ramp, the gear upshifted from the 10th to the 11th. Gear position was maintained on the 11th gear for 5 s and then the truck left the slope. In terms of reducing energy loss while gear shifting on a ramp, gear change should be delayed until the flat road after the ramp is reached.
In the experiment using the anthropomorphic shifting strategy, the driver increased the throttle to accelerate and prepare to enter the ramp at a distance away from the ramp. The gear position was at the 15th when the driver began to accelerate, and it should shift up (mark ①, shown as a dotted line) according to the flat road shifting strategy because the truck was still on the flat road at that moment. However, the truck entered the ramp with the gear position at the 15th because the anthropomorphic shifting strategy canceled the upshift. After entering the ramp, the speed dropped and the gear downshifted from the 15th to the 14th at mark ②, as shown in Figure 14. The truck was about to exit the ramp (in 10 s) at that time, and thus, the anthropomorphic shifting strategy delayed the gear shift and the truck left the slope with the gear position on the 14th.
The preceding experiments show that the look-head information can help the shift control system make appropriate delays or advances for upshifting/downshifting to avoid unnecessary gear shifts. This method is particularly advantageous for reducing shift times and power interruptions in ramp driving.
Conclusion
In this work, the application of look-ahead information to ramp-shifting strategy for trucks with AMT is studied in two aspects: fuel saving and anthropomorphization. In the aspect of fuel, the weights of power and economy are analyzed when the DP method is used to solve the optimal shift schedule. For ramps of more than 10%, the shifting strategy should focus on the dynamic performance of a vehicle because the savings in fuel consumption are particularly minimal and running takes too much time. For ramps with a gentle slope (i.e. less than 3%), the shifting strategy should focus on economic performance because fuel saving is considerable and running time is not too long. On a moderate ramp (3% < i < 10%), two criteria, namely, fuel consumption and running time, are used to adjust the weight, thereby enabling the shifting strategy to achieve an optimal balance between dynamic and economic performance.
Furthermore, the look-ahead information is helpful in increasing shift performance when shift adjustment imitates the manual shifting of an excellent driver. When the shift system has clear information of the geometry of the road where the vehicle is about to enter, the anthropomorphic shifting strategy can match driver operation and make shift instructions that conform to driver intention to facilitate driving on a ramp. We observed driver’s driving behavior on a ramp and analyzed its rationality. An anthropomorphic shifting strategy is designed for the operations of accelerating before entering the ramp and changing gear before leaving the ramp. Experiments on the anthropomorphic shifting strategy proved that unnecessary gear shifting can be avoided before entering the ramp and power losses caused by shifting on a ramp can also be reduced by delaying gear shift.
Footnotes
Acknowledgements
The authors would like to thank China National Heavy Duty Truck Group Co., Ltd for providing the survey data, experimental conditions, and technical support.
Handling Editor: Yanjun Huang
Declaration of conflicting interests
The author(s) declared no potential conflicts of interest with respect to the research, authorship, and/or publication of this article.
Funding
The author(s) received no financial support for the research, authorship, and/or publication of this article.