
Abstract
Truck-related crashes result in tremendous lives and property loss and become a serious safety issue in China. The goal of this article is to identify the influential factors for severity of truck-related crashes using data from Jingjintang freeways in China and to design an ordered probit model to explore their relationship. Records including crashes, traffic flow attributes, and geometric design features ranging from 2009 to 2012 were collected from Jingjintang freeway. Crashes are divided into three severity levels: slight injury, injury, and fatal injury. The injury crashes is ranking the first place occupying 64.37%. Truck-related crashes are likely to occur when truck percentage is around 20% and 80%. The speed of traffic flow decreases with the more appearance of trucks. The ordered probit model is developed to estimate the impacts of influential factors on injury severity of truck-related crashes. Marginal effects for each level of injury severity are calculated. The results reveal that truck-involving crashes are highly sensitive to factors such as time of day, truck percentage, average slope, operating speed, speed difference, and exposure variable. The average slope of road segment and speed gaps has the greatest impact on all severity levels of crashes.
Introduction
There are currently 117,000 km freeways in China and over 50,000 people die of accidents per year. More heavy trucks are running on freeways than before because of the rapid growth of delivery demand. Various dimensions, sizes, and operating abilities may create serious safety problem for traffic flow. According to crash statistics from Public Security Administration Bureau, truck-related crashes resulted in 21.1% of crashes, 36.45% of the total crash fatalities in 2016. 1 Trucks have poorer operating capabilities than passenger cars, particularly in acceleration, deceleration, turning, and the ability to maintain speed on upgrades, longer stopping distances from a given speed. That trucks mix in traffic flow causes speed gaps between trucks and passenger cars. These features in combination with larger weight definitely increase the severity of crashes. Overload, which is common in China, will exaggerate this safety problem. Few previous studies only focused on factors contributing to severity of truck crashes in China. Therefore, it is critical to study exclusively on truck-related crashes and explore relationship between injury severity and influential factors. The findings would help to provide countermeasure to prevent truck-involving crashes and mitigate the severity of truck-related crashes on freeways in China.
Literature review
Many researches investigated the factors contributing to severity of truck-involving crashes for freeway and other types of highway. The main variables studied in the previous researches include roadway characteristics, 2 temporal characteristics, environmental factors, vehicle characteristics, human factors, collision characteristics, occupant characteristics, and traffic conditions.3–7 Influential factors are more or less different between trucks and passenger cars. Severities of truck-related crashes are highly affected by time, driver fatigue, speed, driver pay, and vehicle defects. 8 Truck load is also identified as a significant issue. Nevertheless, the relationship between truck load capacity and vehicle safety is not inclusive, which does not necessarily decrease road traffic safety. 9 Ma et al. 10 examined the impacts of driving behavior on driver injury level at highway-rail grade crossing accidents.
Many discrete choice models have been applied to explore the risk factors in different severity injury, such as logit-based models, ordered probability regression models, and general linear model.4,11–15 Wang and Shi 16 identified the variables such as segment length, weather conditions, and ramp that affect truck safety performance and developed a hierarchical regression model. Taimur et al. 17 designed a multilevel logistic model to describe the severity of crash. They found that the established model fits well. The ordered probit model, rather than the logistic model, was preferred to predict the severity of crashes, because the crashes are naturally ordered.18–20 The ordered probit models are divided into random and fixed types according to parameter terms. Random parameter model is often used to reveal unobserved characteristics during accidents. These factors increase the severity of injuries including head-on collisions, high speed limits, older truck drivers, and trucks hauling a trailer with heavy cargo. 21 The non-parametric models such as decision tree, clustering, and neutral artificial network generally focus on analyzing the traffic safety problems in recent years.22,23 The previous studies indicate that non-parametric is an effect of classification tree. Most of the non-parametric methods may not provide direct relationship equations because the captured relationship is often non-linear and kernel functions are used to approach the real distribution. Recently, many researchers focused on factors contributing to truck crashes. Zheng et al. 24 applied gradient boosting technique to analyze the relationship between crash severities and a set of heterogeneous risk factors. In China, few studies model truck accidents and their influential factors. Houshu et al. 25 used the principal component analysis to identify the traffic characteristics. It is found that crashes are more serious when the value of traffic flow principal component index is close to zero.
Objectives
The primary objective of the article is to explore the effects of geometric design and other factors on crash severity of truck accidents of freeway in China. Trucks, in this article, include large trucks, truck tractors, and medium trucks. A set of aggregation data was collected from Jingjintang freeway in China including roadway geometry and traffic flow features. In this article, the fixed-parameter ordered probit model is employed to estimate the severity level of truck-involved crashes and their influential factors. Marginal effects analysis is used to evaluate the sensitivity of explanatory variable changes. Conclusions are posed at the end.
Data description
Jingjintang freeway is one of the heavily traveled four-lane freeways in two directions with 0.75 m width curbs. Its total length is 142.69 km. The 3.5-m-width median is used to divide two directions and right shoulder width is 2.5 m. Data used in this article were collected from various sources from 2009 to 2012. Dataset consists of road alignment, crashes, annual average daily traffic (AADT), traffic composition, traffic flow, and segment features. The speed limit of freeway is 110 km/h. Inductive loops, video sensors, and radar detectors were installed in each segment to collect spot speed, traffic volumes, and vehicle types. There are totally 28 investigation sites in this study. The exact markers of locations are k1+500, k6+500, k11+300, k12+530, k3+135, k13+730, k26+600, k26+800, k27+000, k37+400, k37+668, k38+120, k38+500, k71+337, k72+200, k96+915, k97+650, k98+700, k99+130, k103+250k, 107+920, k108+500, 109+680, k127+900, k132+750, k132+950, k133+670, and k133+870. (“k” denotes the distance from the commencement point to the current site and the interval is 1 km.) AADT along the freeway is between 15,000 and 45,000 passenger car unit (pcu) per day. The peak AADT appears in the outbound of Beijing and the lowest appears in inbound of Tian’jin. All vehicles are classified into two categories according to the axle distance between the front and the rear wheels which is consistent with the classification of Technical Standards of Highway Engineering (JTG B01-2014). Passenger cars are vehicles whose axle distance is shorter than 3.8 m and others are trucks. It was calculated that the mixture truck rate in traffic flow during survey period was between 8.9% and 94.9%. Records of speed of passenger cars over 130 km/h and truck speed over 80 km/h were removed from the raw datasets.
Aggregation crash records were obtained from police report on a standardized, closed-ended data collection form. There are 13 data items including vehicle position, orientation, year, month, day, hour, minute, crash location, weather, severity level, crash causes, economic cost, and vehicle type. Crashes are divided into four severity levels: slight injury, injury, fatal, and extremely serious fatal crashes according to Public Security Bureau. In this article, the recorded crashes are divided into three categories. The slight injury and injury crashes are consistent with the records from the police report. The fatal and extremely serious fatal crashes are integrated into fatal crashes. There are totally 3784 crashes recorded along Jingjintang freeway during 4 years, of which 656 are truck-involving crashes. In total, 75 are fatal crashes, 159 are injury, and 422 are slight injury. Property-damage-only crashes are not included in crash records. The leading reason accounting for 57.89% accidents is improper maneuver, followed by speeding (8.96%).
Figure 1 shows the spatial distribution of truck-involving crashes along the freeway. From the figure, we can see that k0 is approaching Beijing direction and k139 Tianjin direction. There are more accidents on segments approaching Beijing direction. Locations such as k9+000, k26, k66, k73, and k104 have a higher crash occurrence than other places. The accidents are most likely to occur on k26 section than other segments.

Distribution of crashes along freeway.
Deeper investigation was done for truck-related crashes, which can be divided into three types. Injury crashes occupied 64.4% of total truck crashes, ranking the first place, followed by slight injury crashes 24.23% and fatal crashes 11.43%. Figure 2 shows the impact of truck mixture on truck-related crash severity. All types of accidents have similar trends. When truck mixture rate reaches 20%, all three crashes increase to their peak values, followed by a decrease when the truck mixture rate is between 40% and 70%. Three levels of crashes grow slightly when the mixture rate is 80%.

Truck mixture rate and crash types.
The article collected traffic flow data from loop data collected in a 24-h period and calculated the average value for each hour. Figure 3 illustrates the overall 85th speed of each section in 24-h. Since Jingjintang freeway is in plain terrain, speed of most drivers is above 80 km/h and the lowest speed is 50 km/h. When truck percentage is less than 70% in traffic flow, speed is much more uniform. The overall speed of traffic flow slightly decreased with increasing trucks.
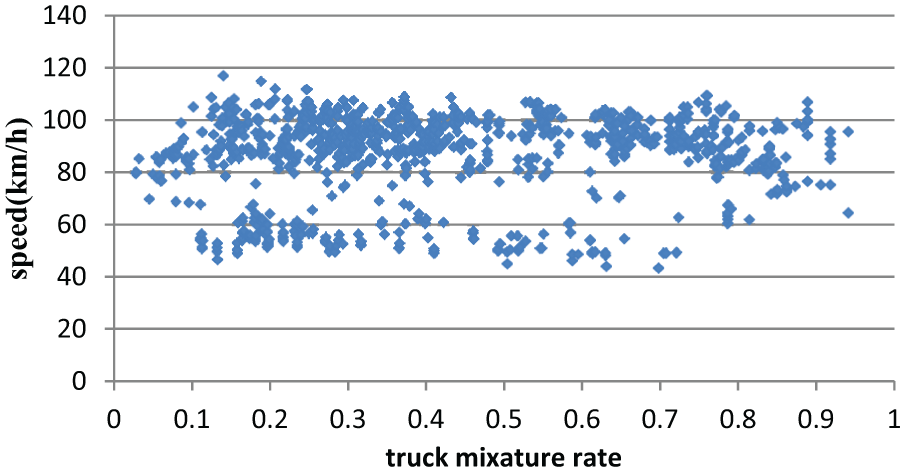
Truck mixture rate and flow speed.
Speed difference between trucks and passenger cars is a significant factor related to traffic safety of freeway. The speed difference in this article is the gap between average hourly truck speed and hourly passenger car speed. Speed difference between trucks and passenger cars of each segment is shown in Figure 4.

Speed difference along freeway.
Figure 4 illustrates that speed difference between trucks and passenger cars has a curve relationship with truck mixture rate. The average speed gap is below 20 km/h, which indicates a fairly good condition of speed coordination. Then, the average speed gap exceeds 20 km/h when the truck mixture rate is above 10% and increases to 30 km/h with 50% truck mixture. Then, the speed gap decreases when more trucks appear in traffic flow. The speed gap dropped below 20 km/h when the mixture rate goes up to 80%, which indicates that more trucks in traffic flow leads to a uniform speed.
Figure 5 shows the relationship between truck spot speed and crash severity. There is no obvious increase in accidents until speed reaches 50 km/h. Accidents are unlikely to happen when the truck speed is below 30 km/h. When it reaches 70 km/h, there is a dramatic increase in all crashes. Three types of crashes increased to 120, 50, and 30 per year, respectively.

Truck speed and crash severity.
Data statistics
Descriptive statistics of variables are presented in Table 1, which are statistically significant variables (p-value < 0.05) in the final models. The 24 h is divided into three sub-time periods according to traffic flow condition (congestion and free flow) and light condition. They are (1) midnight to 6 am, (2) 6 am to noon, and (3) noon to midnight.
Summary of variables.

Exposure variable, expo, is defined in equation (1)

where expo is the function of truck crashes that occur on road segment with various length and traffic volume.
Segmentation methods
First, the whole freeway needs to be divided into segments with various lengths. Short segments could result in excess zero observation, while long segments result in rough data model. In this study, the length of freeway segments varies according to the attributes such as radius of horizontal curves, grade, length of slope, length of tangent, traffic volume, and truck percentage. The whole Jingjintang freeway is divided into 64 sub-segments.
Methodology
Ordered probit model
Multinomial logistic (MNL) regression is a simple extension of binary logistic regression that allows for more than two categories of the dependent or outcome variable. The model often considers an attractive analysis for accident severity because it does not assume normality, linearity, or homoscedasticity of variables. However, MNL regression is related to some undesirable properties, such as lack of a closed-form likelihood and large sample size. Because injury of freeway segments is naturally ordered, the ordered response models have increasingly been used to model injury severity outcomes when multiple category variables are recorded in order. The ordered probit model requires smaller samples than unordered response models.
Ordered probit model is supposed that the error follows normal distribution. The general specification is given in equation (2)

where yi is the independent variable, which denotes the severity of truck-related crashes; β is the vector of parameters to be predicted;
In equation (3), zi is an integer that represents the injury severity level outcome, and yi is denoted by

where

where
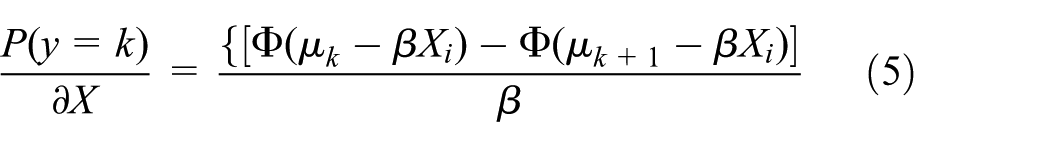
The marginal effects indicate severity outcome changes when a specific explanatory variable changes in unit. The marginal effects of discrete binary variable measure change. For continuous variables, they measure the instantaneous rate of change. The probability outcome for each level of severity is given in equation (5)
The flow chart for design of injury severity model for accidents of Jingjintang freeway is described in Figure 6.
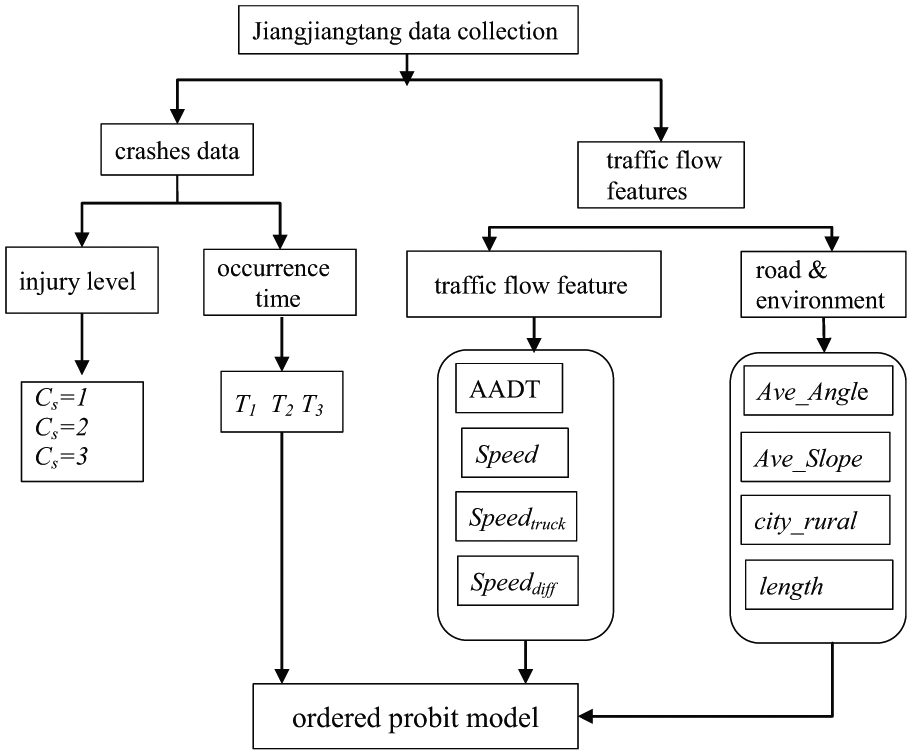
Flow chart of modeling process.
Modeling results
In probit model, the maximum likelihood estimation was applied to achieve the parameter vector β using Stata. Two goodness-of-fit measures provided the adjusted log likelihood ratio index (
Ordered probit model estimation results.

Independent variables are identified based onp-value of t-test and only six variables are significant at 5% level (p < 0.05). A positive sign of parameters in the models indicated that crash severity increased with the increase in the value of the explanatory variable, and decreased if the parameter is negative. The parameters of category variables such as T1, T3, ptruck, ave_ slope, expo, speed, and speeddiff associated with higher crash severity are positive related to severity of truck-involving crashes. (The estimation coefficients are 0.1044, 0.321, 0.215, 0.23, 0.041, 0.445, and 0.442, respectively). All these six factors would increase the severity of crashes. Other variables are excluded from the final model. The time of day (T1 and T3) has a great impact on the severity of truck-related crashes, indicating that night time and early morning increase the severity of crashes.
During that time, drivers are likely to increase their speed due to low traffic flow, therefore long distance is required during two-vehicle crash or any roadside object. Furthermore, drivers tend to be fatigue at night time and often result in the secondary accidents due to low visibility. In order to reduce night-time crash severity, drivers should lower their speed and prevent fatigue. Speed (0.445) of traffic flow has the greatest impact on severity, while expo appears to have the smallest impact (0.041), which indicates that high speed will result in increasing severity. ptruck (0.215), speeddiff (0.4420), and ave_slope (0.23) also have great impact on severity of accidents. The intercept is zero. When trucks are running on the slopes, the large downgrades result in increasing severity of injuries.
The adjusted value (
Marginal effects show the change in probability when the independent variable increases by one unit. They are the partial effects of each explanatory variable on the probability. Table 2 also presents the calculation of marginal effects of explanatory variable for each severity. p-values (<0.05) in the marginal effect part show the significance of variables. Factors such as average slope and speed difference are likely to be involved in all levels of severity. These factors have the greatest impact. The severity of crashes increases with increase in gradients and speed difference. More trucks appearing in traffic flow increase the probability of slight injury or speed difference.
Conclusion
The article studies the geometric features, speed factors, and other factors that impact the severity of truck-related crashes after analyzing the data of Jingjintang freeway. Spatial distribution of truck-related crashes was first analyzed. Locations such as k9+000, k26, k66, k73, and k104 have a higher crash occurrence than other sections. There is an increasing trend when approaching Beijing direction. 64.37% of truck crashes are injury crashes, followed by slight injury crashes. The conclusions are as follows:
Truck-related crashes are likely to occur when the truck proportion of traffic flow is 20% and 80%. A U-shaped curve is fitted for the relationship between truck-related crashes and traffic composition. The overall speed of traffic flow is declined with the mixture of truck. The overall traffic flow is between 70 and 100 km/h. The speed of traffic flow decreased with the appearance of trucks.
There is no obvious increase in accidents until truck speed reaches 50 km/h. Accidents are unlikely to happen when truck speed is below 30 km/h. When it reaches 70 km/h, there is a drastic increase in all types of crashes. Three types of crashes increased to 120, 50, and 30 per year, respectively.
The ordered probit model was used to identify the variables associated with crashes. Factors including time of day, truck percentage, average slope, exposure variable, speed, and speed difference are significant at 0.05 significant levels. Fatal crashes are likely to occur during midnight and dawn. All these seven influential factors result in severe injury. The factors including the average slope of road segment and speed gaps have the greatest impact on all severity levels of crashes.
Marginal effects are calculated to decide the explanatory variable change effect on severity level. It can be found that average slope has the greatest impact on all levels of severity. Furthermore, the truck appearing in traffic flow increases the probability of slight injury. The adjusted value of 0.1831 shows a quite good fitness of estimating model.
The model indicates that countermeasure should be used to prevent truck-involving crashes when truck percentage approaches 20% or 80% such as variable speed limit. Besides, more attention should be paid to truck crashes during dawn.
Footnotes
Handling Editor: Jiangchen Li
Declaration of conflicting interests
The author(s) declared no potential conflicts of interest with respect to the research, authorship, and/or publication of this article.
Funding
The author(s) disclosed receipt of the following financial support for the research, authorship, and/or publication of this article: The project received sponsor from the National Key R&D Plan of China (2017YFC 0803900) and the National Natural Science Foundation of China (51878066).